
Stress Detection Through Speech Analysis
Kevin Tomba
1
, Joel Dumoulin
1
, Elena Mugellini
1
, Omar Abou Khaled
1
and Salah Hawila
2
1
HumanTech Institute, HES-SO Fribourg, Fribourg, Switzerland
2
AIR @ En-Japan, Tokyo, Japan
Keywords:
Stress Detection, Speech Emotion Analysis, Audio Processing, Machine Learning.
Abstract:
The work presented in this paper uses speech analysis to detect candidates stress during HR (human resources)
screening interviews. Machine learning is used to detect stress in speech, using the mean energy, the mean in-
tensity and Mel-Frequency Cepstral Coefficients (MFCCs) as classification features. The datasets used to train
and test the classification models are the Berlin Emotional Database (EmoDB), the Keio University Japanese
Emotional Speech Database (KeioESD) and the Ryerson Audio-Visual Database of Emotional Speech and
Song (RAVDESS). The best results were obtained with Neural Networks with accuracy scores for stress de-
tection of 97.98% (EmoDB), 95.83% (KeioESD) and 89.16% (RAVDESS).
1 INTRODUCTION
Automating some of the HR recruitment processes al-
leviates the tedious HR tasks of screening candidates
and hiring new employees. This paper summarizes
the results of applying several speech analysis ap-
proaches to determine if the interviewed candidates
are stressed.
Automatic video analysis is adopted in an HR
screening product, to be able to automatically detect
stress during an interview process. The screening
process works as follows: 1) the candidate receives
an invitation for a screening, 2) he/she connects to
the Website (usually an interview platform) and 3) is
asked a few questions. For each question, the candi-
date records his/her answer whilst respecting a prede-
fined time limit. Once validated, the video is sent to
the recruiter and can be visualized later on.
In order to help the recruiter in the process of mak-
ing his decision, the candidate’s stress is assessed us-
ing speech analysis techniques.
2 RELATED WORK
Several existing studies target emotion recognition
through speech analysis.
Speech emotion analysis focuses on the non-
verbal aspect of the speech. Studies have shown that
emotions show different patterns and characteristics
through vocal expressions (Banse and Scherer, 1996).
Because of the high number of ethnicities and
people in the world, the speech analysis field remain
fairly complicated. Moreover, the complex nature of
voice production and the different families between
emotions (like cold anger and hot anger for example)
increase even more the complexity.
The emotions expressed through the voice can be
analyzed in three different levels:
• Physiological: Describes nerves impulse or mus-
cle innervation patterns involved in the voice pro-
duction process.
• Phonatory-articulatory: Describes the position
and movements of the major structures like the
vocal folds (also called more commonly vocal-
cords).
• Acoustic level: Characteristics of the audio signal
produced by the voice.
The study summarized in this paper focus on analyz-
ing the acoustic level as it is a non-intrusive method
and it is widely used across various studies (e.g. (Lan-
jewar et al., 2015; Seehapoch and Wongthanavasu,
2013)).
Currently, stress cannot be precisely defined
(Johnstone, 2017). However, it is subject to a lot of
recent studies because of its importance for people in
everyday life. The results are hard to interpret because
reaction against stress can be different among people,
everyone having a certain behavior towards it. Plus,
stress can have different forms, like cognitive or emo-
tional.
394
Tomba, K., Dumoulin, J., Mugellini, E., Khaled, O. and Hawila, S.
Stress Detection Through Speech Analysis.
DOI: 10.5220/0006855803940398
In Proceedings of the 15th International Joint Conference on e-Business and Telecommunications (ICETE 2018) - Volume 1: DCNET, ICE-B, OPTICS, SIGMAP and WINSYS, pages 394-398
ISBN: 978-989-758-319-3
Copyright © 2018 by SCITEPRESS – Science and Technology Publications, Lda. All rights reserved

In (Johnstone, 2017), stress is defined as a people
state in different situations that may cause anxiety or
mental challenge. Since it looks like stress has char-
acteristics really close to anxiety, particular attention
has been given to anxiety characteristics.
3 METHODOLOGY
3.1 Feature Selection
In order to identify different emotions in a human
speech, features like pitch (also referred as funda-
mental frequency), articulation rate, energy or Mel-
Frequency Cepstral Coefficients (MFCCs) are used.
In (Banse and Scherer, 1996), a complete table
listing speech characteristics according to 6 emotions
is presented. By analyzing this table, it appears that
mean energy and mean intensity could be enough
to successfully distinguish the 5 following emotions:
happiness, disgust, sadness, fear/anxiety (stress) and
anger. The MFCCs do not appear in this table but will
also be chosen for speech analysis because of their ex-
cellent results in such problems. Mean energy, mean
intensity and the MFCCs are therefore chosen as fea-
tures for emotions classification.
3.2 Feature Extraction
3.2.1 Mean Energy
The vocal energy is defined by the following formula
(Boersma and Weenink, 2006):
Z
t
2
t
1
x
2
(t)d t (1)
where t
1
and t
2
are the beginning and the end of the
audio signal and x(t) the signal function. If the unit of
the amplitude is in [Pa], the obtained energy is then in
[Pa
2
s].
Since such mathematical formula is not easy to
implement in a programmatic way (mostly because
x(t) is unknown), the results obtained with a Python
library have been compared with the results returned
by the Praat software (which use the above formula).
To compare the results, different audio samples
have been chosen and for each one, the mean energy
computed using Praat then Python.
It turned out that the values are not exactly the
same but they follow the same tendency for every au-
dio sample.
3.2.2 Mean Intensity
The vocal intensity is the amplitude of the signal, in
[dB]. In order to have a mean intensity, the follow-
ing formula is applied to the signal (Boersma and
Weenink, 2006):
10log[1/(t
2
−t
1
)
Z
t
2
t
1
10
x(t)/10
dt] (2)
with t
1
being the beginning of the frame and t
2
the end
of it. As for the mean energy, comparison have been
done between Praat and a Python library allowing to
extract the mean intensity.
3.2.3 Mel Frequency Cepstral Coefficients
The speech produced by a human being involves a se-
quence of complicated articulator movements but also
the airflow from the respiratory system. The vocal
cords, the tongue, the teeth, these are all elements that
filter the sound and make it unique for every speaker.
The sound is therefore determined by the shape of
all these elements. This is where MFCCs come in
to play, this shape manifests in the envelope of the
short time power spectrum, and the MFCCs represent
this envelope (Lyons, 2015). Several steps are done in
order to extract these coefficients from an audio file:
the framing, the windowing, FFT (Fast Fourier Trans-
form), Filter Banks and the MFCCs step.
The output of such computations is a NxM matrix
with N being the number of frames obtained after the
framing step (a frame is usually 25-40ms long) and M
the number of coefficients, which is 13. It is possible
to extract 26 (deltas) or 39 (deltas-deltas) coefficients
according to the needs. The deltas give the trajectories
of the coefficients and thus give information about the
dynamics of the speech.
The deltas-deltas are computed from the deltas
and inform on the acceleration. In this work, only the
13 first coefficients are used because the deltas and
deltas-deltas represents only small details and the 13
first coefficient contribute to most of the Automatic
Speech Recognition.
All these features are obtained with a couple of
Python programming language libraries which use a
somewhat different approach that the mathematical
formulas cited above. However, as seen in the pre-
vious chapters, the results are the same and it does
not affect the classification performance.
3.3 Datasets
Three different datasets were used, the Berlin Emo-
tional Database (EmoDB) (Burkhardt et al., 2005),
the Keio University Japanese Emotional Speech
Stress Detection Through Speech Analysis
395
Database (KeioESD) (kei, ; Mori et al., 2006;
Moriyama et al., 2009) and the Ryerson Audio-Visual
Database of Emotional Speech and Song (RAVDESS)
(Livingstone et al., 2012). The first one, EmoDB,
contains about 500 audio files where 10 different ac-
tors spoke in German in 7 different emotions. The
length of an audio file varies from about 2 to 4 sec-
onds. The second one, in Japanese, is a set of words
pronounced by a male speaker. There is a total of 19
words spoken in 47 different emotions. Since it is
only words and not sentences, the average length of a
file is 0.5 second. Finally, the third dataset contains
about 1000 samples with different sentences spoken
by different speakers (24), male and female. As for
the EmoDB dataset, the sentences last for about 3 sec-
onds.
4 EXPERIMENTS
Four kinds of feature sets have been built from the
data obtained in the datasets. There are several ways
to handle the MFCCs and these feature sets will allow
to determine which one is the best.
For the MFCCs, the framing window size is set
to 25ms and the number of coefficients returned is 13
(deltas and deltas-deltas are omitted). Note that the
frames overlap themselves and that the step length be-
tween 2 frames is 10ms.
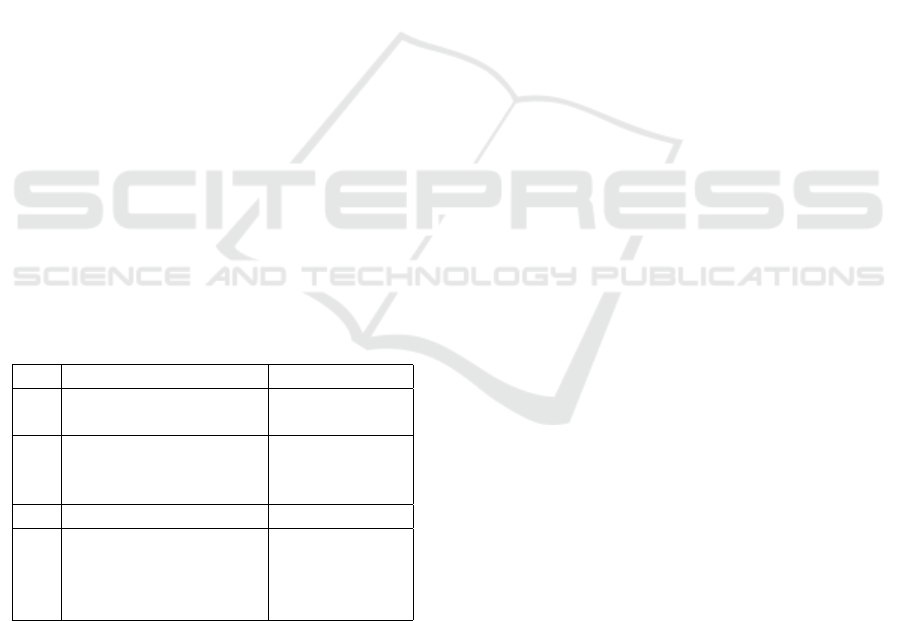
The Table 1 summarizes the created feature sets
and the features they contain.
Table 1: Feature set variants.
No Features Nb. of features
1
Mean energy
Mean intensity
2
2
Mean energy
Mean intensity
Every MFC coefficient
2 x (n x 13)
3 Every MFC coefficient n x 13
4
Mean energy
Mean intensity
Mean of MFCCs
Std. of MFCCs
2 + (13 x 2)
When every MFC coefficient is mentioned, this
means that each value in the MFCCs matrix is used
as a feature. This concept leads to big feature sets
with more than one thousand features. In the number
of features column, n represents the number of line of
the matrix (therefore the number of frames obtained
after the framing step).
Even if stress is the targeted emotion for this re-
search, tests have also been done on features sets con-
taining five emotions (labels) as well as on feature
sets having only two emotions (Anxiety/Stress and
No Stress). The five chosen emotions are Happiness,
Disgust, Sadness, Anxiety/Stress and Anger. Stress is
an emotion that cannot be clearly defined but is how-
ever rather close to anxiety, especially when it comes
to interviews.
Various algorithms are used for supervised learn-
ing in speech analysis problems. Among them, Ar-
tificial Neural Networks (ANNs), Hidden Markov
Model (HMM), Gaussian Mixture Model (GMM),
Support Vector Machines (SVMs) and even Nearest
Neighbors (kNN) are the ones frequently mentioned.
Each of them have proved significant results when it
comes to classification problems. In this paper, SVMs
and ANNs have been chosen. The choice is motivated
by the fact that both algorithms are implemented in
the library used for the machine learning experiments
and also because a comparison can be done with an-
other study dealing with SVMs and the same datasets
(Seehapoch and Wongthanavasu, 2013).
The datasets have been divided with a 1/4 ratio,
25% of the data has been used as test set and 75% as
training set. Grid search was applied to exhaustively
search the best hyper-parameters, as well as the best
feature set construction, for both ANNs and SVMs.
The accuracy scores obtained after this fine-tuning
step are presented in the following section.
5 RESULTS
The results obtained highlight the fact that the
MFCCs are obviously very good speech analysis fea-
tures and that mean energy and mean intensity are
not enough to successfully classify emotions. Also,
the best way to use the MFCCs is when their mean
and standard deviation are computed. This construc-
tion has shown the best results for almost every clas-
sification with either ANNs or SVMs. Both algo-
rithms have shown excellent results, with ANNs hav-
ing slightly better scores than SVMs.
The table 2 displays the accuracy scores obtained
on the KeioESD dataset for a multiclass classification
using SVMs and ANNs respectively.
The table 2 shows that the third feature set format
is the best with SVMs. However, the fourth format
would be a privileged choice for ANNs. The overall
best accuracy score obtained for both algorithms is
the same but using a different feature set format.
In addition to accuracy scores, confusion matrices
have also been computed to see if there are emotions
that are easier to classify than others. Fig. 1 shows the
SIGMAP 2018 - International Conference on Signal Processing and Multimedia Applications
396
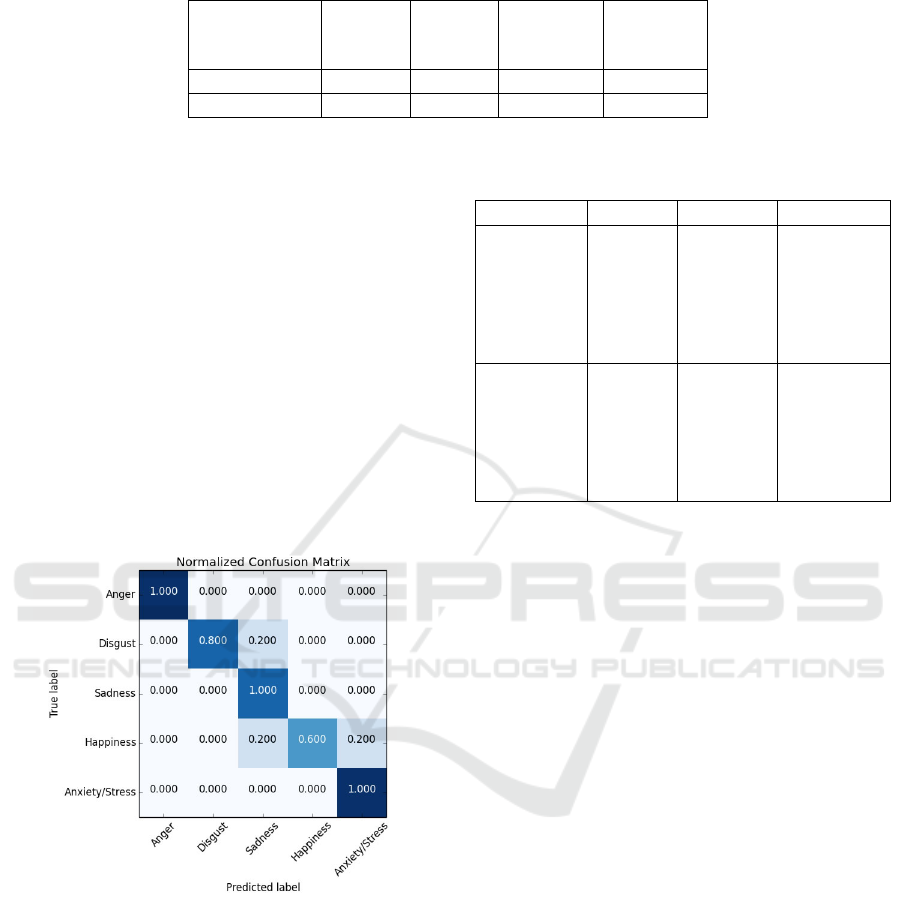
Table 2: Accuracy scores obtained for multiclass classification on KeioESD dataset with SVM and ANN.
Classification
algorithm
Without
MFCCs
With
MFCCs
Only with
MFCCs
Mean and
Std of
MFCCs
SVM 20.83% 75% 83.3% 50%
ANN 20.83% 62.5% 70.83% 83.33%
confusion matrix obtained for a multiclassification on
the KeioESD dataset using ANNs. Happiness (which
is the only positive emotion in this paper), is the most
difficult to successfully classify whereas anger, sad-
ness and stress have a perfect score of 100
Results for EmoDB and RAVDESS datasets show
that the fourth feature set format performs better
with multiclass and two-class classification. Accu-
racy scores are better with this latter format and con-
fusion matrices show overall higher scores for every
emotion.
With the fourth feature set format, the length of
the audio file does not matter (since the MFCCs are
averaged) which is a really good thing knowing that
the number of features must be the same for an un-
classified sample and for the feature set the classifier
has been trained with.
Figure 1: Confusion matrix for multiclassification on
KeioESD dataset using ANNs.
Because of the complexity of such algorithms, a
set of parameters have been chosen with a range of
value for each parameter.
The Table 3 shows the best accuracy scores ob-
tained for each dataset and the optimal algorithm as-
sociated along its parameters value, including two-
class feature sets. For ANNs, the parameters are, in
order, activation method, solver, alpha value and the
maximum number of iterations. For SVMs, parame-
ters are kernel, C coefficient and gamma value.
Both SVMs and ANNs parameters have been opti-
Table 3: Best accuracy scores obtained KeioESD dataset
with SVM and ANN.
Feature set EmoDB KeioESD RAVDESS
Multiclass
[ANNs]
tanh
adam
0.00001
500
87.23%
[ANNs]
logistic
adam
0.001
500
83.33%
[ANNs]
relu
adam
0.00001
1000
78.75%
Two-class
[ANNs]
relu
adam
0.00001
500
97.87%
[SVMs]
linear
1
0.01
95.83%
[ANNs]
relu
adam
0.001
500
89.16%
mized with the help of the scikit-learn library method
GridSearchCV. This method is in charge of finding
the best combination of values where the algorithm
gives the best result for a given set of features.
Experiments on emotion detection through speech
have been conducted in (Seehapoch and Wongth-
anavasu, 2013) focusing on SVMs. Since SVMs are
also used in this work, it is interesting to compare
the results. MFCCs are also used as features in their
work, however in a different way. It is stated that there
is a number of 105 features, but it is however not
clearly explained how this number is obtained from
the MFCCs and if this number is the same for each
dataset.
Moreover, two of the three datasets they used
are similar to some used in the present work, the
KeioESD and the EmoDB datasets. The Table 4
compares the accuracy results they obtained with
the results obtained in this paper with the use of
MFCCs only (third feature set format) on two differ-
ent datasets.
The results obtained in the present paper are a
little bit worse, which is understandable since in
(Seehapoch and Wongthanavasu, 2013) the MFCCs
seemed to have been used in a better way than just
used as single feature (each coefficient becoming a
feature). It is hard to evaluate this comparison be-
cause the way the MFCCs they used is not clearly
explained. The parameters used to get the MFCCs,
like the window length or the step length are also not
Stress Detection Through Speech Analysis
397
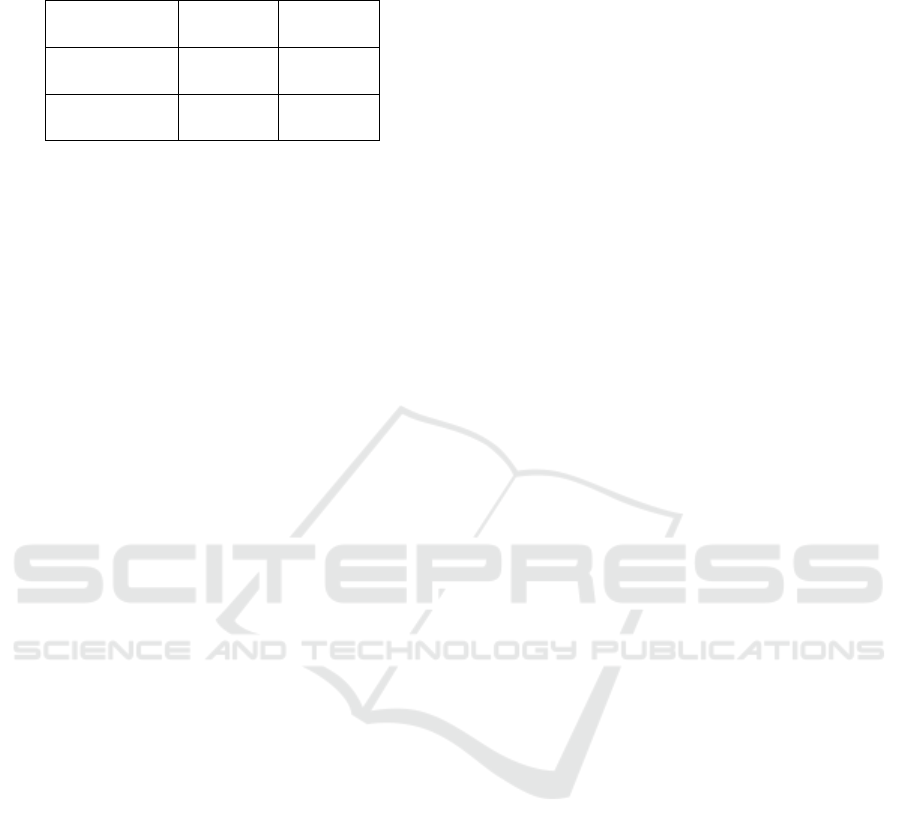
Table 4: Comparison of present paper with (Seehapoch and
Wongthanavasu, 2013).
Features
Accuracy
EmoDB
Accuracy
KeioESD
Seehapoch et
al., 2013
78.04% 89.23%
Present paper
method
71.23% 83.33%
explicitly stated.
The accuracy scores obtained are really close to
those observed in (Seehapoch and Wongthanavasu,
2013). The chosen features allow to perform a good
classification, especially when it comes to determine
if there is stress or not.
6 CONCLUSION
The main goal of this work, which was to detect stress
through speech analysis, has been completed on three
different datasets: i) EmoDB (German), ii) KeioESD
(Japanese) and iii) RAVDESS (English). The use
of the mean energy, the mean intensity and MFCCs
proved to be good features for speech analysis, espe-
cially the MFCCs. The best way to use these MFC co-
efficients is the computation of the mean and the stan-
dard deviation of each of them, instead of using them
as a single feature which can lead to very large fea-
ture sets. Neural Networks show the best results even
if Support Vector Machines are really close. Both al-
gorithms perform really well for such classification
problem.
To conclude, it is interesting to note that the length
of audio files does not have a big impact. The results
for the EmoDB and KeioESD datasets are really close
even if the audio length is not the same (about 3 sec-
onds for the first one and about half a second for the
latter).
The results obtained were satisfying but there is
however room for improvement. To increase the accu-
racy scores, features such as formants, MFCCs deltas
or speech rate could be added to the feature set and
thus used for classification. More time could also be
spent on algorithms optimization. A set of parame-
ters with a range of value have been chosen but this
range could be increased and more parameters could
be used for a better tuning. To finish, acquiring bet-
ter datasets with much more data would be ideal. The
fact that the data is spoken by actors does not exactly
reflect what he is feeling. Because of the complexity
of emotions and the effects behind, having data from
a lot of different people in real life situations would
probably give interesting results.
ACKNOWLEDGEMENTS
We would like to thank the AIR @ en-japan Company
who made this research possible and the precious ad-
vice given by the AIR members Salah Hawila, Maik
Vlcek and Roy Tseng.
REFERENCES
Keio university japanese emotional speech database (keio-
esd). http://research.nii.ac.jp/src/en/Keio-ESD.html.
Accessed: 2018-03-29.
Banse, R. and Scherer, K. R. (1996). Acoustic profiles in
vocal emotion expression. Journal of personality and
social psychology, 70(3):614.
Boersma, P. and Weenink, D. (2006). Praat manual. Ams-
terdam: University of Amsterdam, Phonetic Sciences
Department.
Burkhardt, F., Paeschke, A., Rolfes, M., Sendlmeier, W. F.,
and Weiss, B. (2005). A database of german emotional
speech. In Ninth European Conference on Speech
Communication and Technology.
Johnstone, T. (2017). The effect of emotion on voice pro-
duction and speech acoustics.
Lanjewar, R. B., Mathurkar, S., and Patel, N. (2015). Imple-
mentation and comparison of speech emotion recogni-
tion system using gaussian mixture model (gmm) and
k-nearest neighbor (k-nn) techniques. Procedia Com-
puter Science, 49:50–57.
Livingstone, S. R., Peck, K., and Russo, F. A. (2012).
Ravdess: The ryerson audio-visual database of emo-
tional speech and song. In Annual meeting of the
canadian society for brain, behaviour and cognitive
science, pages 205–211.
Lyons, J. (2015). Mel frequency cepstral coefficient (mfcc)
tutorial. Practical Cryptography.
Mori, S., Moriyama, T., and Ozawa, S. (2006). Emo-
tional speech synthesis using subspace constraints in
prosody. In Multimedia and Expo, 2006 IEEE Inter-
national Conference on, pages 1093–1096. IEEE.
Moriyama, T., Mori, S., and Ozawa, S. (2009). A synthe-
sis method of emotional speech using subspace con-
straints in prosody. Journal of Information Processing
Society of Japan, 50(3):1181–1191.
Seehapoch, T. and Wongthanavasu, S. (2013). Speech emo-
tion recognition using support vector machines. In
Knowledge and Smart Technology (KST), 2013 5th In-
ternational Conference on, pages 86–91. IEEE.
SIGMAP 2018 - International Conference on Signal Processing and Multimedia Applications
398
