
Using Simulations for Exploring Interventions in Social Networks
Modeling Physical Activity Behaviour in Dutch School Classes
Eric Fernandes de Mello Ara
´
ujo
1
, Bojan Simoski
1
, Thabo van Woudenberg
2
, Kirsten Bevelander
2
,
Crystal Smit
2
, Laura Buijs
2
, Michel Klein
1
and Moniek Buijzen
2
1
Behavioural Informatics Group, Vrije Universiteit Amsterdam, Amsterdam, The Netherlands
2
Behavioural Science Institute, Radboud University, Communication Science, Nijmegen, The Netherlands
Keywords:
Agent-based Modeling, Physical Activity, Social Contagion, Social Networks, Behavioural Informatics,
Children.
Abstract:
The reduction of childhood obesity through the promotion of a healthy lifestyle is one of the most important
public health challenges at the moment. It is known that the unhealthy habits of children can cause unavoidable
side effects in their early stage of life, including both physical and mental consequences. This work considers
that the physical activity level of children is a behaviour that can be spread throughout the social relations of
children in their daily life at school. Therefore, the aim of this work is to define what the best strategy is to find
’targets’ (i.e., influential children that can initiate behavioural change) for physical activity (PA) interventions
that would affect the average PA of a population of Dutch school classes. We tuned a model based on the
influence of the children’s peers in their social network, based on the data set from the MyMovez project
– Phase I. Five intervention strategies were implemented, and their efficacy was compared. Once the targets
were chosen, an increase of 17% was applied to their initial PA. Then, the diffusion model was run to verify the
improvement on the PA of the whole network after one year. We discuss implications of the simulation results
on which strategies may be used to make informed choices about the setup of social network interventions
and future model improvements. Our results show that targeting more vulnerable children (i.e. in a worse
environment) and applying a network optimization algorithm are the best solutions for this data set indicating
that future interventions should aim for these two strategies.
1 INTRODUCTION
One of the most important public health challenges
is the prevention and reduction of childhood obe-
sity. It has worldwide priority because the prevalence
of childhood overweight and obesity is still rising.
Childhood obesity has persisting effects on adult adi-
posity and can lead to diseases such as diabetes and
cardiovascular diseases (WHO et al., 2017). Evidence
is accumulating which shows that the social environ-
ment is an important factor underlying the develop-
ment of inappropriate weight gain due to its powerful
impact on energy-balance related behaviours (Chris-
takis and Fowler, 2007). Youth are especially suscep-
tible to environmental influences and are surrounded
by influential individuals (i.e., role models such as fa-
mily and peers) who support and/or undermine their
health behaviours. For example, studies have shown
that individual peers as well as peer groups shape a
youth’s consumption behaviour and physical activity
(Salvy et al., 2012; De La Haye et al., 2011; De la
Haye et al., 2010). Numerous studies have shown that
the health of individuals is connected to each other
and that social networks influence peoples well-being
(Smith and Christakis, 2008; Hammond, 2010).
Social network interventions aim to use influen-
tial individuals to correct unhealthy behaviours within
social networks by letting them promote specific he-
alth behaviours (Valente and Pumpuang, 2007). It
is suggested that when influential individuals stimu-
late and spread the targeted behaviour successfully,
the behaviour will turn into a group norm suppor-
ting long-term behaviour change. The term network
interventions “describes the process of using social
network data to accelerate behaviour change or im-
prove organizational performance” (Valente, 2012).
Social network interventions have been successful in
reducing behaviours such as smoking and unsafe sex
414
Araújo, E., Simoski, B., Woudenberg, T., Bevelander, K., Smit, C., Buijs, L., Klein, M. and Buijzen, M.
Using Simulations for Exploring Interventions in Social Networks - Modeling Physical Activity Behaviour in Dutch School Classes.
DOI: 10.5220/0006857704140425
In Proceedings of 8th International Conference on Simulation and Modeling Methodologies, Technologies and Applications (SIMULTECH 2018), pages 414-425
ISBN: 978-989-758-323-0
Copyright © 2018 by SCITEPRESS – Science and Technology Publications, Lda. All rights reserved

(Campbell et al., 2008; Valente et al., 2003; Kelly
et al., 1991). To date, there is great necessity to target
the physical activity of youth because they are even
less active than previous generations and the majo-
rity of adolescents do not meet daily guidelines of
being active for at least 60 minutes (Hallal et al.,
2012). Hence, social network interventions are now
not only dedicated to reducing childhood obesity by
targeting water and sugar-sweetened drinks but also
increasing physical activity (Hunter et al., 2017; Smit
et al., 2016; Hallal et al., 2012; Van Woudenberg
et al., 2018).
An important step in the design of such interven-
tions is the selection of influential individuals. This
is usually called “influence maximization” (Kempe
et al., 2003; Chen et al., 2009), which is the task of se-
lecting a small subset of nodes (seed nodes) in a social
network that could maximize the spread of influence.
Many algorithms have been suggested and developed,
e.g. (Chen et al., 2010; Nguyen and Zheng, 2013; Liu
et al., 2014). However, most of these papers focus on
the efficiency of the algorithm for selecting the influ-
ential nodes. The aim of this paper is to explore how a
diffusion model can be used to compare the effect on
the spread of behaviour of: (1) different ways to build
the network from questionnaires, (2) different strate-
gies for selecting influential nodes, and (3) different
percentages of the people that are targeted. In order to
do this, we created an agent-based model that is sup-
ported by real data collected from Dutch primary and
secondary school children (Bevelander et al., 2018).
The diffusion model is based on the one used by (Be-
heshti et al., 2017) and (Giabbanelli et al., 2012). We
tuned the model parameters on actual data on physical
activity collected among Dutch school children.
In this paper, we first discuss the literature on
using agent-based models for predicting the effect of
contagion in social networks. Then, in Section 3, we
describe the data and model that we used and the ways
in which we can generate network graphs from the
questionnaires. In Section 4, we report on the simu-
lations that we have performed to tune the model and
to compare the different strategies and networks. Fi-
nally, we discuss the consequences of our findings in
Section 5.
2 BACKGROUND
This section starts by presenting an overview of pre-
vious research studies that implemented agent-based
models to predict intervention effects in social net-
works. Most of them consider the social or peer in-
fluence on the agent’s particular health-related beha-
viour. The basis of our model is an agent-based mo-
del (ABM) of network diffusion of obesity behaviour,
that looks at both environmental and social influences
on physical activity and energy intake in a network.
We continue by looking in detail at the work of (Be-
heshti et al., 2017) and (Giabbanelli et al., 2012), as
our model builds on the model introduced in these pa-
pers.
There are numerous factors to be considered when
selecting an appropriate network intervention, such as
the type of network data, environmental context (e.g.
geographic distance), network structure (highly cen-
tralized network versus decentralized network), pre-
valence of behaviour or agent’s personal characteris-
tics. In the following paragraphs, we review previ-
ous research on network-based interventions for re-
ducing obesity and/or increasing physical activity in
networks. Most of them compare different targeting
methods for testing their effectiveness in diffusion of
health behaviour.
The effects of targeting the most connected indi-
viduals as opposed to random individuals was inves-
tigated by El-Sayed and colleagues (El-Sayed et al.,
2013), with the goal of reducing population obesity
in a social network. They looked at two different in-
terventions, the first one preventing obesity, and the
latter treating obesity, both by targeting 10% of the
population. They concluded that targeting the most
connected individuals may not be effective in redu-
cing obesity in the network.
The selection of intervention strategy should de-
pend on the purpose (the goal) of the particular in-
tervention, as suggested by (Zhang et al., 2015a).
They have studied network interventions for incre-
asing children’s physical activity on a real-life so-
cial network, composed of 81 children living in low
socioeconomic status neighborhoods, out of which
41% was labeled as overweighted or obese. They
used three different network intervention strategies
and concluded that targeting opinion leaders is better
for increasing the physical activity levels in the net-
work as a whole, while targeting intervention in the
most sedentary children is best to increase their own
physical activity levels.
(Zhang et al., 2015b) have studied the effect of
both the social networks dynamics, and peer influ-
ence on overweight in adolescents in a real-life so-
cial network. They proposed an ABM for simulating
the environment, and conducted several experiments
on modifying the network’s dynamics or changing
strength of peer influence, to get a more refined mo-
del. They showed that peer influence can significantly
affect those who are overweight. Bigger peer influ-
ence lowers the prevalence of being overweight, espe-
Using Simulations for Exploring Interventions in Social Networks - Modeling Physical Activity Behaviour in Dutch School Classes
415

cially in low-obesity networks. On the other hand, in
high-obesity networks, inducing stronger peer influ-
ence can have an unwanted reversed effect of further
increasing the population’s weight.
A “bottom-up” agent-based approach was intro-
duced by (Trogdon and Allaire, 2014), modeling
the food consumption and friend selection at indi-
vidual levels, for weight loss interventions. They
have shown that the underlying social network can
influence the effect of population-level interventions.
Looking at the network structure, they have conclu-
ded that aggregate effects of population-level inter-
ventions are bigger in clustered networks, compared
to scale-free networks. In addition, targeting parti-
cular agents of the network can be important for so-
cial network interventions. Selecting the most popu-
lar obese agents for the weight loss intervention, re-
sulted in greater weight loss in the population than
selecting a random assortment of obese targets.
Looking at the related work, we can conclude that
literature gives contradictory outputs, possibly as a re-
sult of the complexity of social networks and the nu-
merous factors that can influence network interven-
tions as explained above. Choosing leaders as tar-
gets for intervention is shown as effective in (Zhang
et al., 2015b), (Trogdon and Allaire, 2014), as oppo-
sed to (El-Sayed et al., 2013). Evaluating new met-
hods of targeting obesity interventions is needed in or-
der to create both cost-effective and time-effective so-
cial networks interventions. Following this idea, (Be-
heshti et al., 2017) have developed an ABM, an adap-
tation of the model proposed by (Giabbanelli et al.,
2012), that simulates the results of five targeting ap-
proaches, and integrates three key factors that influ-
ence the diffusion of intervention effects in a social
network. These factors are: personal characteristics
of agents, social network ties (social influence) and
environmental influence. The authors propose two
network interventions, the first one with the aim of
reducing energy intake and the latter for increasing
physical activity, both targeting 10% of the popula-
tion. The individual traits of the agents, like BMI,
sex, energy intake, environment, etc. were attributed
based on the NLSY79 data set. The same data set was
used to validate the model, and compare the simulated
weight changes trends of the model, with the histori-
cal weight trends of the NLSY79 dataset. Comparing
the effectiveness of the proposed targeting strategies,
they concluded that targeting based on network infor-
mation, outperforms more traditional targeting appro-
aches like selecting high-risk agents or vulnerable ca-
tegories (e.g., obese or low-income agents, respecti-
vely). Their most efficient targeting method is based
on influence maximization and is explained in details
in Section 3. (Beheshti et al., 2017) simulations are
based on an artificial network built following a power
law degree distribution and homophily properties. In
this work, a real social network is used, which is deri-
ved from data collected through surveys, as explained
in Section 3.
3 METHODS
This section presents the methods used for this rese-
arch. First we describe the data collected and how the
characteristics of the population of children were used
for the design of the ABM. Next we explain the model
in detail, as well as the process of tuning the parame-
ters to better fit the model to the empirical data. Then,
we explain the strategies tested for selecting the tar-
gets for the interventions.
3.1 The Data
The data have been collected in the MyMovez pro-
ject – Phase I (Bevelander et al., 2018). This is
a large-scale cross-sequential cohort study among
school children (N=953; 8-12 and 12-15 years-old)
from 21 primary and secondary schools in the Net-
herlands. The MyMovez project – Phase I consists
of five data collection waves over 3 years, starting
in 2016: February/March 2016 (Wave 1), April/May
2016 (Wave 2), June/July 2016 (Wave 3), Febru-
ary/March 2017 (Wave 4) and February/March 2018
(Wave 5). In this paper, we used data from the 4 first
waves, as the data collected for wave 5 is still being
processed. The collected data contains information
about the children’s social network, media consump-
tion, psychological determinants of behaviour, physi-
cal environment, eating behaviour, socialization cha-
racteristics and physical activities. The children were
surveyed in many aspects through the MyMovez appli-
cation on a research smartphone provided by the pro-
ject in order to collect their impressions about their
classmates and their own routine and habits. Parti-
cipants’ weight and height are measured individually
by a trained researcher following standard procedu-
res (without shoes but fully clothed) in Wave 2 and
4. The BMI is calculated as
weight(kg)
height(m)
2
. Data on physi-
cal activity is collected using a wearable device (bra-
celet) that tracks the steps of the participants for 5
days in a row (week and weekend days). For more
detailed information, see the MyMovez project (Beve-
lander et al., 2018). For the current study, we selected
school classes with more than 80% of participation in
the experiment, resulting in 26 classes out of 196. 455
participants were removed from the data set for not
SIMULTECH 2018 - 8th International Conference on Simulation and Modeling Methodologies, Technologies and Applications
416

taking part in the selected classes. The total number
of children after the cleaning of the data (removal of
participants with missing data) is 451. The data was
processed using Python 3 and the NetworkX library
combined with Pandas data frames.
3.2 Model Implementation
The network-oriented model used for this work is ba-
sed on diffusion dynamics of behaviour throughout a
social network. That means we assume that behavi-
our change regarding obesity aspects (physical acti-
vities and energy intake) are spread throughout one’s
relationships. The model is based on the work of (Gi-
abbanelli et al., 2012) and some of the adaptations of
(Beheshti et al., 2017) were also taken into account,
as explained below. Two main factors are considered
as determinants for the agents’ behaviour change: the
influence via the social network and the environmen-
tal influence.
Social network influence is the influence from
peers, i.e. those people who are connected to the
agents. The environmental influence is based on the
social-economical conditions of each child. Many
factors are important to assess the lifestyle of child-
ren and quantify it. In this paper, we focus on the
spread of physical activity (PA) as a measure of he-
althy behaviour. Therefore the interventions applied
will increase the PA of the selected participants.
The PA changes for the simulations are calcula-
ted in 3 steps, according to the method presented by
(Giabbanelli et al., 2012):
1. the influence on the individual by their friends;
2. the combination of the friends influence with the
influence from the environment; and
3. a threshold used to decide if an individual’s PA
will be changed or not.
(Beheshti et al., 2017) and (Giabbanelli et al.,
2012) treated the connections as binary variables,
where a connection has a weight of 1 in case a relati-
onship exists and 0 otherwise. For this work we mea-
sured the strength of the connections as float numbers
between 0 and 1, as is going to be explained in Section
3.3. For this reason, we adjusted the formulas for step
(1) regarding the weights of the edges as being part of
the calculation of the peers’ influences. For step (1),
equation 1 show the friends influences based on the
weight of the connections and the difference between
the states of PA.
in f
PA
i
(t) =
∑
j
(PA
j
(t − 1) − PA
i
(t − 1)) × w
( j,i)
∑
j
w
( j,i)
(1)
A positive in f
PA
i
for node i means that the over-
all influence from i’s friends is positive towards the
PA of agent i. In these circumstances, a good envi-
ronment will further increase PA, while a bad envi-
ronment would do the opposite. For the simulation,
the environment is beneficial when 0 < env < 1 and
harmful when 1 < env < 2. The environment calcula-
tion is explained in detail in Section 3.4.1. Equations
2 and 3 show how step (2) is calculated, combining
the influence of the peers with the influence of the en-
vironment.
in f
PA
i
(t),env
= env × in f
PA
i
(t)
, i f in f
PA
i
< 0 (2)
in f
PA
i
(t),env
=
in f
PA
i
(t)
env
, i f in f
PA
i
≥ 0 (3)
The last part of the influence spread is to compare
the amount of influence with the given threshold. (Be-
heshti et al., 2017) defined the values for low and high
thresholds for EI and PA as 0.002 and 0.2. When tes-
ting these values, many problems with convergence
and steepness were raised in our simulations. For that
reason, we went back to the original model, by (Giab-
banelli et al., 2012) and kept only one threshold, ap-
plying a simulated annealing algorithm to fine tune it,
as explained in Section 3.5. The threshold is used to
define the minimum amount of impact that is going to
cause the behaviour change to take effect. Equations
4 and 5 show the final value for PA in the next time
step t, where f actor = 1+I
PA
, in case in f
PA
i
(t),env
> 0,
and f actor = 1 − I
PA
otherwise.
PA
i
(t) = PA
i
(t − 1), i f |in f
PA
i
(t),env
| < T
PA
(4)
PA
i
(t) = PA
i
(t − 1) × f actor, i f |in f
PA
i
(t),env
| ≥ T
PA
(5)
3.3 Building the Network
The simulations in (Beheshti et al., 2017) are based on
an artificial network, which is built following a power
law degree distribution and homophily properties. In
this work, a real social network is used, which is deri-
ved from data collected through surveys. Twelve que-
stions about the relationships and impressions of other
classmates were asked. In our experiment, we com-
pared three different subsets of questions to build the
network:
1. (Friendship). One question regarding friendship:
“who are your friends?”;
2. (General). 6 general questions, including the
question about friendship regarding respect, ad-
vice, leadership and who they would like to re-
semble; and
3. (All). The questions from 1 and 2 (above) plus
questions regarding physical activities and food
intake behaviours, 12 in total. The extra questi-
ons are related to peers that influence you to eat
healthier, exercise and practice sports.
Using Simulations for Exploring Interventions in Social Networks - Modeling Physical Activity Behaviour in Dutch School Classes
417

Table 1: Density of the networks generated by the different
subsets of questions.
Class Friendship General All
1 0.45 0.67 0.75
2 0.29 0.65 0.71
3 0.34 0.66 0.80
4 0.69 0.85 0.86
5 0.48 0.65 0.72
6 0.58 0.80 0.84
7 0.30 0.46 0.51
8 0.64 0.88 0.95
9 0.60 0.78 0.87
10 0.70 0.79 0.80
11 0.53 0.83 0.87
12 0.53 0.67 0.76
13 0.63 0.81 0.89
14 0.42 0.68 0.73
15 0.50 0.76 0.84
16 0.57 0.78 0.81
17 0.72 0.89 0.89
18 0.46 0.69 0.76
19 0.64 0.91 0.96
20 0.32 0.62 0.73
21 0.40 0.64 0.77
22 0.39 0.59 0.68
23 0.62 0.89 0.91
24 0.50 0.77 0.85
25 0.43 0.67 0.70
26 0.25 0.58 0.72
The edges of our network are bidirectional, and
they account for the amount of influence that the ori-
gin of the edge has on the destination. Every question
generates a nomination from node i to j. This nomi-
nation is interpreted as the influence that node j has
on i. The more nominations a node i gives to j, the
stronger the influence of node j is over i, and therefore
the value for the edge w
j,i
is higher. Each question re-
ceives a different weight of 0 or 1. For each subset
of questions, a different configuration of the weights
for the questions q
n
is given. The total weight for the
edge from node j to node i is given by equation 6.
w
j,i
=
∑
k
n=1
(q
n
nomination
i, j
)
∑
k
n=1
q
n
(6)
The use of different subsets of questions is a way
of mapping different networks based on levels of in-
fluence that can affect a social network. We assume
that the question about friendship explains well who
the people that children prefer to spend their time to-
gether with are, but it can be biased towards other
children in the class who they want to be like, but are
not as close as they want to be. For instance, popu-
lar children in the classroom might influence others,
even if they don’t spend much time together, or are
considered friends. Table 1 shows the density of the
networks for each of the classes selected. As can be
seen, the networks generated by the single friendship
question alone are the least dense, while the networks
generated by using all questions present more con-
nections that raise other levels of influence between
the children.
Table 2: Hamming Distance between the three graphs ge-
nerated by the subsets of questions.
Classes All x General General x Frienship All x Friendship
1 0.08 0.22 0.30
2 0.06 0.36 0.41
3 0.14 0.32 0.46
4 0.02 0.15 0.17
5 0.06 0.17 0.24
6 0.04 0.22 0.26
7 0.05 0.15 0.20
8 0.07 0.24 0.31
9 0.09 0.18 0.27
10 0.00 0.10 0.10
11 0.03 0.30 0.33
12 0.09 0.14 0.23
13 0.08 0.18 0.26
14 0.05 0.26 0.30
15 0.07 0.26 0.34
16 0.04 0.21 0.25
17 0.00 0.17 0.17
18 0.07 0.23 0.30
19 0.05 0.27 0.32
20 0.11 0.29 0.40
21 0.14 0.24 0.37
22 0.09 0.20 0.29
23 0.02 0.27 0.29
24 0.08 0.27 0.35
25 0.03 0.24 0.27
26 0.14 0.33 0.47
To verify if there are significant differences bet-
ween the three generated networks, a Hamming dis-
tance was applied to the edges in the graphs. Table
2 shows the Hamming distance for each of the clas-
ses and the three possible comparisons between the
generated graphs. As is shown, the distance is close
to zero to almost all the classes when comparing the
graph for all questions (3) and the graph of general
questions (2), while the friendship graph (1) presents
a bigger distance compared to the other two. That me-
ans that the network generated by all questions and
the network generated by the general questions pre-
sent almost the same edges in their graphs, while the
graph generated with the friendship question alone
has many different edges from the other networks.
3.4 Agents Characteristics
The agent-based model for the behaviour spread ex-
plained in Section 3.2 requires some information
about the agents. More specifically, it is necessary
to know the PA-level of each agent, as well as the
influence of the environment on each of them, cal-
culated using socio-economic status (SES). The BMI
is also important to know for the interventions that
target high risk children. Here we explain how these
characteristics of the children were extracted from the
empirical data set.
3.4.1 Environment
One of the most influential factors for a healthy li-
festyle is a person’s living environment. Family we-
alth can be a good predictor for a child’s healthy li-
ving environment, with better opportunities for he-
althy eating and physical activity facilities. The Fa-
mily Affluence Scale (FAS) is a simple metric created
SIMULTECH 2018 - 8th International Conference on Simulation and Modeling Methodologies, Technologies and Applications
418

to avoid the difficulties that youth have in reporting
family income or other measures for wealth (Boyce
et al., 2006). (Boyce et al., 2006) argue that the FAS
measures are related to food intake habits and to phy-
sical activity, meaning that this questionnaire can also
be a good predictor for factors related to health as-
pects of a youth’s lives.
In MyMovez project the participants were asked
the following questions:
1. Does your family own a car, van or truck? (No
[0]; Yes, one[1]; Yes, two or more[2]);
2. Do you have your own bedroom for yourself? (No
[0]; Yes [1]);
3. During the past 12 months, how many times did
you travel away on holiday with your family?
(Not at all [0]; Once [1]; Twice [2]; More than
two [3]); and
4. How many computers does your family own?
(None [0]; One [1]; Two [2]; More than two [3]).
The model used for the simulation consider that
more obesogenic environments have a scale factor be-
tween 1 and 2, while healthier environments present a
scale from 0 to 1 (Beheshti et al., 2017). An environ-
ment factor of 1 means neutral. We normalized the
values so all four questions have the same weight in
the overall calculation.
3.4.2 BMI
The Body Mass Index (BMI) is the metric used to de-
fine children with higher risk. That means that the
higher the BMI the higher the risk of a child to be-
come an obese adult. We compared the BMI of the
children from the same class and sorted them to de-
fine the best targets for high risk interventions.
In (Giabbanelli et al., 2012) the overall change in
BMI is used as the outcome measure of the effect of
interventions. Their assumption is that the population
is made of adults, and their height is fixed. But for
children the same assumptions do not stand, as child-
ren have a much more dynamic and complex process
of growing (Sch
¨
onbeck et al., 2011), which is follo-
wed by their BMI. For that reason, in our experiments
we do not use the BMI as the outcome measure, but
the PA level instead. The BMI is only used for the
selection of the targets to apply the interventions.
3.4.3 PA
The participants in the experiment were asked to wear
a Fitibit Flex bracelet for 5 days. The device measu-
red their steps in continuous time with minute to mi-
nute precision. The PA used for the simulations was
based on the number of steps. In (Giabbanelli et al.,
2012) the PA of the simulated agents were drawn as
a normal distribution with a mean value of 1.53, the
level of sedentary individual according to (Food and
of the United Nations, 2004). To normalize the va-
lues for PA in our data set we took the mean PA (in
steps) and converted it to 1.53, in order to keep the
same scale presented in the previous work.
The initial PA for the simulations is calculated as
the average of the 3 first waves, and the final PA is
given by wave 4. Waves 1, 2 and 3 are closer in time
to each other, and also closer to the initial date of the
experiment, while wave 4 is 1 year further.
3.5 Parameter Tuning
Two parameter tuning algorithms are used to fine tune
the thresholds and the speed factors of the model.
First we applied a grid search in the bi-
dimensional space with the threshold (T
PA
) and the
factor (I
PA
) of change. These variables are explained
in Section 3.2 in detail. The grid search guided us to a
subspace where the best results were obtained. Then
we applied simulated annealing to fine tune our opti-
mization search. The simulated annealing algorithm
is an optimization combinatorial method for problem
solving. It is inspired by condensed matter physics,
where annealing denotes a process in which a solid in
a heat bath is heated up to a maximum temperature so
all particles are liquid, and then cooled down slowly
so the solid particles are reorganized (Van Laarhoven
and Aarts, 1987).
We started our simulations with a temperature of
1.0, and the cooling factor was 0.9, until the tempe-
rature was less than 0.01. For each temperature we
explored 20 neighbors. The parameters found by the
simulated annealing are used for the spread of beha-
viour model.
3.6 Strategies for Selecting Targets for
Intervention
The aim of this work is to explore the effect of diffe-
rent strategies to find targets for PA interventions. Se-
veral selection strategies were implemented, and the
effect of applying an (imaginary) intervention to the
selected agents on the overall PA is simulated.
The effect of the imaginary intervention to an in-
dividual is modeled as an increase of 17% of their
initial PA. This value is taken from (Beheshti et al.,
2017) and is chosen based on other research that ap-
ply different sorts of strategies to increase the amount
of PA of people. The initial states of the remaining
Using Simulations for Exploring Interventions in Social Networks - Modeling Physical Activity Behaviour in Dutch School Classes
419

nodes is based on the empirical data. Then, the dif-
fusion model is run to verify the improvement on the
PA of the whole network after one year.
The strategies to select the targets are:
1. Higher risk children (BMI);
2. More vulnerable children (Environment);
3. Most central children in the network (degree cen-
trality);
4. Optimized selection based on the impact of the
children in the whole network;
5. Random selection of the targets.
Strategies (1) and (2) are based on the children’s
characteristics. Strategy (1) uses the BMI as indica-
tor for the risk (the higher the BMI, the higher the
risk). For the BMI we used the data about the child-
ren’s height and weight in the first wave, as shown in
Section 3.4.2. Strategy (2) targets vulnerable child-
ren. Vulnerability is measured based on the child’s
environment. The worse the environment (i.e. lower
socio-economic status), the higher the vulnerability.
For environment we used the FAS measures, as ex-
plained in Section 3.4.1. Strategies (3) and (4) are
based on network characteristics. Strategy (3) is ba-
sed on degree centrality of the nodes given by the Py-
thon toolbox NetworkX 2.1. The degree centrality for
a node v is the fraction of nodes it is connected to.
These values are normalized by dividing them by the
maximum degree possible in the graph.
Strategy (4) selects the k nodes that propagate (or
influence) the other nodes in the network the most.
This is a simple algorithm in which the diffusion mo-
del algorithm is run for each of the nodes in the net-
work after applying the intervention to each of these
nodes separately. After running for all the nodes, the
selected agent is the one that causes the biggest incre-
ase of PA in the whole network. Then after the first
node is selected, the same is done to the other nodes
that were not selected, together with the first node in
the subset of targets. This strategy is based on the “in-
fluence maximization” algorithms used for viral mar-
keting and advertising (Chen et al., 2010; Morone and
Makse, 2015). The difference here is that instead of
searching for nodes being “activated” as an objective
function, we quantify the impact spread throughout
the network as our optimization goal. (Beheshti et al.,
2017) used the same strategy, but the goals were rela-
ted to the decrease of the number of obese people in
the network as the goal. For our optimization algo-
rithm we are interested in the overall increase in PA
for all the participants.
Lastly, strategy (5) selects the targets by random.
This strategy is useful to verify if the other strategies
Table 3: Ratio between boys and girls per class and amount
of targets for each fraction selection.
Class Total of kids Boys Girls 10% 15% 20%
1 18 9 9 2 3 4
2 20 13 7 2 3 4
3 20 14 6 2 3 4
4 12 6 6 1 2 2
5 19 6 13 2 3 4
6 20 10 10 2 3 4
7 25 12 13 2 4 5
8 28 15 13 3 4 6
9 14 7 7 1 2 3
10 16 8 8 2 2 3
11 20 10 10 2 3 4
12 18 7 11 2 3 4
13 17 12 5 2 3 3
14 14 10 4 1 2 3
15 11 9 2 1 2 2
16 17 7 10 2 3 3
17 11 7 4 1 2 2
18 14 9 5 1 2 3
19 9 6 3 1 1 2
20 21 10 11 2 3 4
21 11 8 3 1 2 2
22 20 8 12 2 3 4
23 18 8 10 2 3 4
24 19 9 10 2 3 4
25 20 7 13 2 3 4
26 19 6 13 2 3 4
Total 451 233 218 45 70 91
provide better results than just selecting targets wit-
hout any criteria.
As a third variable (in addition to the different
methods to build the network and the different se-
lection strategies), we compared the effect of the
amount of different percentages of people to which
the (imaginary) intervention was applied. We com-
pared three different fractions: 10%, 15% and 20%
of the nodes in a class. Table 3 shows the ratios bet-
ween boys and girls per class, as well as the amount
of targets to select in each fraction selection.
4 RESULTS
The experiments aim to explore the effect of diffe-
rent networks, different target selection strategies and
different fractions of targets on the overall PA of the
social network. We first present the results of the mo-
del tuning on the empirical data, and then we present
the results of the different simulation scenarios.
4.1 Tuning of Threshold and Change
Factor
Section 3.2 explained the model and the two parame-
ters that should be tuned in order to fit the empirical
data to the simulations: threshold T
PA
and the factor
of change I
PA
. T
PA
is the amount of influence a child
needs to receive from their peers combined with the
environment to be affected and change their behavi-
our. The factor of change I
PA
is the amount of influ-
ence that is going to be propagated to the receiving
SIMULTECH 2018 - 8th International Conference on Simulation and Modeling Methodologies, Technologies and Applications
420
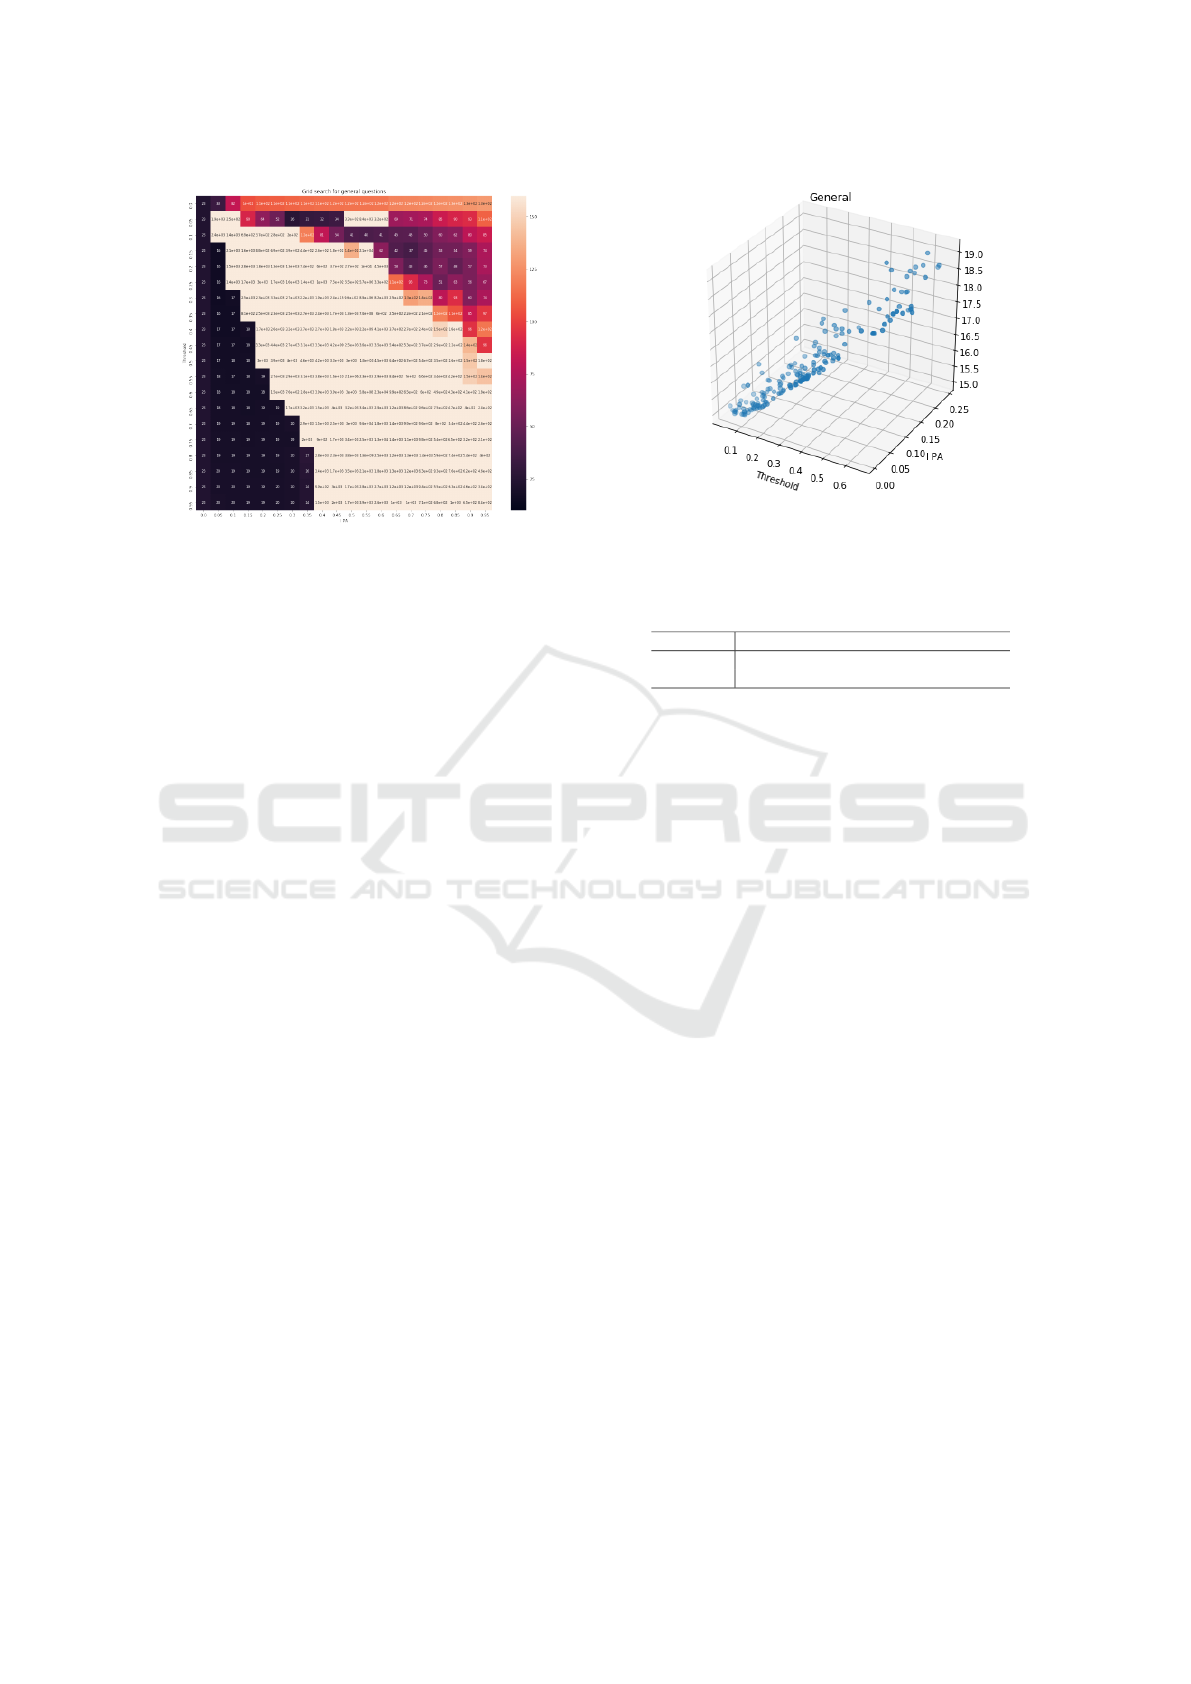
Figure 1: Grid search for the general questions.
node within the network. We used a grid search follo-
wed by a simulated annealing algorithm to minimize
the difference between the empirical data and the si-
mulated data and find the best values for T
PA
and I
PA
.
The tuning was performed in two steps: first, a grid
search algorithm was applied to identify the search
space, and then a simulated annealing algorithm was
used to find the optimal values.
4.1.1 Grid Search
The grid search was performed with interval steps of
0.05. The values for T
PA
and I
PA
were tuned for each
of the networks generated with: (1) all questions, (2)
general questions and (3) friendship questions. As
can be seen in Figure 1, the space where I
PA
< 0.35
showed the smaller errors. The grid search for the ot-
her graphs follow almost the same pattern as the one
presented in Figure 1.
4.1.2 Simulated Annealing
After the space was defined, the simulated annealing
was run. As a result of the grid search, the value of I
PA
was restricted to a maximum of 0.4. To calculate the
error (i.e. the difference between the empirical data
and the simulation) we compared the simulation out-
comes with the data in waves 1 and 4. Waves 2 and
3 were ignored because they are too close to Wave
1. For the simulated annealing, the initial temperature
was 1.0, with an alpha (cooling factor) of 0.9, and a
number of neighbors explored was 20. Increasing the
number of neighbors or slowing down the speed of
the cooling process didn’t significantly improve the
results obtained. The initial parameters for the simu-
lated annealing were threshold = 0.2 and I
PA
= 0.05.
Figure 2 shows the space of search on the simulated
annealing algorithm for the graph created from the ge-
neral questions.
Figure 2: Simulated annealing space of search explored for
the general questions.
Table 4: Best threshold and factor of change for the three
networks generated with (1) all questions, (2) general ques-
tions and (3) friendship question.
All (1) General (2) Friendship (3)
Threshold 0.0942 0.0588 0.0426
I
PA
0.0055 0.0057 0.0041
The best results for threshold and I
PA
for each of
the three networks are presented in table 4.
4.2 Exploring Different Strategies
After fine tuning the model parameters, the diffusion
model was run combined with the strategies to select
targets for intervention in the network. For each class,
three different percentages of the children were cho-
sen as targets. To select the targets, we compared the
use of 5 different strategies: (1) Random selection;
(2) High-risk selection; (3) Vulnerability selection;
(4) Degree centrality selection; and (5) Optimization
selection.
Figure 3 shows the comparisons between the
random selection of 10, 15 and 20% of the agents for
the three networks generated with all questions, gene-
ral questions and friendship question.
We used the random selection (1) of the children
to receive interventions on their PA as a baseline. We
run the random selection for 100 samples and used
the mean to evaluate the average impact of this met-
hod. Increasing the number of tests didn’t cause any
difference to the results.
The selection of the high-risk agents (2) is based
on the BMI of the children in the classes. The child-
ren with a higher BMI have a higher risk of obesity
later on. As shown in Figure 3, the “high risk” is the
worse intervention causing the smallest influence on
increasing PA. Table 5 shows the differences between
the initial (and final) mean PA of the whole network
with no interventions and the initial (and final) mean
Using Simulations for Exploring Interventions in Social Networks - Modeling Physical Activity Behaviour in Dutch School Classes
421
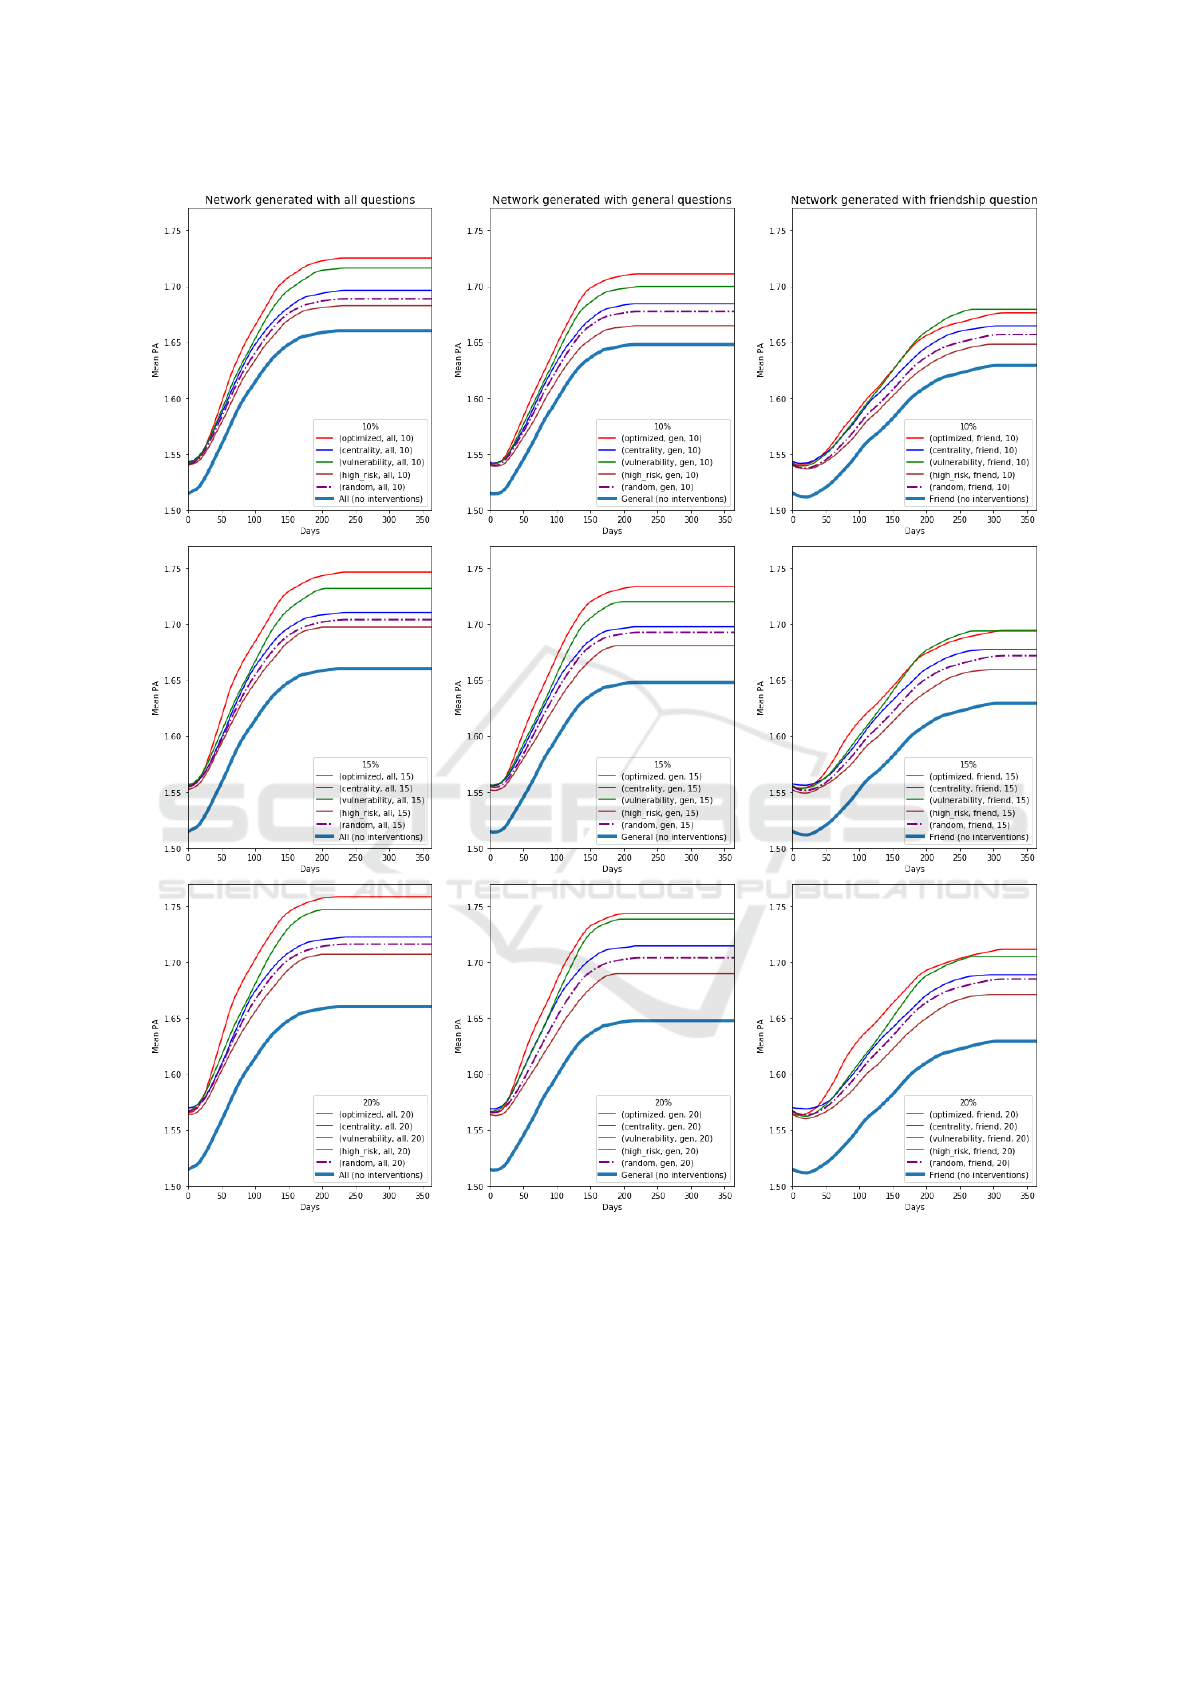
Figure 3: Simulation of average PA for all the strategies for the different percentages of targets in the three rows. The left
column shows the results for the network generated with all questions. The center column is for the network generated with
the general questions set. The right column shows the results for the network generated using the friendship question alone.
PA for the networks with the interventions applied.
The overall difference is how much the difference of
the mean PAs increased (or decreased) from the be-
ginning to the end of the simulation (start-to-end dif-
ference). The overall difference for the high risk is
the only negative one, meaning that after one year of
simulation the mean PA of this intervention is closer
to the simulations without interventions.
The vulnerability (3) was used to select the child-
ren with the least socio-economic situation as targets
for the interventions. For most of the scenarios, this
strategy was one of the two best interventions, perfor-
SIMULTECH 2018 - 8th International Conference on Simulation and Modeling Methodologies, Technologies and Applications
422

Table 5: Differences between initial and end mean PA for
the network generated with all questions and 20% of the
nodes selected for intervention.
Diff (day 0) Diff (day 364) Overall diff
High Risk 0.0491 0.0469 -0.0022
Vulnerability 0.0515 0.0871 0.0356
Random 0.0516 0.05599 0.0044
Centrality 0.0548 0.0623 0.0075
Optimized 0.0508 0.0985 0.0476
ming almost as well as the optimized solution especi-
ally for the network created with the single friendship
question. Strategy (3) shows an overall difference of
0.0356, the second highest (see Table 5).
Strategies based on network degree centrality (4)
were also tested and compared with the others. This
intervention presents better results than the random
selection (1), but are not as good as the strategies (3)
and (5). Some positive improvement in the distance
to the expected changes in the network without inter-
ventions is also perceived (Table 5).
The highest overall PA increase are in the inter-
ventions based on the optimization algorithm. This
strategy is beaten by strategy (3) in one of the nine
scenarios, though it shows the best results for all the
other remaining scenarios. Table 6 presents the va-
lues for the differences between the strategies applied
and the simulation with no interventions. The column
Beginning (day 0) is the initial point and the diffe-
rence between the mean PA for each strategy and no
intervention. The same is valid for the column End
(day 364), that represents the distance (or difference)
on the last day of simulation. The column Difference
is calculated as the value for the day 364 minus the
day 0 for each of the percentages. The Difference (%)
column represents how much increase (or decrease)
of PA is caused by increasing the amount of interven-
tion targets from 10 to 15% of the agents, and from 15
to 20% of the agents. The results from table 6 are im-
portant in order to make the right decision of selecting
the appropriate nodes for real-life intervention. The-
refore, increasing the fraction for the “high risk” stra-
tegy is not beneficial, as there is a degradation of the
difference between mean PA for this strategy and for
the simulation without any interventions.
Choosing targets based on centrality shows that
selecting 15% of agents is better than selecting 20%.
For random and vulnerability selections the impro-
vements caused when increasing the percentage of
targets shows that 20% is a good choice, while for the
optimized strategy there is a very small percentage in-
crease from 15 to 20% (3.03%), which would require
further investigation to decide if selecting 20% of the
nodes instead of 15% is a good decision.
5 DISCUSSION
The simulation results allow us to discuss potential
strategies that may be used to make informed choices
about ways to improve simulation models as well as
the setup of social network interventions.
The strategy of targeting children with high risk
(i.e., higher BMI) turned out to be the least success-
ful compared to the other strategies in this specific
data set and model. It should be noted that our sam-
ple had a small variance in BMI. The majority of the
BMIs are healthy. Therefore, future studies should
test whether a more heterogeneous sample would ge-
nerate different findings. In addition, the model can
be further improved. For example, if BMI would be
used as the dependent variable, it would show how
the overall prevalence of obesity in social networks is
reduced by the intervention. For this, a more com-
plex model is required which accounts for the dyna-
mic change in the BMI categorization in adolescents.
The inclusion of the information regarding the energy
intake of the children would also enrich the model
by providing another independent variable which di-
rectly affects the obesity of the group. The difficulties
of including this variable are related to the data col-
lection, as it would be required to have a method for
assessing the children’s food intake habits. Targeting
children who reported to live in a less wealthy home
environment appeared to be one of the best solutions
and very close to—or even better than—the optimi-
zed strategy in some scenarios. This insight can also
be helpful for the selection of targets in the absence
of the network structure, as a personal characteristic
provides good improvement of the overall PA of the
whole group.
The change in the networks based on different
subsets of question did not reflect drastically diffe-
rent results for the scenarios. That is a good indicator
that the weights of the connections present some sta-
bility when you compare the different graphs, and it
does not affect the spread of behavior process. This
suggests that previous peer-driven intervention stu-
dies which used subsets of 5 nomination questions to
identify the peer leaders have chosen a sufficient num-
ber of questions (Smit et al., 2016; Campbell et al.,
2008). For future research and data collection, these
results indicate that a small subset of nomination que-
stions can be asked to the participants, without losing
quality on the description of the influential ties and
overburdening the participants with questions.
With respect to the fraction of people that are tar-
geted, our results show that it differs per strategy
whether it is beneficial to increase the target group.
This is a finding with important consequences, as the
Using Simulations for Exploring Interventions in Social Networks - Modeling Physical Activity Behaviour in Dutch School Classes
423

Table 6: Differences from the mean PA for each intervention to the simulations without any intervention. The results are
referred to the network generated from all the questions combined.
Beginning (day 0) End (day 364) Difference Difference (%)
10% 15% 20% 10% 15% 20% 10% 15% 20% 10% 15% 20%
High risk 0.0250 0.0374 0.0491 0.0225 0.0371 0.0469 -0.0024 -0.0003 -0.0022 0.00 -88.16 664.07
Vulnerability 0.0267 0.0408 0.0515 0.0560 0.0718 0.0871 0.0294 0.0310 0.0356 0.00 5.69 14.71
Random 0.0256 0.0398 0.0516 0.0286 0.0439 0.0560 0.0030 0.0041 0.0044 0.00 37.31 8.45
Centrality 0.0280 0.0418 0.0548 0.0362 0.0503 0.0623 0.0082 0.0085 0.0075 0.00 3.81 -12.28
Optimized 0.0268 0.0401 0.0508 0.0650 0.0863 0.0985 0.0382 0.0462 0.0476 0.00 20.92 3.03
costs of an intervention usually increases linearly with
the increase of the size of the target group.
6 CONCLUSION
This paper shows how an agent-based model can be
used to explore the effect of different scenarios on the
diffusion of physical activity in children. It is the first
study in which simulations are based on real social
networks and the model has been tuned on actual me-
asurements of physical activity in the network. Study
findings indicate that social network interventions ai-
med at increasing physical activity should take the
socio-economic status of children into account. In ad-
dition, a small subset of peer nomination question is
sufficient to map the children’s social network.
In this study, we have simulated the effect of tar-
geting specific children and applying an intervention
that increases in 17% their PA. We have compared 5
strategies for the selection, in 3 differently generated
networks and with 3 different percentages of targets
selected. We compared these 45 different scenarios
with the expected results when no intervention is ap-
plied. Although this is a comprehensive strategy, the
model used in the simulations is a straightforward dif-
fusion model. As a future work, we would like to test
other, more realistic, contagion models on the same
data set. For example, an option is to use a differen-
tial equation model that includes personality traits to
account for other factors that play a role in the process
of social contagion. Other potential ways to improve
the results would be to combine an optimized strategy
with the vulnerability trait of the agents to verify if it
can show better results than of two strategies alone.
ACKNOWLEDGEMENTS
The research leading to these results has received fun-
ding from the European Research Council under the
European Union’s Seventh Framework Programme
(FP7/2007-2013) / ERC grant agreement n
o
[617253].
E.F.M. Ara
´
ujo’s funding is provide by the Brazi-
lian Science without Borders Program, through the
Coordination for the Improvement of Higher Educa-
tion Personnel, CAPES (reference 13538-13-6).
REFERENCES
Beheshti, R., Jalalpour, M., and Glass, T. A. (2017). Com-
paring methods of targeting obesity interventions in
populations: An agent-based simulation. SSM - Popu-
lation Health, 3:211 – 218.
Bevelander, K. E., Smit, C. R., van Woudenberg, T. J.,
Buijs, L., Burk, W. J., and Buijzen, M. (2018). Youths
social network structures and peer influences: study
protocol MyMovez project–Phase I. BMC public he-
alth, 18(1):504.
Boyce, W., Torsheim, T., Currie, C., and Zambon, A.
(2006). The family affluence scale as a measure of na-
tional wealth: Validation of an adolescent self-report
measure. Social Indicators Research, 78(3):473–487.
Campbell, R., Starkey, F., Holliday, J., Audrey, S., Bloor,
M., Parry-Langdon, N., Hughes, R., and Moore,
L. (2008). An informal school-based peer-led in-
tervention for smoking prevention in adolescence
(assist): a cluster randomised trial. The Lancet,
371(9624):1595–1602.
Chen, W., Wang, C., and Wang, Y. (2010). Scalable in-
fluence maximization for prevalent viral marketing in
large-scale social networks. In Proceedings of the
16th ACM SIGKDD international conference on Kno-
wledge discovery and data mining, pages 1029–1038.
ACM.
Chen, W., Wang, Y., and Yang, S. (2009). Efficient influ-
ence maximization in social networks. In Proceedings
of the 15th ACM SIGKDD international conference
on Knowledge discovery and data mining - KDD ’09,
page 199, New York, New York, USA. ACM Press.
Christakis, N. A. and Fowler, J. H. (2007). The spread of
obesity in a large social network over 32 years. New
England journal of medicine, 357(4):370–379.
De la Haye, K., Robins, G., Mohr, P., and Wilson, C. (2010).
Obesity-related behaviors in adolescent friendship
networks. Social Networks, 32(3):161–167.
De La Haye, K., Robins, G., Mohr, P., and Wilson, C.
(2011). How physical activity shapes, and is shaped
by, adolescent friendships. Social science & medicine,
73(5):719–728.
El-Sayed, A. M., Seemann, L., Scarborough, P., and Galea,
S. (2013). Are network-based interventions a useful
antiobesity strategy? an application of simulation mo-
SIMULTECH 2018 - 8th International Conference on Simulation and Modeling Methodologies, Technologies and Applications
424

dels for causal inference in epidemiology. American
journal of epidemiology, 178(2):287–295.
Food and of the United Nations, A. O. (2004). Human
energy requirements: Report of a joint fao/who/unu
expert consultation.
Giabbanelli, P. J., Alimadad, A., Dabbaghian, V., and Fine-
good, D. T. (2012). Modeling the influence of social
networks and environment on energy balance and obe-
sity. Journal of Computational Science, 3(1):17 – 27.
Hallal, P. C., Andersen, L. B., Bull, F. C., Guthold, R.,
Haskell, W., Ekelund, U., Group, L. P. A. S. W.,
et al. (2012). Global physical activity levels: sur-
veillance progress, pitfalls, and prospects. The lancet,
380(9838):247–257.
Hammond, R. A. (2010). Social influence and obesity. Cur-
rent Opinion in Endocrinology, Diabetes and Obesity,
17(5):467–471.
Hunter, R. F., de la Haye, K., Badham, J., Valente, T.,
Clarke, M., and Kee, F. (2017). Social network in-
terventions for health behaviour change: a systematic
review. The Lancet, 390:S47.
Kelly, J. A., St Lawrence, J. S., Diaz, Y. E., Stevenson,
L. Y., Hauth, A. C., Brasfield, T. L., Kalichman, S. C.,
Smith, J. E., and Andrew, M. E. (1991). Hiv risk be-
havior reduction following intervention with key opi-
nion leaders of population: an experimental analysis.
American journal of public health, 81(2):168–171.
Kempe, D., Kleinberg, J., and Tardos, E. (2003). Maximi-
zing the spread of influence through a social network.
In Proceedings of the Ninth ACM SIGKDD Internati-
onal Conference on Knowledge Discovery and Data
Mining, KDD ’03, pages 137–146, New York, NY,
USA. ACM.
Liu, B., Cong, G., Zeng, Y., Xu, D., and Chee, Y. M.
(2014). Influence spreading path and its application
to the time constrained social influence maximization
problem and beyond. IEEE Transactions on Know-
ledge and Data Engineering, 26(8):1904–1917.
Morone, F. and Makse, H. A. (2015). Influence maximiza-
tion in complex networks through optimal percolation.
Nature, 524(7563):65.
Nguyen, H. and Zheng, R. (2013). On Budgeted Influence
Maximization in Social Networks. IEEE Journal on
Selected Areas in Communications, 31(6):1084–1094.
Salvy, S.-J., De La Haye, K., Bowker, J. C., and Hermans,
R. C. (2012). Influence of peers and friends on child-
ren’s and adolescents’ eating and activity behaviors.
Physiology & behavior, 106(3):369–378.
Sch
¨
onbeck, Y., Talma, H., van Dommelen, P., Bakker, B.,
Buitendijk, S. E., HiraSing, R. A., and van Buuren, S.
(2011). Increase in prevalence of overweight in dutch
children and adolescents: a comparison of nationwide
growth studies in 1980, 1997 and 2009. PloS one,
6(11):e27608.
Smit, C. R., de Leeuw, R. N., Bevelander, K. E., Burk, W. J.,
and Buijzen, M. (2016). A social network-based inter-
vention stimulating peer influence on children’s self-
reported water consumption: A randomized control
trial. Appetite, 103:294–301.
Smith, K. P. and Christakis, N. A. (2008). Social networks
and health. Annu. Rev. Sociol, 34:405–429.
Trogdon, J. G. and Allaire, B. T. (2014). The effect of friend
selection on social influences in obesity. Economics &
Human Biology, 15:153–164.
Valente, T. W. (2012). Network interventions. Science,
337(6090):49–53.
Valente, T. W., Hoffman, B. R., Ritt-Olson, A., Lichtman,
K., and Johnson, C. A. (2003). Effects of a social-
network method for group assignment strategies on
peer-led tobacco prevention programs in schools.
American journal of public health, 93(11):1837–
1843.
Valente, T. W. and Pumpuang, P. (2007). Identifying opi-
nion leaders to promote behavior change. Health Edu-
cation & Behavior, 34(6):881–896.
Van Laarhoven, P. J. and Aarts, E. H. (1987). Simulated
annealing. In Simulated annealing: Theory and ap-
plications, pages 7–15. Springer.
Van Woudenberg, T. J., Bevelander, K. E., Burk, W. J., Smit,
C. R., Buijs, L., and Buijzen, M. (2018). A randomi-
zed controlled trial testing a social network interven-
tion to promote physical activity among adolescents.
BMC public health, 18(1):542.
WHO, U., Mathers, C., et al. (2017). Global strategy for
women’s, children’s and adolescents’ health (2016-
2030). Organization, 2016(9).
Zhang, J., Shoham, D. A., Tesdahl, E., and Gesell, S. B.
(2015a). Network interventions on physical activity
in an afterschool program: An agent-based social
network study. American journal of public health,
105(S2):S236–S243.
Zhang, J., Tong, L., Lamberson, P., Durazo-Arvizu, R.,
Luke, A., and Shoham, D. (2015b). Leveraging so-
cial influence to address overweight and obesity using
agent-based models: the role of adolescent social net-
works. Social science & medicine, 125:203–213.
Using Simulations for Exploring Interventions in Social Networks - Modeling Physical Activity Behaviour in Dutch School Classes
425
