Automatic Quality Assessment of Smart Device Microphone
Spirometry
B. Pinho
1,2
, R. Almeida
2
, C. Jácome
2
, J. P. Teixeira
3
, R. Amaral
2,4
, F. Lopes
1
, T. Jacinto
1,2,4
,
R. Guedes
2
, M. Pereira
1,2
, I. Gonçalves
1,2
and J. A. Fonseca
1,2
1
MEDIDA - Serviços em Medicina, EDucação, Investigação, Desenvolvimento e Avaliação, LDA, Porto, Portugal
2
CINTESIS - Centro de Investigação em Tecnologias e Serviços de Saúde, MEDCIDS,
Departamento de Medicina da Comunidade Informação e Decisão em Saúde, Faculdade de Medicina,
Universidade do Porto, Porto, Portugal
3
INESC TEC Campus da FEUP, Porto, Portugal
4
Escola Superior de Saúde, Politécnico do Porto, Porto, Portugal
Keywords: Asthma, Microphone Spirometry, Spirometry Quality Assessment.
Abstract: Lung function tests are critical for diagnosis and monitoring of asthma and other respiratory diseases.
Monitoring of lung function, in the absence of a healthcare professional, is very challenging but may be
obtained through Smart Devices if automated quality assessment systems guarantee the proper technique
during the forced expiratory manoeuvre. This paper describes the evaluation of one such system that uses the
microphone of smart devices, regarding the initial effort of forced expiratory manoeuvres using the Back
Extrapolated Volume. A health professional recorded microphone spirometry in 55 children (5-10 years),
using a mobile game engineered for the purpose, and registered its quality. At least one acceptable manoeuvre
was achieved for 96% of the children using a featured threshold. Using a stricter threshold of 5% of forced
vital capacity, it was possible to ensure at least one acceptable manoeuvre for 69%. While the obtained results
are comparable to findings in literature for regular spirometry in this age group, further work is required before
we can determine whether the proposed algorithm is effective in real life.
1 INTRODUCTION
Spirometry is the most widely used non-invasive test
of lung function, used for detection and diagnosis of
various respiratory diseases, including asthma, in
children (Pierce, 2005). The performance of a forced
expiratory manoeuvre (FEM) involves three distinct
phases: maximal inspiration; a “blast” of exhalation;
and continued complete exhalation to the end of test
(Miller et al., 2005). On spirometers a plot called a
spirogram is generated at the end of each manoeuvre,
measuring air flow. This is typically presented to
health professionals as a volume-time (Figure 1) and
a flow-volume graph. A FEM requires the coaching
of the patient by a specialized health professional, due
to the quality and repeatability criteria that must be
met (Miller et al., 2005). Assuring that these criteria
are fulfilled is of paramount importance, as
neglecting them has led to over 25% of false-positives
in diagnosing chronic obstructive pulmonary disease
(Moger et al., 2013), and 50% of false-negatives
(Walters et al., 2011).
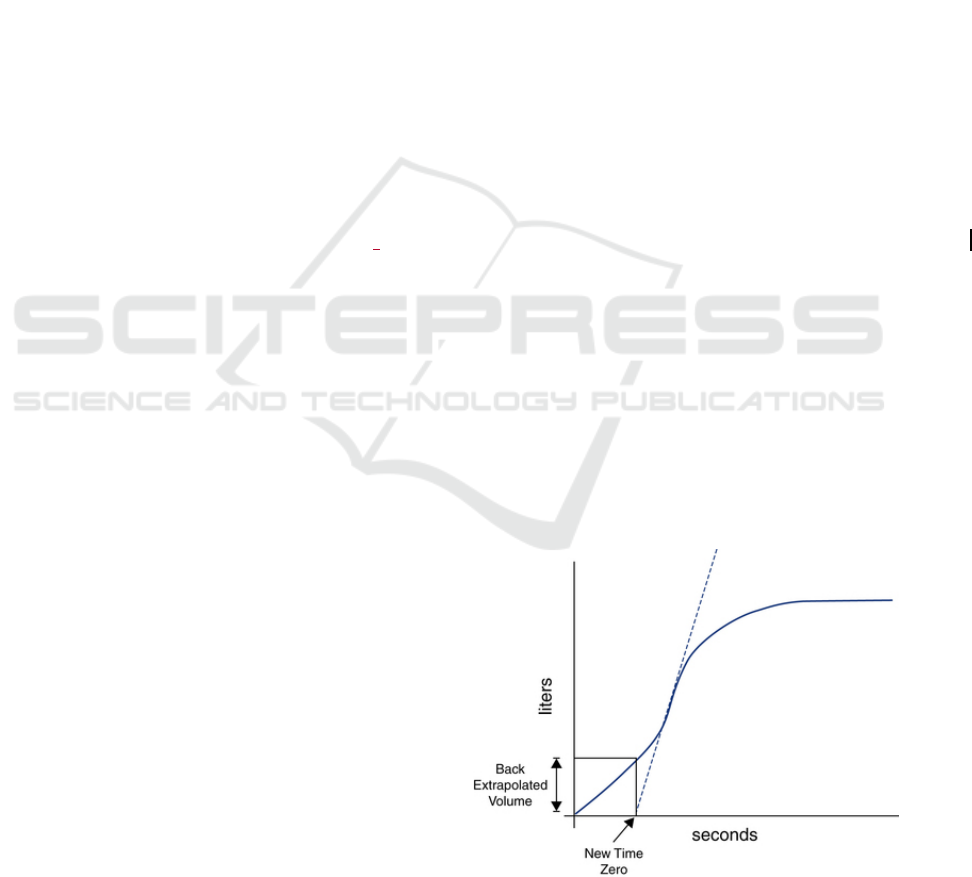
Figure 1: Volume-time curve showing the calculation of the
Back Extrapolated Volume.
Pinho, B., Almeida, R., Jácome, C., Teixeira, J., Amaral, R., Lopes, F., Jacinto, T., Guedes, R., Pereira, M., Gonçalves, I. and Fonseca, J.
Automatic Quality Assessment of Smart Device Microphone Spirometry.
DOI: 10.5220/0006866701150122
In Proceedings of the 8th International Joint Conference on Pervasive and Embedded Computing and Communication Systems (PECCS 2018), pages 115-122
ISBN: 978-989-758-322-3
Copyright © 2018 by SCITEPRESS – Science and Technology Publications, Lda. All rights reserved
115

One of those criteria is the satisfactory start of
exhalation, measured by the back extrapolated
volume being higher than 5% of the Forced Vital
Capacity (the total airflow in litres exhaled by the
patient) or 150mL, whichever is greater (Miller et al.,
2005). The back extrapolated volume is the exhaled
volume at the instant where the maximum derivative
of the volume-time curve crosses the abscissa axis
(Figure 1).
Due to the growing popularity of smart devices,
work has been developed to enable accurate
estimation of FEM medical parameters outside of a
clinical setting (or in otherwise resource constrained
settings) making use of their computational
capabilities and embedded sensors, especially the
microphone (Larson et al., 2012), (Stein, 2013), (Liu,
2013), (Teixeira et al., 2015), (Zubaydi, 2016).
However, there lies a largely unexplored problem
common to all these solutions, which is that of
assuring the validity of the manoeuvre in the absence
of a health professional. In 3 of these works, we have
Improvements in automatic spirometry quality
analysis have been recently developed for clinical
spirometers (Melia et al., 2014), (Luo et al., 2017),
but they do not take into account specific challenges
faced by FEM acquired by microphone, henceforth
referred to as microphone spirometry. To the best of
our knowledge, no work has been done so far in the
field of automatic quality evaluation in microphone
spirometry.
This paper presents a first attempt of automatic
quality evaluation in microphone spirometry,
specifically on an initial effort criterion based on the
ATS/ERS quality criteria (Miller et al., 2005).
Adequate initial effort is already difficult even with
the presence of a specialized health professional
incentivizing the child. In the absence of such
personnel, it becomes even more critical to correctly
determine if the patient exhaled with enough force.
The development of this automatic quality
evaluation module is part of a mobile serious game
called “Ar.cade”. It is a virtual pet game, with an
asthmatic dragon. Its purpose is to allow and
incentivize long term asthma monitoring in children
from 5 to 10 years old, away from their healthcare
professional, via microphone spirometry with smart
mobile devices. While more typical actions such as
feeding and cleaning a virtual pet will be available to
the player, the main focus is on the mini-games.
These revolve around the usage of the microphone as
the main game input, rewarding the player for
properly executed FEM and providing feedback on
how to improve, in case of failed quality criteria.
2 EXPERIMENTAL SETUP
The assessment of identification methods requires a
properly annotated database of microphone
spirometry recordings. Therefore, one mini-game of
Ar.cade was used for data collection and
classification.
2.1 Game Design
Ar.cade is an Android mobile virtual pet game,
developed and implemented in C# using the
FlatRedBall game engine. Among other things, inside
it can be found mini-games that use the microphone
as the main controller, for the purpose of recording
FEM’s. The selected mini-game is a physics-based
game, using the Farseer physics engine. The player
character is a dragon, which is able to make a fireball-
like projectile with its breath (Figure 2).
Figure 2: The game's idle state.
The main game loop consists of a 5 main phases:
1 Inhale phase (Figure 3): the screen zooms in on
the dragon, a countdown with visible and audible
feedback starts, and at the same time the dragon
performs an animation to inhale deeply. As the
countdown approaches the end, other background
sound effects are gradually muted.
Figure 3: The game's inhale phase.
2 Exhale phase (Figure 4): Having all existing game
sounds muted and the countdown finished, the
SPCS 2018 - International Conference on Signal Processing and Communication Systems
116

audio recording starts. The dragon performs an
exhalation animation for a total of 3.5 seconds,
after which the recording stops.
Figure 4: The game's exhale phase.
During this animation, fire particles are blown by
the dragon and a slowly expanding projectile starts to
form.
2 Upgrade phase (Figure 5): Quality of the
manouvre is reflected by upgrading or
downgrading projectile. For now, the final state is
determined by the type of test the healthcare
professional intends to perform, but in the future
the quality detection module will evaluate this
automatically.
Figure 5: The game's upgrade phase.
3 Destruction phase (Figure 6): The projectile is
launched towards a destructible structure built of
blocks with different materials.
Figure 6: The game's destruction phase.
Feedback phase (Figure 7): The player receives an
award based on his/her performance. In the future,
this will be linked with the overarching virtual pet
game’s economy, however currently just serves as
another potential instant gratification source. More
importantly, this will be the place where the player
will receive instructions on how to improve their
manoeuvre and receive the next possible ranking, in
case of a sub-optimal manoeuvre.
Figure 7: The game's feedback phase.
The dragon’s inhale and exhale animations serve
the purpose of incentivizing the child to perform
maximal effort on both phases, while the rest of the
gameplay elements are an attempt to provide the child
with instant gratification for the effort made.
2.2 Audio Processing Pipeline
To extrapolate the flow-time chart from an audio
capture, the processing pipeline (Figure 8) as
presented in (Teixeira et al., 2015) was implemented
in C# for integration with the Ar. cade project. In that
work, an attempt was made to measure and classify
lung function based on signal processing,
constructing the flow-time curve. This would then be
followed by a machine learning stage that enabled the
regression of typical spirometry parameters. To
perform this regression, a previously obtained
database from adults was used for model training
purposes. Given that we have no identical database
for users in our target age group, we were unable to
attempt a similar approach – that is, to try and
establish absolute medical parameters. We have
chosen to rely only on relative spirometry criteria for
this work.
Automatic signal segmentation precedes the pre-
processing stage. This serves to remove non-
expiration sounds from the input to be analysed: a
modified version of the back-extrapolation algorithm
was used to determine the initial instant, and a sliding
window algorithm based on the magnitude ratio
threshold to determine the end (Teixeira et al., 2015).
Automatic Quality Assessment of Smart Device Microphone Spirometry
117
The pre-processing stage attempts to transform
the raw pressure data obtained from the microphone
into the airflow measured at the lips. Afterwards, the
envelope of the signal is extracted, with smoothing
being applied on the post-processing stage.
3 DATA COLLECTION
3.1 Participants
The target population were children with/without
asthma, aged between 5 to 10 years old. Data
collection occurred in an informal environment,
namely with the collaboration of a school.
Data was gathered anonymously, with written
permission of legal guardians of all the children.
Besides the FEM audio recordings, self-reported
data comprised of sex, ethnicity, age, and if they had
asthma. Each child was assigned an internal random
ID, enabling anonymous same-child recording
analysis and comparison.
3.2 Procedures
A specialized healthcare professional performed the
data collection. After introducing the child to the
game’s concept and performing a demonstration of
the game, two different tests were made:
- “Hot air” test: Have the child exhale with a wide
open mouth, focusing on achieving a good
aperture and not emphasizing the need to exhale
with maximal force.
- Maximal force test: Have the child exhale with the
same mouth aperture, only this time with the
added requirement and emphasis of maximal
force, evaluated by the healthcare professional.
For each of these tests, the goal was to achieve at least
one successful recording. At the end of each
maneuver, the healthcare professional registered its
quality with an in-game form assessing the maneuver
on 6 different criteria in a yes/not sure/no format:
- Good mouth aperture
- Good initial effort
- Good continuous effort
- Good finish
- No cough/outside interference
- No glottis closure
3.3 Algorithm Development and
Evaluation
Official guidelines defined by the ATS (Miller et al.,
2005) state that BEV should be lower than 150mL or
5% of the FVC, whichever is higher. As a first attempt
to automatically determine if the manoeuvre’s initial
effort was acceptable or not, the official guidelines
were used in as much as possible, and we
implemented an algorithm for BEV calculation
according to ATS standards (Miller et al., 2005).
Given that we do not have access to absolute
values in our implementation of the processing
pipeline, we chose to only use the relative criterion of
BEV < 5% of FVC. We then compared the results
obtained by this classifier with the healthcare
professional’s classification of the manoeuvres,
acting as our ground truth.
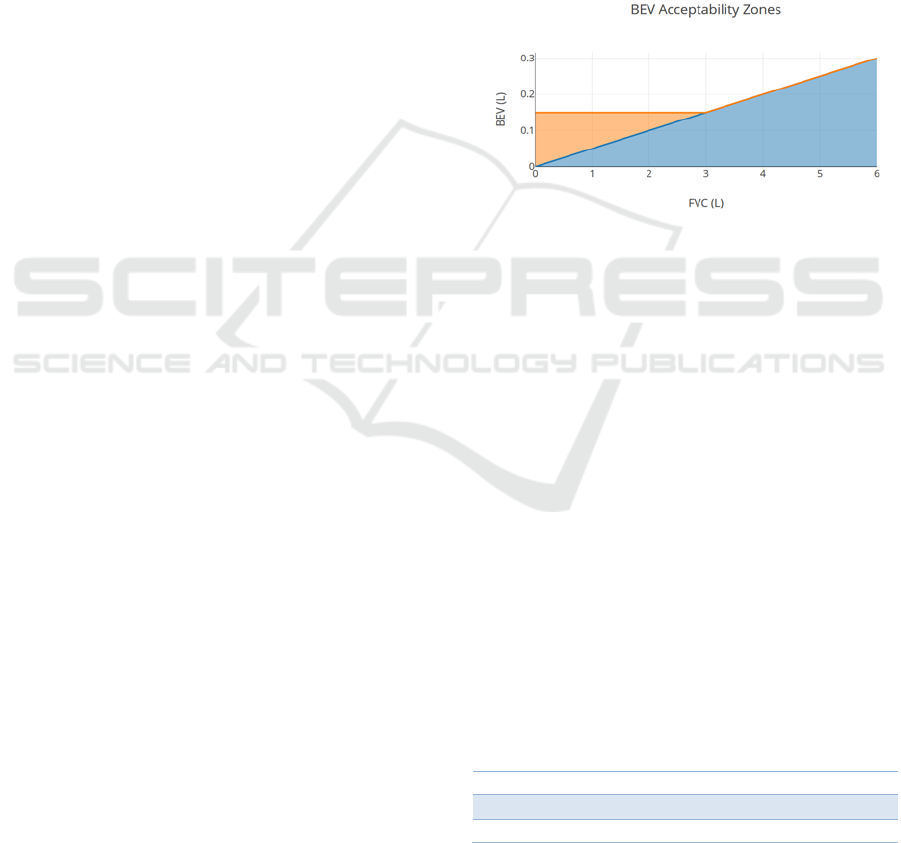
Figure 8: In orange, the acceptable BEV ranges using the
ATS guidelines; in blue, the ranges using the implemented
algorithm (The ATS ranges overlap with the algorithm’s
ranges).
In figure 8 is shown that for FVC values under 3
litres, the ATS guidelines are increasingly more
lenient as the FVC decreases compared to just using
the relative criteria implemented in the algorithm. To
evaluate how relevant this issue is for our collected
data, we used children’s age specific reference
equations for FVC developed by (Koopman et al.,
2011). According to these equations, FVC varies with
age, height and sex. We used the self-reported age and
sex, while for height the World Health Organization’s
height-for-age charts were considered (de Onis et al.,
2007) (“WHO | Height-for-age (5-19 years),” n.d.).
To illustrate the FVC boundaries of our targeted
population the mean FVC, along with the lower and
upper limit of normal (LLN and ULN) for a 5% cut-
off, are shown in tables 1 and 2.
Table 1: FVC percentiles (5% cut-off) for 10-year-old
children in the 99
th
height percentile.
LLN Mean ULN
Male 2.52L 3.02L 3.65L
Female 2.35L 2.86L 3.41L
This allows us to conclude that, for our target age
group, it is more likely to be dealing with cases where
SPCS 2018 - International Conference on Signal Processing and Communication Systems
118

the expected FVC is under 3L, making our algorithm
more stringent than the official ATS guidelines.
Table 2: FVC percentiles (5% cut-off) for 5-year-old
children in the 1
st
height percentile.
LLN Mean ULN
Male 0.73L 0.91L 1.11L
Female 0.82L 1.00L 1.19L
As an initial attempt to overcome this limitation,
we defined an age adjusted BEV threshold for each of
the target ages. This threshold was calculated as thus:
BEV
i
= 0.15/FVC
i
(1)
where FVC
i
is the mean expected FVC value for the
given children’s age (i), assuming the 50
th
height
percentile of the WHO standards. The resulting BEV
thresholds for males and females can be seen on table
3 and 4, respectively. By doing this, we are trying to
have the acceptable BEV for a specific age match the
static 150mL criterion defined by the ATS, but by
using the FVC percentage relative criterion.
The value found for 5-year-old males is in
complete agreement with the findings of (Aurora
2004) in pre-schoolers observed BEV/FVC ratio. In
that work, a possible quality control cut-off of 12.5%
is suggested.
Table 3: Age adjusted BEV thresholds for the 50
th
height
percentile of each presented age in males.
Age 5 6 7 8 9 10
BEV
(%)
12.5 10.7 9.3 8.2 7.0 6.4
Table 4: Age adjusted BEV thresholds for the 50
th
height
percentile of each presented age in females.
Age 5 6 7 8 9 10
BEV
(%)
12.9 11.1 9.8 8.6 7.5 6.6
Considering that the target is the classification
made by the healthcare professional, where positives
indicate an acceptable manoeuvre, the prediction is
the resultant classification by the algorithm for the
specified BEV threshold can be evaluated.
To compare different settings for the algorithm,
two measures were used, namely the F
1
score and
accuracy. The F
1
score is the harmonic mean of
precision and sensitivity given by:
F
1
= 2TP / (2TP + FP + FN)
(2)
and the accuracy, which measures how often is the
classifier correct, with the following formula:
A = (TP + TN) / (TP + TN + FP + FN)
(3)
4 RESULTS AND DISCUSSION
4.1 Participants
A total of 55 children between 5 to 10 years old have
participated, 52 within 8 to 10 years of age. Out of
these children, 31 were females and 24 were males.
Only 4 (7.2%) of these children reported to suffer
from asthma.
In Table 5 we present the distribution of the
classifications by the healthcare professional, along
with the total amount of recordings obtained for each
type of test. In this case, “yes” represents a positive
evaluation of the child’s initial effort. Table 6
characterizes the amount of manoeuvers required by
the healthcare professional to obtain a positive
classification.
Table 5: Total amount of recordings obtained per test, and
the distribution of acceptable BEV quality classification by
the healthcare professional registered quality.
Test Type Total Yes Not Sure No
Hot Air Test 89 65 2 22
Max Force Test 144 108 3 33
Table 6: Number of attempts until a positive classification
by the healthcare professional.
Test type Max Median Min
Hot Air Test 3 1 1
Max Force Test 5 1 1
4.2 Quality Assessment
Tables 7 and 8 show the confusion matrix for the
algorithm using ATS guidelines relative BEV
threshold and the healthcare professional, for the two
tests performed.
Table 7: Confusion matrix for the hot air tests using the
BEV threshold <5% FVC.
Hot Air Test
BEV < 5%
Predicted
Yes No
Target
Yes 27.3% 47.6%
No 7.1% 17.8%
Table 8: Confusion matrix for the maximal effort tests using
the BEV threshold <5% FVC.
Max Force Test
BEV < 5%
Predicted
Yes No
Target
Yes 36.2% 41.3%
No 18.1% 13.0%
Automatic Quality Assessment of Smart Device Microphone Spirometry
119

At a first glance, the high false negative rates
indicate that the algorithm is too strict with respect to
the healthcare professional. Nevertheless, given that
the only information available to the healthcare
professional to produce an evaluation was the visual
observation of the child, and not an objective
measurement obtained by a spirometer as would
happen on a regular spirometry, it is certainly possible
that there was some mislabelling – specifically by
accepting manoeuvres that otherwise would not have
been accepted.
Given the already explained influence of age, sex
and height on the FVC, it is worth noting that the
presented results are based off a sample database that
is heavily biased towards the higher end of the age
spectrum. Given the positive correlation between age
and height to expected FVC values, this means that it
would be reasonable to expect our results to be worse
with a more balanced database, for any static BEV
threshold.
Table 9: Confusion matrix for the hot air tests using the
BEV threshold <12.5% FVC.
Hot Air Test
BEV < 12.5%
Predicted
Yes No
Target
Yes 64.2% 10.7%
No 22.6% 2.4%
Table 10: Confusion matrix for the maximal effort tests
using the BEV threshold <5% FVC.
Max Force Test
BEV < 12.5%
Predicted
Yes
N
o
Target
Yes 68.8% 8.7%
N
o 18.1% 4.3%
As a test, we repeated the analysis for the BEV
threshold suggested by (Aurora et al., 2004), that
coincided with the estimated male BEV threshold for
5-year olds on Table 3, 12.5% (Tables 9 and 10).
While it did improve the true positives and false
negatives, it came at a cost of true negatives, and false
positives in the case of the hot air test. However, it is
important to note that the hot air test is of lesser
importance compared to the maximal effort test, not
only for the scope of this paper, but for Ar.cade’s
scope: the players are expected to have been coached
to perform maximal effort manoeuvres, whereas they
were not in the hot air test. This is due to specific
instructions and coaching for maximal force on
exhale being only given on the maximal effort test,
and not before. In terms of gameplay, a false negative
would mean asking the child to repeat the manoeuvre,
while a false positive would promote poor form.
Taken to the extreme, both of these would lead to the
failure of the “Ar.cade" project, even if due to
different reasons: high difficulty causing frustration
and a loss of interest in the game, or useless gathered
results from a medical standpoint. Therefore, a hybrid
approach might be worth exploring: starting out with
a lower BEV threshold, but raising the threshold after
several failed attempts.
The Tables 11 and 12 show the confusion
matrixes for the age adjusted BEV thresholds. When
compared to the results of the static BEV thresholds,
they are somewhere in between them. The differences
between these are cleared when looking at Tables 13
and 14, which present the F
1 score and accuracy
measurements for the 2 presented static BEV
thresholds along with the age adjusted approach. As
expected, the 5% threshold gives the worst results.
The 12.5% threshold appears to be best, and while
previously mentioned research does point to this
threshold as appropriate for the younger children in
our target group, it is important to note this: F
1 score
and accuracy can provide falsely inflated results in
unbalanced classes, such as the ones presented in our
confusion matrices.
Table 11: Confusion matrix for the hot air tests using the
age adjusted BEV thresholds.
Hot Air Test
Age adjusted BEV
Predicted
Yes No
Target
Yes
50.0% 25.0%
No
15.5% 9.5%
Table 12: Confusion matrix for the maximal force tests
using the age adjusted BEV thresholds.
Max Force Test
Age adjusted BEV
Predicted
Yes No
Target
Yes 55.1% 22.4%
No 14.5% 8.0%
Table 13: F
1
scores, accuracy measurements for different
BEV thresholds in the hot air test.
BEV F
1
score Accuracy
5% 50.0% 45.2%
12.5% 79.4% 66.6%
Age adjusted 71.1% 59.5%
Table 14: F
1
scores, accuracy measurements for different
BEV thresholds in the maximal force test.
BEV F
1
score Accurac
y
5% 58.8% 49.2%
12.5% 83.7% 73.2%
Age adjusted 74.9% 63.0%
Aside from this, according to (Koopman et al.,
SPCS 2018 - International Conference on Signal Processing and Communication Systems
120
2011) the direct correlation between FVC and age is
small compared to FVC’s correlation with height, as
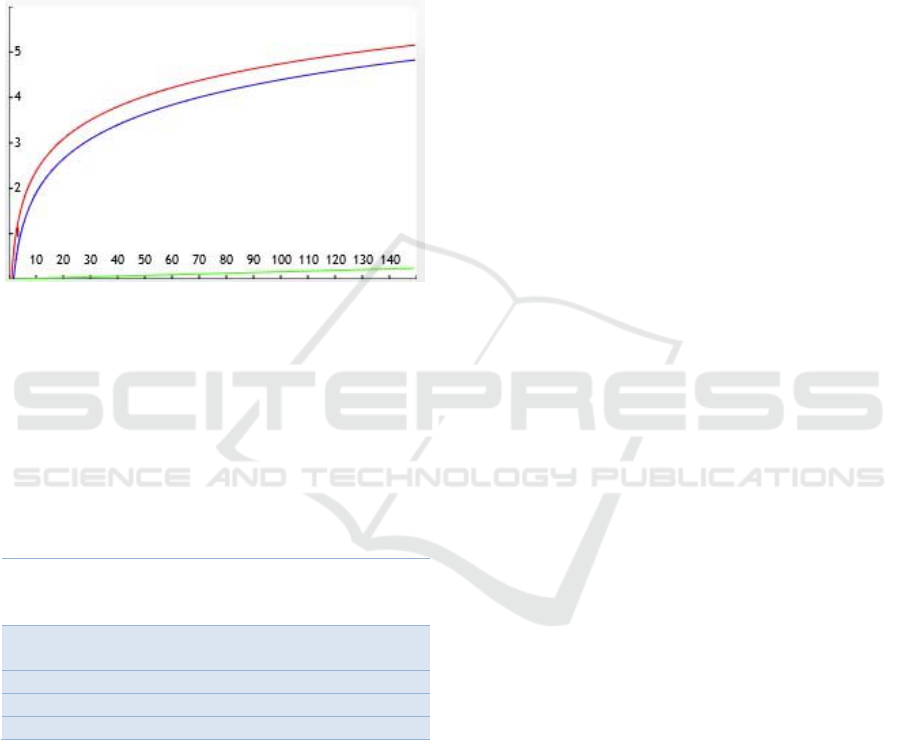
can be seen on Figure 9. Given this notable
discrepancy, and the fact that we assumed the average
height for each age shows another significant
limitation in our work, as the height for a child varies
around 20% from the 3
rd
percentile to the 97
th
, at any
given age in our target group according to WHO
standards.
Figure 9: Plot illustrating the importance of the predictors
for FVC estimation as they vary with age or height. The red
and blue lines represent the impact of children’s height,
measured in cm, for females and males respectively (target
group bounded between 100 and 150cm, using WHO’s
height-to-age standards). The green line represents the
impact of age, measured in months, for both females and
males (target group between 60 and 120 months of age).
Table 15: Number of children capable of performing at least
one maximal force test with acceptable BEV for different
thresholds, in absolute and relative units respectively.
Criterion
Children with at least
one positive
classification
Healthcare
professional
54 (98%)
5% FVC 46 (84%)
12.5% FVC 55 (100%)
A
g
e ad
j
usted 52 (95%)
Despite the limitations described above, it is
important to note. On Table 15, we can see the
number of children that managed at least one positive
detection with the current algorithm, set at different
thresholds, considering the maximal force tests which
are more relevant to us as already explained. Even for
our worst performing criterion, we obtained
reasonably similar results to (Tomalak et al., 2008),
where 80.4% of 117 children between the ages of 4
and 10 years old were able to pass the ATS standard
for BEV acceptability, using clinical spirometers.
This shows that while much work is still needed, for
a first approach on the unexplored field of
microphone spirometry automatic quality assessment
(at least to the best of our knowledge), the results look
promising.
4.3 Limitations and Future Work
Given the source of children for this study, only 7.2%
of them had asthma. It is important to have a larger
representation of these cases to establish how much
can we extrapolate from studies in healthy children,
and what are the specific challenges present in
asthmatic children.
The fact that our ground truth was established by
a single healthcare professional may have introduced
a bias in our database, and to reduce this risk further
data collection events should be performed with
different healthcare professionals, with them cross-
evaluating the same manoeuvre.
As was already mentioned, the database was
heavily biased in terms of age distribution. Therefore,
in further data collection events, there should be an
increased focus on gathering audio samples from
children under 7 years of age. This is especially
important to further test the validity of the age
adjusted BEV approach, to evaluate whether it has
any merit to it.
5 CONCLUSIONS
The automatic evaluation of the FEM through
BEV estimated from microphone spirometry allowed
the assessment of the manoeuvre’s quality, with
respect to the start of exhalation.
Using the alternative less strict BEV thresholds of
12.5% and the Age Adjusted version, the quality was
correctly assessed for over 70% of the manoeuvres.
At least one acceptable manoeuvre was achieved for
96% of the children. Even using the stricter criteria of
5% of FVC it was possible to ensure at least one
acceptable manoeuvre for 69%, which is slightly
lower with the reported spirometry quality ratio in the
literature for this age group
.
While this leads us to conclude that our results are
acceptable, at the same time we recognize the need of
improvements for an automated system like this to
become feasible in a real-world application.
Automatic Quality Assessment of Smart Device Microphone Spirometry
121

ACKNOWLEDGEMENTS
We would like to thank the Externato das Escravas do
Sagrado Coração de Jesus for their hospitality and
cooperation, along with the parents of the 42 children
for allowing them to participate in this study, enabling
us to further the work in microphone spirometry.
The authors of this paper thank Susana Fonseca,
R&D director of MEDIDA, for her continued
support.
C. Jácome and R. Amaral have a post-doctoral
(SFRH/BPD/115169/2016) and a PhD grant
(PD/BD/113659/2015), respectively, funded by
Fundação para a Ciência e a Tecnologia (FCT),
Portugal.
R. Almeida, R. Guedes and J. P. Teixeira are part
of NANOStima - Project NORTE-01-0145-FEDER-
000016 (NanoSTIMA), financed by the
NorthPortugal Regional Operational Programme
(NORTE 2020), under the PORTUGAL 2020
Partnership Agreement, and through the European
Regional Development Fund (ERDF).
REFERENCES
Aurora, P., Stocks, J., Oliver, C., Saunders, C., Castle, R.,
Chaziparasidis, G., Bush, A., 2004. Quality Control for
Spirometry in Preschool Children with and without
Lung Disease. Am. J. Respir. Crit. Care Med. 169,
1152–1159. https://doi.org/10.1164/rccm.200310-
1453OC
C. Larson, E., Goel, M., Boriello, G., Heltshe, S.,
Rosenfeld, M., N. Patel, S., 2012. SpiroSmart: Using a
microphone to measure lung function on a mobile
phone. UbiComp12 - Proc. 2012 ACM Conf.
Ubiquitous Comput. https://doi.org/10.1145/2370216.
2370261
de Onis, M., Onyango, A.W., Borghi, E., Siyam, A.,
Nishida, C., Siekmann, J., 2007. Development of a
WHO growth reference for school-aged children and
adolescents. Bull. World Health Organ. 85, 660–667.
Koopman, M., Zanen, P., Kruitwagen, C.L.J.J., van der Ent,
C.K., Arets, H.G.M., 2011. Reference values for
paediatric pulmonary function testing: The Utrecht
dataset. Respir. Med. 105, 15–23.
https://doi.org/10.1016/j.rmed.2010.07.020
Liu, X., 2013. mCOPD: Mobile Phone Based Lung
Function Diagnosis and Exercise System for COPD.
UCLA.
Luo, A.Z., Whitmire, E., Stout, J.W., Martenson, D., Patel,
S., 2017. Automatic characterization of user errors in
spirometry, in: 2017 39th Annual International
Conference of the IEEE Engineering in Medicine and
Biology Society (EMBC). Presented at the 2017 39th
Annual International Conference of the IEEE
Engineering in Medicine and Biology Society (EMBC),
pp. 4239–4242. https://doi.org/10.1109/EMBC.2017.
8037792
Melia, U., Burgos, F., Vallverdú, M., Velickovski, F.,
Lluch-Ariet, M., Roca, J., Caminal, P., 2014. Algorithm
for Automatic Forced Spirometry Quality Assessment:
Technological Developments. PLOS ONE 9, e116238.
https://doi.org/10.1371/journal.pone.0116238
Miller, M.R., Hankinson, J., Brusasco, V., Burgos, F.,
Casaburi, R., Coates, A., Crapo, R., Enright, P.,
Grinten, C.P.M. van der, Gustafsson, P., Jensen, R.,
Johnson, D.C., MacIntyre, N., McKay, R., Navajas, D.,
Pedersen, O.F., Pellegrino, R., Viegi, G., Wanger, J.,
2005. Standardisation of spirometry. Eur. Respir. J. 26,
319–338.
https://doi.org/10.1183/09031936.05.00034805
Moger, A., Holton, K., Hill, S., Kearney, M., Winter, R.,
2013. Quality Assured Diagnostic Spirometry(QADS)
- Performance And Competence, in: B45. CHRONIC
OBSTRUCTIVE PULMONARY DISEASE:
DIAGNOSIS AND EVALUATION, American
Thoracic Society International Conference Abstracts.
American Thoracic Society, pp. A2836–A2836.
https://doi.org/10.1164/ajrccm-
conference.2013.187.1_MeetingAbstracts.A2836
Pierce, R., 2005. Spirometry: an essential clinical
measurement. Aust. Fam. Physician 34, 535–539.
Stein, B. van, 2013. A Mobile Smart Care platform Home
spirometry by using the smartphone microphone.
Teixeira, J.F., Teixeira, L.F., Fonseca, J., Jacinto, T., 2015.
Automatic Analysis of Lung Function Based on
Smartphone Recordings, in: Biomedical Engineering
Systems and Technologies, Communications in
Computer and Information Science. Presented at the
International Joint Conference on Biomedical
Engineering Systems and Technologies, Springer,
Cham, pp. 390–402. https://doi.org/10.1007/978-3-
319-27707-3_24
Tomalak, W., Radliński, J., Latawiec, W., 2008. Quality of
spirometric measurements in children younger than 10
years of age in the light of the recommendations.
Pneumonol. Alergol. Pol. 76, 421–425.
Walters, J.A., Walters, E.H., Nelson, M., Robinson, A.,
Scott, J., Turner, P., Wood-Baker, R., 2011. Factors
associated with misdiagnosis of COPD in primary care.
Prim. Care Respir. J. J. Gen. Pract. Airw. Group 20,
396–402. https://doi.org/10.4104/pcrj.2011.00039
WHO | Height-for-age (5-19 years) [WWW Document],
n.d.. WHO. URL http://www.who.int/growthref/
who2007_height_for_age/en/ (accessed 4.3.18).
Zubaydi, F.K., 2016. A mobile Based Platform for
Monitoring Respiratory Diseases (Thesis).
SPCS 2018 - International Conference on Signal Processing and Communication Systems
122
