
First Experiments on Speaker Identification Combining a New
Shift-invariant Phase-related Feature (NRD),
MFCCs and F0 Information
An
´
ıbal Ferreira
Department of Electrical and Computers Engineering, University of Porto - Faculty of Engineering, Porto, Portugal
Keywords:
Phase-related Voice Feature, Speaker Identification.
Abstract:
In this paper we report on a number of speaker identification experiments that assume a phonetic-oriented seg-
mentation scheme exists such as to motivate the extraction of psychoacoustically-motivated phase and pitch
related features. MFCC features are also considered for benchmarking. An emphasis is given to an innovative
shift-invariant phase-related feature that is closely linked to the glottal source. A very simple statistical mod-
eling is proposed and adapted in order to highlight the relative discrimination capabilities of different feature
types. Results are presented for individual features and a discussion is also developed regarding possibilities
of fusing features at the speaker modeling stage, or fusing distances at the speaker identification stage.
1 INTRODUCTION
Automatic speaker identification involves using real-
time or recorded samples of the voice of different
speakers, building speakers models, and finding dis-
tances between those speakers models. In closed-set
speaker identification, speaker models for all speak-
ers are available. In this case, a successful iden-
tification is simply determined by finding the min-
imum distance between the model of a test speaker
and the different speaker models of all speakers that
are built during the training (or enrolment) phase.
In open-set speaker identification, not all speakers
are known and therefore a special ‘general’ (or av-
erage) speaker model is needed that is frequently
referred to as Universal Background Model (UBM)
(Raynolds, 1997). In this case, the distance between
a test speaker model and the general speaker model
is also computed, in addition to the distances found
between the test speaker model and the models of all
known speakers. Successful identification is achieved
if the distance between the test speaker model and
that of a known speaker is safely shorter (i.e. smaller)
than the distance to the general speaker model (this is
usually evaluated using Likelihood Ratios -LR (Ra-
machandran et al., 2002, page 2808)). If this happens
not to be the case, speaker identification is inconclu-
sive. Automatic speaker identification may also be
characterized and influenced by other important con-
textual and application factors such as matched or
mismatched conditions in the communication channel
and signal acquisition equipment during training and
testing, or such as text-dependent or text-independent
assumptions during training and testing. For a com-
prehensive treatment on the subject of speaker identi-
fication, the reader is referred to (Hansen and Hasan,
2015).
In this paper, we assume closed-set speaker
identification as well as channel-matched and text-
independent training and testing. Deliberately, these
are simplifying assumptions allowing us to minimize
variability factors affecting the voice signal and that
are external to the speaker, and to focus instead ex-
clusively on the diversity of voiced sounds, i.e. those
sounds (e.g. voiced vowels and voiced consonants)
that involve phonation as a result of the vibration of
vocal folds. In this case, the vocal source excitation
has a pattern which is periodic in the time domain, and
has a harmonic structure in the spectral domain which
is also manifested in the voice signal that is captured
by means of a microphone (Sundberg, 1987). In turn,
the harmonic structure has an underlying phase struc-
ture relating all harmonics and whose speaker dis-
criminative potential is the main aspect studied in this
paper.
Differently from automatic speech recognition,
automatic speaker identification focuses on acoustic
aspects of the voice signal that reflect either idiosyn-
cratic traits due to the vocal source signal, i.e. the
glottal excitation, or idiosyncratic traits due to the in-
Ferreira, A.
First Experiments on Speaker Identification Combining a New Shift-invariant Phase-related Feature (NRD), MFCCs and F0 Information.
DOI: 10.5220/0006868103470358
In Proceedings of the 15th International Joint Conference on e-Business and Telecommunications (ICETE 2018) - Volume 1: DCNET, ICE-B, OPTICS, SIGMAP and WINSYS, pages 347-358
ISBN: 978-989-758-319-3
Copyright © 2018 by SCITEPRESS – Science and Technology Publications, Lda. All rights reserved
347

fluence of supra-laryngeal structures, notably the vo-
cal tract and nasal tract resonances. Dynamic aspects
of voice expression are also idiosyncratic and include
articulation gestures related for example to formants
trajectories (i.e. trajectories of the vocal and nasal
tract resonant frequencies and that can be easily iden-
tified, for example, in spectrograms of diphthong re-
gions of the speech signal) and consonant-to-vowel
(and vowel-to-consonant) co-articulation gestures.
Concerning the signal analysis and feature ex-
traction front-end, the dominant approach in current
speaker identification technology involves capturing
speaker-specific voice and articulation traits by means
of signal features that are extracted from the speech
signal. Feature extraction is usually performed using
i) a simple signal segmentation strategy that simply
tries to exclude silence and non-speech sounds, and
ii) using exclusively the magnitude of a spectral rep-
resentation of short signal segments -in the order of
20 ms-, for example through such features as Mel-
Frequency Cepstral Coefficients (MFCCs) (Davis and
Mermelstein, 1980) or parameters extracted from Lin-
ear Predictive Coding (LPC) analysis (Rabiner and
Juang, 1993).
This approach reflects however two assumptions
we believe are not entirely correct. The first assump-
tion is that the same idiosyncratic voice traits per-
sist in all phonetic realizations by the same speaker,
irrespective of their nature being voiced vowels or
unvoiced consonants, for example. In a previous
study, we have shown that using phonetic-oriented
signal segmentation and conventional MFCC and
GMM speaker modeling, speaker identification per-
formance improves significantly relatively to the case
where just uniform, blind, signal segmentation is used
(Mendes and Ferreira, 2012). We therefore argue that
speaker-specific vocal traits are highly localized in
time according to the specificity of the categorical
phonetic realization. It can be argued however that
GMM accommodates this because in a GMM ‘A uni-
modal Gaussian density can be thought of as mod-
eling an acoustic class representing a phonetic event
(like vowel, nasals and fricatives)’ (Ramachandran
et al., 2002, page 2808). Although this is plausible,
to a significant extent we think this can also be a mat-
ter of belief since MFCCs have an intrinsic low res-
olution at high frequencies and are therefore not tai-
lored to capture the subtleties that make for example a
sibilant a special case of a fricative. Although strate-
gies for phonetic-oriented signal segmentation are not
the focus of this paper, we presume one such strat-
egy exists that leads to the segmentation of vowel-like
sounds only, which are those for which it makes sense
to extract features that are related to the phases of the
signal harmonics.
The second incorrect assumption is that phase is
irrelevant in the voice signal analysis and feature ex-
traction process and, thus, has no useful potential in
speaker discrimination. Fortunately, this aspect has
been extensively tackled in the literature and many
authors have addressed the speaker discriminative po-
tential of phase-related features, with positive results,
e.g. (Alam et al., 2015; Wang et al., 2010; Wang
et al., 2009; Nakagawa et al., 2007; Rajan et al.,
2013; Padmanabhan et al., 2009). Taking as a ref-
erence the speaker identification performance that is
achieved using MFCC-related features alone, which
have proven so far to be the most effective acous-
tic features and, therefore, constitute a benchmark-
ing standard easily offering above around 70% correct
identification, it has been concluded that, in general,
phase related features help to improve the MFCC-
based scores between 0.0% and less than 10.0%, e.g.
(Wang et al., 2010).
The novelty of our paper lies in the nature of
the phase-related features. In fact, our approach is
based on a phase-related feature involving the ac-
curate phase relationships between the relevant har-
monic components in a quasi-periodic signal. We
named this feature as Normalized Relative Delay
(NRD). In short, NRD coefficients are equivalent to
the parametric phase of the harmonics when a Fourier
analysis is performed for any periodic signal. To-
gether with the accurate magnitudes of those harmon-
ics, they fully characterize the shape invariance of any
periodic waveform. Section 3.1 provides additional
information on the NRD feature.
This paper is a follow-up to a previous paper (Fer-
reira, 2014) in which we concluded NRD coefficients
(NRDs) possess the potential to discriminate between
speakers because NRDs exhibit essentially the same
profile even for different vowels uttered by the same
speaker, i.e. they reflect the idiosyncratic nature of
the glottal pulse of a specific speaker rather than the
contribution of the vocal/nasal tract filter which obvi-
ously changes for different vowels because it is their
spectral envelope that conveys the linguistic meaning.
This is a conclusion which we believe also brings in-
novative insights as we discuss in (Ferreira and Tri-
bolet, 2018). In this paper, however, we take as a ref-
erence other results in the literature that also address
phase-related features.
For example, (Nakagawa et al., 2007; Wang et al.,
2009; Wang et al., 2010) use the phase of the first 12
coefficients of a DFT analysis which is made relative
to the phase of the 1 kHz reference DFT bin. This
relative phase is projected into the coordinates of a
unit circle and the result is subject to Gaussian Mix-
SIGMAP 2018 - International Conference on Signal Processing and Multimedia Applications
348

ture Modeling (GMM). The speaker identification de-
cision is obtained at the score level by combining the
likelihoods due on one hand to the GMM modeling
of MFCCs, and due on the other hand to the GMM
modeling of the projected phase.
The modified group delay (MODGD) is used in
(Padmanabhan et al., 2009) to indirectly model phase
and the result is further converted into cepstral fea-
tures (MODGDF). Both MFCCs and MODGDF are
modelled using GMMs. Interestingly, the authors
mention that MODGDF and MFCCs are significantly
related which suggested they are not independent.
Features are not combined neither are feature scores.
Speaker identification performance is graphically il-
lustrated by means of the Equal Error Rate (ERR)
for the NIST 2003 database and, interestingly, MOD-
GDFs appear to offer around EER=17% which sur-
passes the EER achieved by MFCCs.
In (Alam et al., 2015) MODGD features are also
used although in an indirect way: they are extracted
from the LPC model that fits the signal under analysis
and then they are converted into (18) cepstral coef-
ficients. Speaker modeling uses a GMM-UBM ap-
proach and results on the NIST 2010 database indi-
cate that the EER performance varies between 10%
and 23% for LPC-based MODGD features, while for
MFCC features the EER performance varies between
abou 7% and 35%.
In (Rajan et al., 2013) the authors also follow a
similar approach but also consider other feature sets
including MODGD and LPC-based MODGD features
and study several score fusion variations. GMM-
UBM modeling is also used and EER performance
results indicate that MODGD may achieve a perfor-
mance similar to that of MFCCs (including ∆ and
∆∆), and that their combination may reach sub 1%.
It is interesting to note that all of these studies
avoid phonetic signal segmentation or dedicated har-
monic analysis. Also, all studies mention that diago-
nal covariance matrices are used.
The remaining of the paper is organised as fol-
lows. In Sec. 2 we describe the database and charac-
terize its specificities and, in Sec. 3, we describe the
four types of features under focus in this paper. The
simple performance criteria used in this paper are ad-
dressed in Sec. 4. In Sec. 5 we present and discuss
results characterizing the performance of individual
features. Section 6 describes our attempts to com-
bine different feature types in the same feature vector
that is used for speaker modeling, and Sec. 7 presents
and discusses our results combining distances aris-
ing from separate speaker models based on individual
features. Finally, Sec. 8 concludes this paper.
2 THE SPEAKERS DATABASE
In total, our database includes in total the
speech/voice recordings of 37 speakers, 20 fe-
male and 17 male. The particularities of this database
have been described in (Fernandes and Ferreira,
2017; Ferreira and Fernandes, 2017). For example,
it includes 5 pairs of twin brothers or sisters, and 9
triplets of twins and a relative of the same gender and
about the same age. In addition, it includes two in-
dependent conversations, one conducted over a GSM
channel, and another one conducted over a VoIP
channel. Both telephonic-quality and full-quality
versions of the same conversation are available as
contemporaneous recordings made at the subject end,
and at the interviewer end. In both conversations, in
addition to a simulated dialogue lasting more than
2 minutes, the subjects were also asked to utter a
sequence of five sustained vowels each one lasting
about 1 second. In this paper, we are using only the
high-quality versions of the vowel recordings which
were manually segmented and labelled. Thus, in this
paper, for each speaker, we use the five sustained
vowels of one conversation to build a speaker model,
and we use the vowels of the other conversation to
test the speaker model. This way all data is mutually
exclusive. In this paper, the sampling frequency of all
recordings is 22050 kHz, and the sample resolution
is 16 bit.
3 NRD, MFCC & F0 FEATURES
In this section, we address the three types of features
under study in this paper, and place an emphasis on
the time-shift invariant phase-related NRD feature.
3.1 The NRD Feature
We have introduced the NRD concept in (Sousa and
Ferreira, 2010), and have been using it in singing
voice analysis (Sousa and Ferreira, 2011), glottal
source modeling (Dias et al., 2011; Dias and Ferreira,
2013; Dias and Ferreira, 2014), speaker identification
(Mendes and Ferreira, 2012; Ferreira, 2014), para-
metric audio coding (Ferreira and Sinha, 2016) and
dyspohonic voice reconstruction (Ferreira, 2016).
Smooth phase descriptors for harmonic signals
that are similar to NRD were also proposed by
Stylianou in 1996 (phase envelope (Stylianou, 1996,
page 44)) and Saratxaga in 2009 (Relative Phase Shift
-RPS (Saratxaga et al., 2009)).
The Normalized Relative Delay (NRD) feature
results from the accurate estimation of the absolute
First Experiments on Speaker Identification Combining a New Shift-invariant Phase-related Feature (NRD), MFCCs and F0 Information
349
phase of each harmonic pertaining to a periodic wave-
form, which is further converted to a relative phase
taking as a reference that of the fundamental fre-
quency. This makes that the NRD is time-shift invari-
ant and, by definition, the NRD of the fundamental
frequency is always zero. The result is further normal-
ized taking into consideration the accurate period (in
samples) of each harmonic. Thus, for each harmonic,
the NRD is a real number between −1 and +1. Be-
cause it is a number which represents a faction of the
half-period of that harmonic, it expresses how much
that harmonic is ‘delayed’ to build the time shape of
the periodic waveform it belongs to. In short, the
NRD is a phase-related feature that is relative to the
phase of the fundamental frequency and that is further
normalized by the accurate period of the harmonic it
is associated with. Hence, the NRD is intrinsically
time-shift invariant, and is independent of the period
and overall amplitude of the periodic waveform. Il-
lustrative examples are provided in (Sousa and Fer-
reira, 2010; Ferreira, 2014). Still, NRDs preserve the
properties of phase which means phase wrapping and
phase unwrapping also applies.
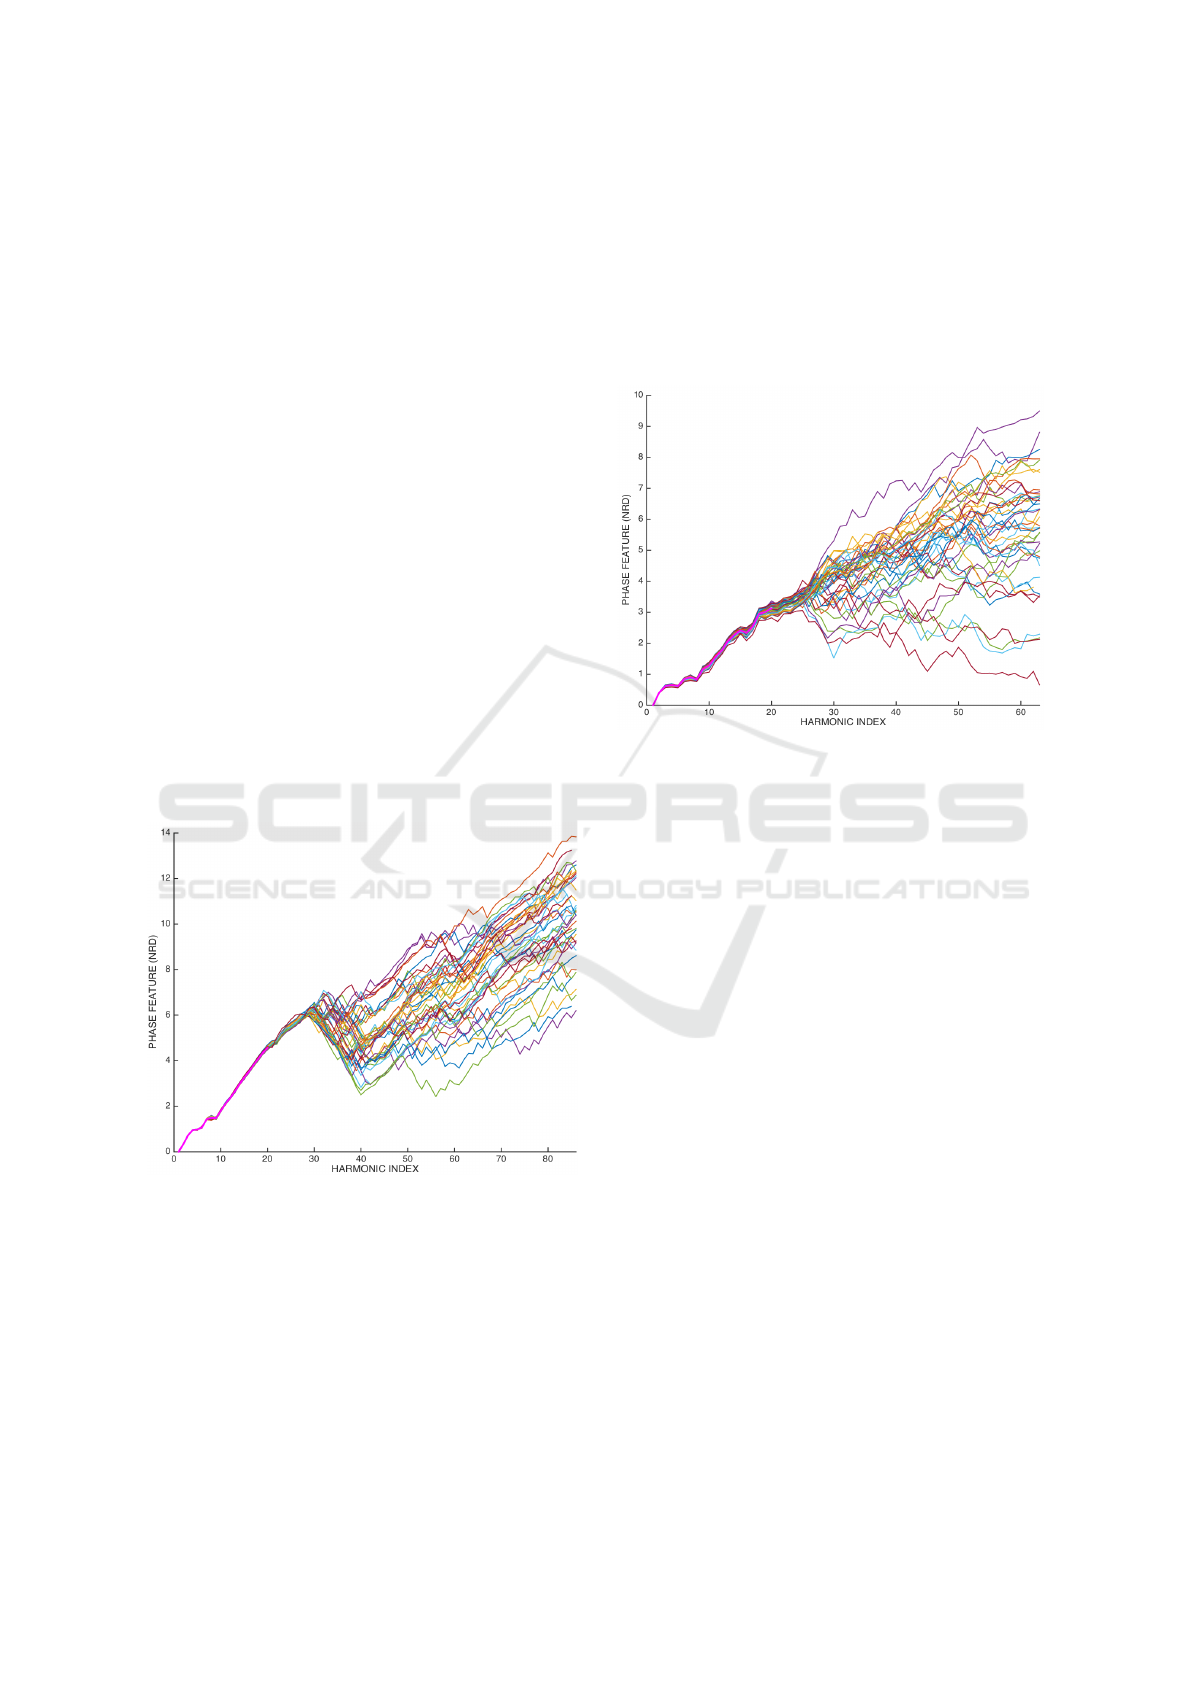
Figures 1 and 2 represent the unwrapped NRD
feature vectors that were extracted from a sustained
vowel (about 1 second long) uttered by a male and a
female speaker, respectively. These figures are quite
Figure 1: Unwrapped NRDs extracted for a sustained vowel
uttered by a male speaker. The thick magenta line represents
the average NRD model up to harmonic 19.
representative of many other examples that can be ex-
tracted for different vowels and speakers and essen-
tially lead to the conclusion that a stable and consis-
tent trend is perfectly identifiable for harmonics or-
ders up to 20, as we have already anticipated and il-
lustrated in (Ferreira, 2014). The fact that inconsis-
tencies arise in the unwrapped NRDs for very high
harmonic orders is mainly due to two reasons: i) the
magnitude of those harmonics is extremely low which
means they are significantly affected by noise which
makes the accurate phase estimation process more
difficult, and ii) the accurate period of each harmonic,
which is computed individually accounting for some
degree of inharmonicity, is extremely short, e.g. less
than three samples, which makes the NRD estimation
even more difficult. This, however, is not problematic
Figure 2: Unwrapped NRDs extracted for a sustained vowel
uttered by a female speaker. The thick magenta line repre-
sents the average NRD model up to harmonic 19.
because the most important NRD trend is defined by
the lower order and stronger harmonics. The lower 20
harmonics represent a spectral region easily encom-
passing the first three and even four formant frequen-
cies. If higher order NRDs are needed, as in paramet-
ric voice or audio synthesis, for example, (Ferreira,
2016; Ferreira and Sinha, 2016), they can be simply
extrapolated from the lower order harmonics.
In (Ferreira and Tribolet, 2018) we describe NRDs
in more detail and we highlight that NRD reflect es-
sentially phase attributes due to the vibration of the
vocal folds.
3.2 MFCC Features
As we mentioned in section 1, MFCC features are
standard benchmarking features that are very impor-
tant to assess the relative performance of new fea-
tures. We use the melcepst() function that is avail-
able in the popular and freely available Voicebox tool-
box. The melcepst() function is very convenient
because we can configure the analysis parameters so
that they are comparable to the analysis parameters
involved in NRD computation. In both cases, we
use 22050 Hz sampling frequency and the maximum
number of both MFCC and NRD coefficients is 19. It
should be noted that because our training and testing
SIGMAP 2018 - International Conference on Signal Processing and Multimedia Applications
350

conditions are quite simplistic (vowel sounds only, to-
tal duration about 5 sec. both for training and testing),
we are not using ∆ or ∆∆ MFCC coefficients.
3.3 F0-related Features
Fundamental frequency estimation can be imple-
mented using any accurate and robust algorithm, e.g.
(de Cheveign
´
e and Kawahara, 2002). In this paper,
we use an algorithm we have developed for accurate
singing analysis (Ventura et al., 2012) and general au-
dio and harmonic-based sounds (Ferreira and Sousa,
2010; Ferreira and Sinha, 2016). Using this algo-
rithm, the average fundamental frequency is found for
each speaker and vowel signal (F0) as well as its stan-
dard deviation, which we represent as F0std.
4 PERFORMANCE CRITERIA
In this paper, we are not aiming at state-of-the-art
performance. We are instead motivated by a prag-
matic approach that was suggested by Hansen and
Hasan: ‘Ideally, if features could be designed in
such a way that no intra-speaker variation is present
while inter-speaker discrimination is maximum, the
simplest methods of modeling might have sufficed’
(Hansen and Hasan, 2015, page 85) and ‘if acoustic
features are improved, simple modeling techniques
will be sufficient’ (Hansen and Hasan, 2015, page
86). Thus, we follow a simple approach, also adopted
by several authors, e.g. (Segundo et al., 2017; Fer-
reira, 2007), of statistical modeling using mean (µ)
and variance (σ) vectors and covariance matrices (C).
Distances are found using the Euclidian-based Maha-
lanobis metric
d
2
= (x − µ)
T
C
−1
(x − µ). (1)
Since our training and test conditions are symmet-
ric, we use a more general definition that expresses
symmetric distance. Assuming we want to find the
distance between speaker k using data pertaining to
his/her conversation A (please note that as indicated
in Section 2, two similar but different recordings exist
for the same speaker, for simplicity we denote his/her
conversations as A and B), and speaker ` using data
pertaining to his/her conversation B, distances are ac-
tually computed using
d
2
k,`
= (x
k,A
− µ
`,B
)
T
C
−1
`,B
(x
k,A
− µ
`,B
) +
(x
`,B
− µ
k,A
)
T
C
−1
k,A
(x
`,B
− µ
k,A
) . (2)
It should be noted that, in general, d
2
k,`
6= d
2
`,k
. In
most cases in the literature, the covariance matrices
are forced to be diagonal. This makes that correla-
tions between different coefficients in the feature vec-
tor are ignored and, therefore, distances are normal-
ized Euclidian. This has significant computational ad-
vantages as the inverse of a diagonal covariance ma-
trix is easy to compute, and all values contributing to
d
2
k,`
in (2) are positive. In Section 7 we will redefine
(2) such that full covariance matrices are not singular
and all values involved in the computation of d
2
k,`
are
positive.
A matrix of size 37×37 and including the dis-
tances for all pairs of speakers, is used to produce a
match matrix by looking at distances along the rows
and along the columns and by setting the identifica-
tion according to the minimum distance found. Ide-
ally, this matrix should be diagonal and contain the
value 2 along the diagonal. The percent correct iden-
tification is found by summing all values along the
main diagonal and dividing the result by the sum of
all values in the match matrix.
The matrix containing all distances can also be
converted into a ‘score’ matrix by just making all dis-
tances negative. It becomes then possible to compute
other performance metrics such as the Equal Error
Rate (EER). This performance criterion will be used
in Sec. 5.1 and Sec. 7.
5 PERFORMANCE OF
INDIVIDUAL FEATURES
In this section, we present the performance results for
each individual feature type (NRD, MFCC, F0 and
F0std). Before we address each feature type individ-
ually, a few preliminary considerations are in order
concerning the reliability of the phase information ac-
cording to the specific vowel.
Overlapping the average NRD feature vectors for
different vowels uttered by the same speaker, we were
expecting to observe a clear consistent trend as the
preliminary results in (Ferreira, 2014) suggested. In
most cases we indeed observed that trend as the ex-
amples illustrated in Figs. 3 and 4 confirm.
However, in a number of cases, we also observed
a significant deviation of the mean NRD feature vec-
tor for vowels /i/ and /u/, from the trend defined by
the mean feature vectors found for vowels /a/, /e/ and
/o/. Figures 5 and 6 provide an illustration of this out-
come.
An analysis of this outcome led to the conclusion
that, as already noted earlier in this paper (Section
3.1) and as further discussed in (Ferreira and Tribo-
let, 2018), the relative magnitude of the different har-
monics plays an important role. In fact, of the five
First Experiments on Speaker Identification Combining a New Shift-invariant Phase-related Feature (NRD), MFCCs and F0 Information
351
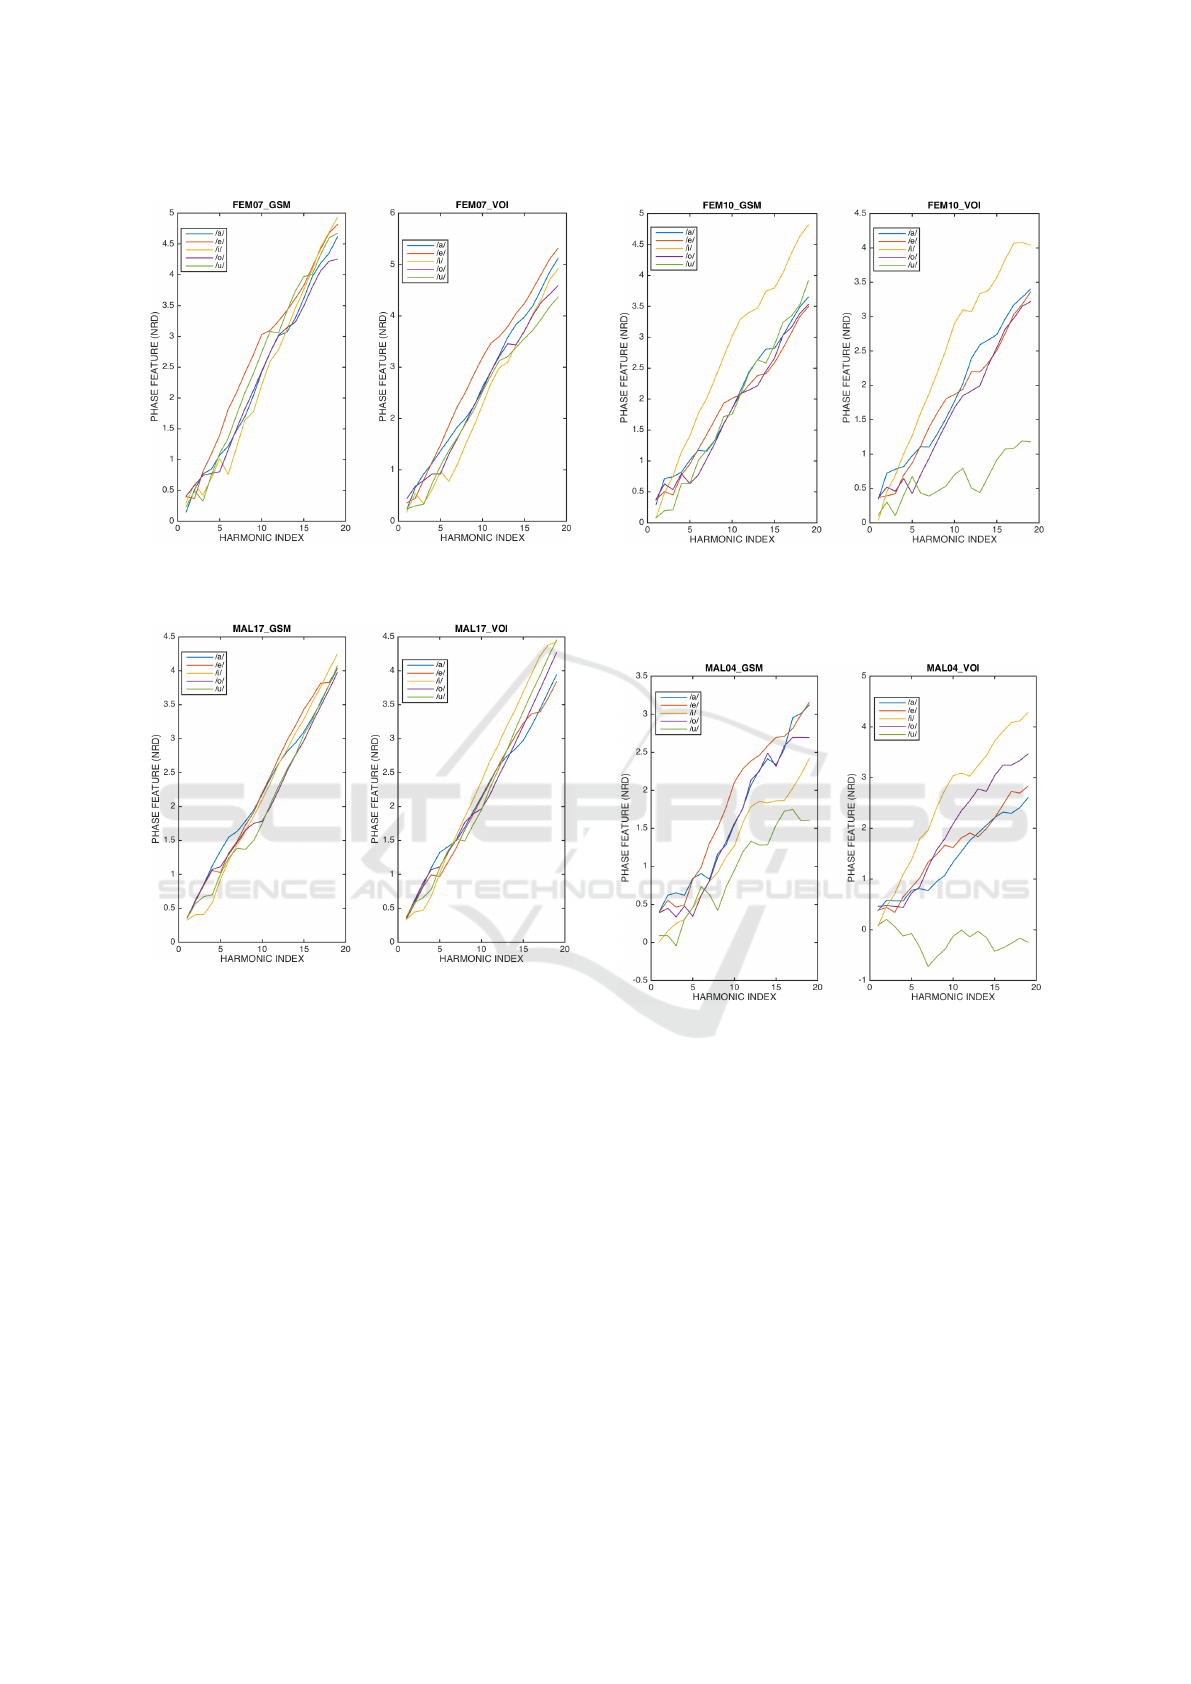
Figure 3: Overlap of the average NRD feature vector found
for different vowels by a female speaker.
Figure 4: Overlap of the average NRD feature vector found
for different vowels by a male speaker.
tonic vowels considered in this paper, vowel /u/ is
the one whose spectral decay is the steepest from low
frequencies. This means that harmonics whose order
is higher than one have a very small magnitude and,
as a consequence, phase estimation is adversely af-
fected. On the other hand, vowel /i/ is the one with
the widest separation between the two important res-
onant frequencies (in the literature this is also referred
to as F1 and F2 formant frequencies separation). This
also creates a long spectral valley in which harmon-
ics have a reduced magnitude which also adversely
affects phase estimation.
This outcome suggested, however, that speaker
identification performances may depend on either us-
ing data from just three vowels (/a/, /e/ and /o/), or
from all five vowels, in order to build speaker models.
This will be addressed in the following subsections.
Figure 5: Overlap of the average NRD feature vector found
for different vowels by a female speaker. It can be seen that
the NRDs associated with vowels /i/ and /u/ deviate from
the trend defined by the remaining vowels.
Figure 6: Overlap of the average NRD feature vector found
for different vowels by a male speaker. It can be seen that
the NRDs associated with vowels /i/ and /u/ deviate from
the trend defined by the remaining vowels.
5.1 Performance of NRD Features
It has been illustrated in Sec. 3.1 that, in most cases,
NRD coefficients are reliable and stable up to har-
monic order 20 and even beyond, especially in the
case of male voices, whose spectrum is known to be
less sparse than in the case of female voices. It is thus
an interesting matter to assess what the percent cor-
rect identification is when NRD coefficients are used
alone, and how that depends on the size of the NRD
feature vector. We studied these alternatives using the
distance metric given by Eq. 2, the performance crite-
rion defined in Sec. 4, and using diagonal covariance
matrices.
SIGMAP 2018 - International Conference on Signal Processing and Multimedia Applications
352
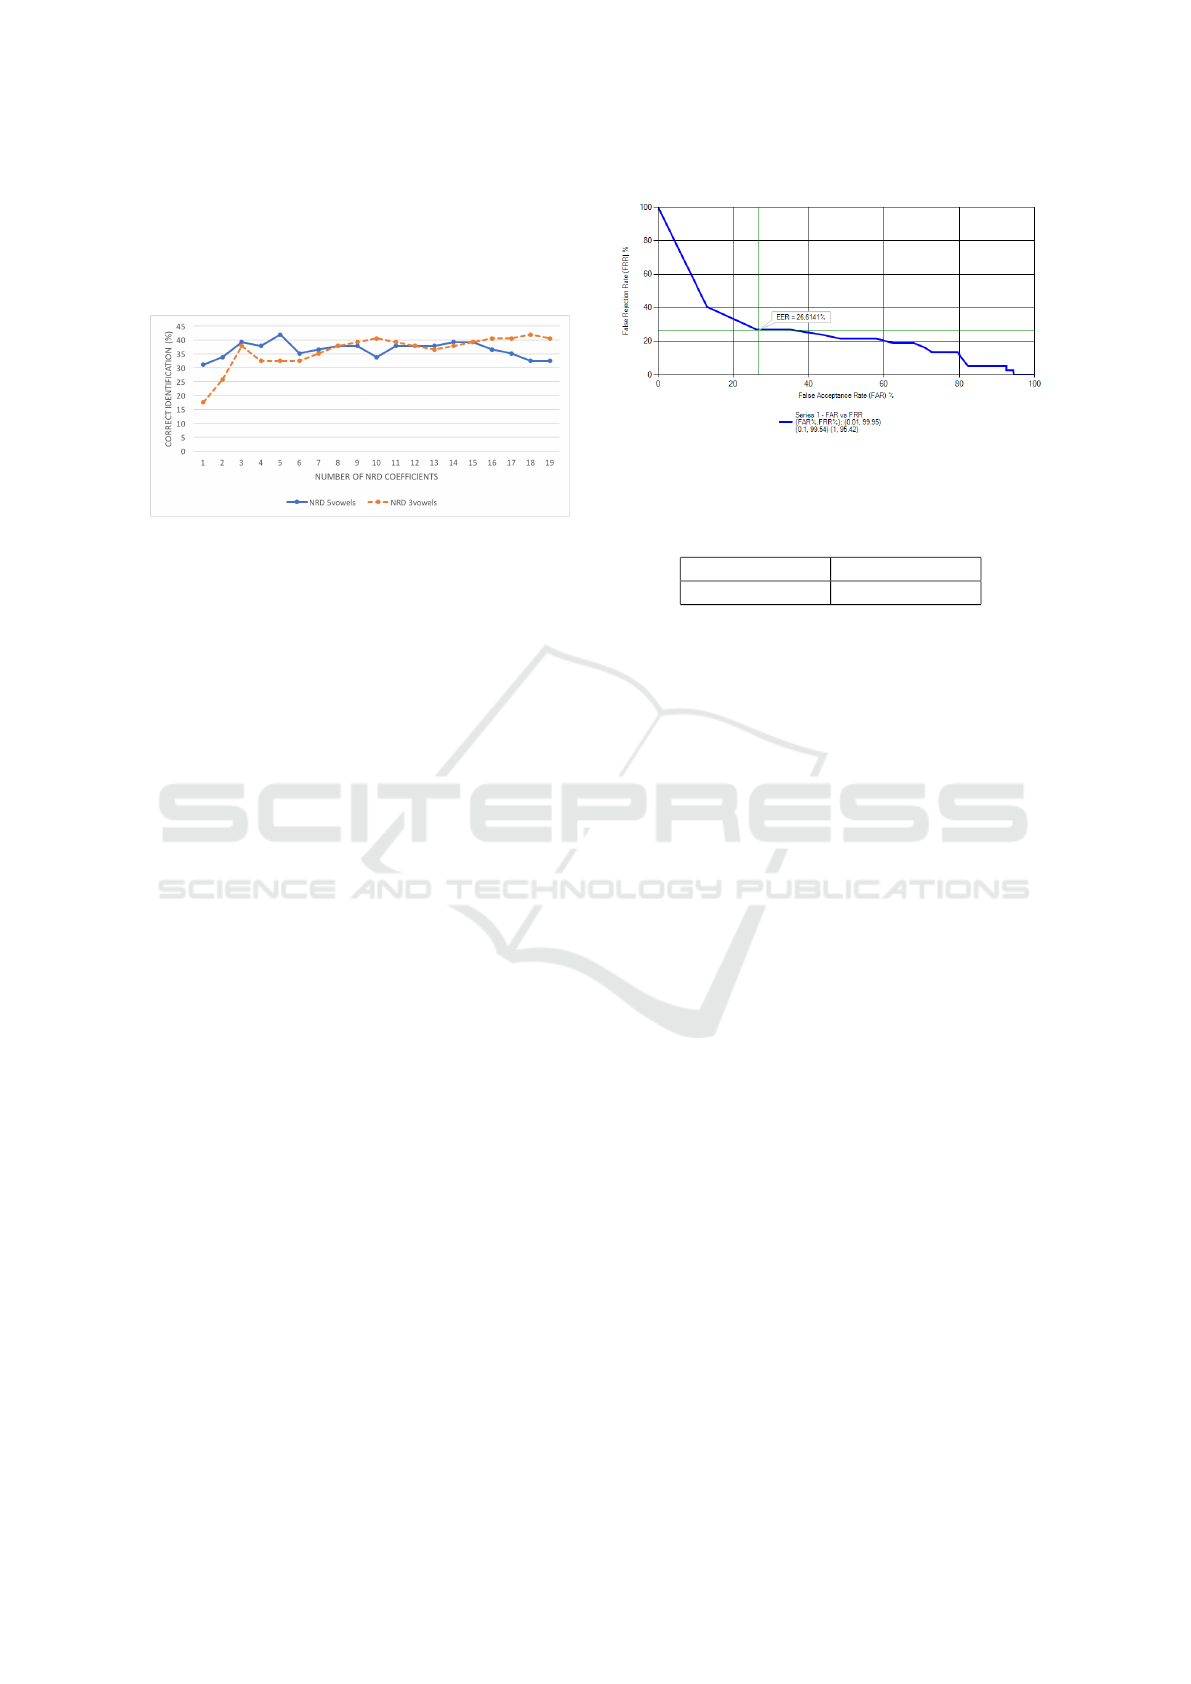
Figure 7 represents the percent correct speaker
identification when the size of the NRD feature vec-
tor varies between 1 and 19, and when three vow-
els (/a/, /e/ and /o/) are used for speaker modeling,
or when all five vowels are used. It can be con-
Figure 7: Percent correct speaker identification when NRD
features are used for speaker modeling. Results are pre-
sented when the NRD feature vector size varies between 1
and 19, and when speaker modeling uses data from either 3
vowels or 5 vowels.
cluded that speaker modeling using data from just
three vowels is especially beneficial when the NRD
feature vector size exceeds 14. This is to be expected
as the higher the harmonic number, the less reliable
the phase estimation process is, especially for vow-
els /u/ and /i/, as noted before. The lesson learned at
this point is that, quite conveniently, a vowel-oriented
phonetic segmentation scheme is not strictly required
for phase-based speaker modeling.
Secondly, it can be observed in Fig. 7 that the
percent correct speaker identification using NRD fea-
tures only varies between 32% and around 42%. Al-
though this performance level is not impressive, it
is significant and suggests that NRDs may positively
contribute to the speaker identification performance
when different features are combined.
The simplistic statistical modeling that is adopted
in this paper, and whose motivation is to focus on the
intrinsic discriminative capabilities of different fea-
tures, as it was explained in Sec. 4, does not make it
easy to compare our results against other results in the
literature. Even so, for example Rajan et al. (Rajan
et al., 2013) indicate that the EER is 32.9% when us-
ing standard (18-dimensional) group-delay features,
a 128-mixture GMM-UBM, the NIST SRE 2010 data
and normal vocal effort conditions. In order to ob-
tain EER-like scores from our data, as we indicated
in Sec. 4, we converted the distance values into neg-
ative values and took the resulting score matrix to the
Biometrics software for analysis. The result for the 3-
vowel speaker modeling condition is represented in
Fig. 8. Results for 3-vowel and 5-vowel speaker
modeling are presented in Table 1. In another re-
sult, Wang et al. (Wang et al., 2010) report that us-
ing 128-mixture GMM speaker modeling (and diag-
Figure 8: Equal Error Rate (EER) when 19-dimensional
NRD feature vectors are used and speaker modeling is
based on 3 vowels.
Table 1: EER for 19-dimensional NRD feature vectors.
EER (3 vowels) EER (5 vowels)
26.61% 31.72%
onal covariance matrices), a database containing 35
speakers, and a 12-dimensional phase-related feature
vector, the achieved correct identification varies be-
tween 63.4% and 73.4%. These results are better than
those we obtained which is probably due to the so-
phisticated statistical modeling that is used in (Wang
et al., 2010), relatively to ours.
Lastly, we emphasize that our results have been
obtained using diagonal covariance matrices. We
tested full covariance matrices but these were found to
be singular which confirms that a linear dependency
exists among different NRD coefficients.
5.2 Performance of MFCC Features
In this section, we report on the speaker identification
results using MFCC coefficients alone. We were mo-
tivated by the same concern in Sec. 5.1 in evaluating
how results vary as a function of the feature vector
size and according to the two possibilities of 3 or 5
vowel speaker modeling.
As in Sec. 5.1, we also consider here the distance
metric given by Eq. 2, the performance criterion de-
fined in Sec. 4, and diagonal covariance matrices.
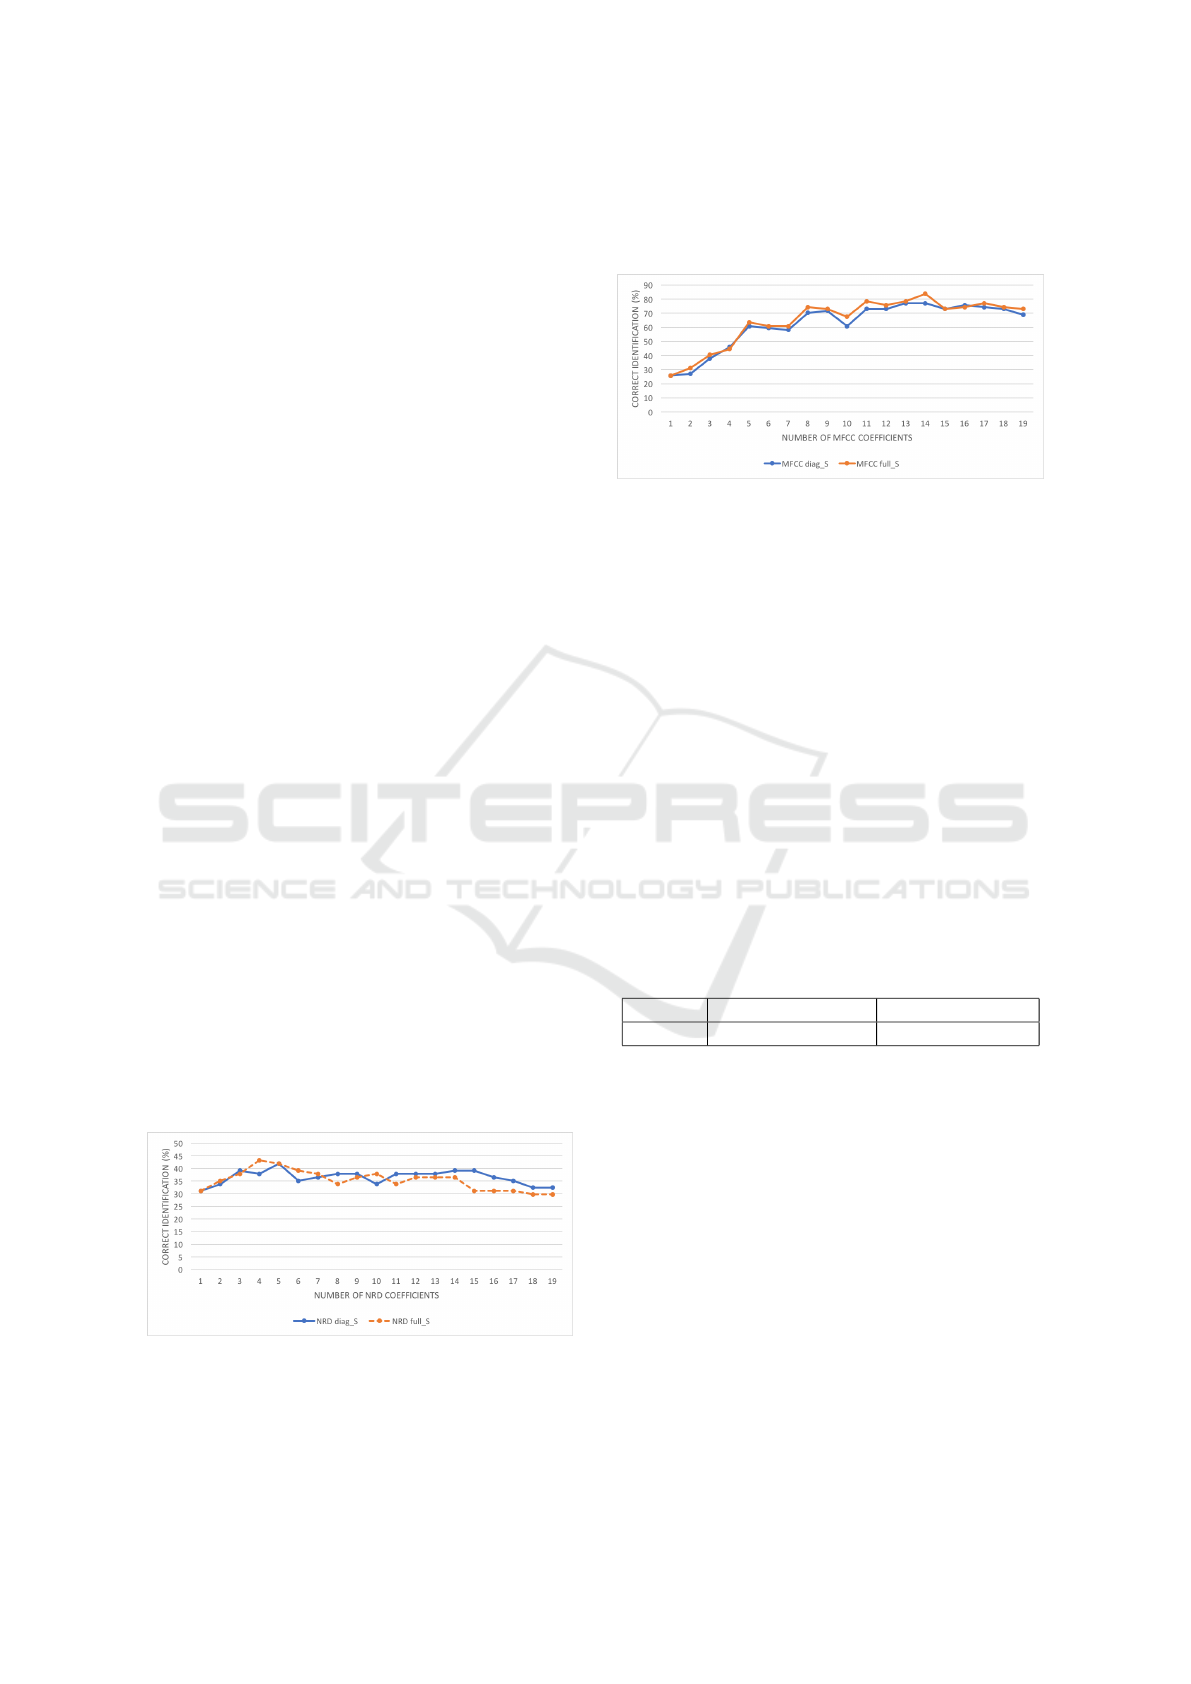
Figure 9 represents the percent correct speaker
identification when the size of the MFCC feature vec-
tor varies between 1 and 19, and when three vowels
(/a/, /e/ and /o/) are used for speaker modeling, or
when all five vowels are used. A first important out-
come is that results for 5-vowel speaker modeling are
almost always better than those that are obtained for
3-vowel speaker modeling. This is particularly no-
torious for MFCC feature sizes larger than 10. This
is somewhat expected and just confirms that a richer
diversity in the data is beneficial. Secondly, the high-
est speaker identification performance is obtained for
First Experiments on Speaker Identification Combining a New Shift-invariant Phase-related Feature (NRD), MFCCs and F0 Information
353

Figure 9: Percent correct speaker identification when
MFCC features are used for speaker modeling. Results are
presented when the MFCC feature vector size varies be-
tween 1 and 19, and when speaker modeling uses data from
either 3 vowels or 5 vowels.
MFCC feature sizes between 13 and 14. Although
this is perfectly in line with the typical 13-coefficient
MFCC feature size commonly found in the literature
and currently used by actual software and hardware
systems, we were expecting to see a different number
given that the speaker modeling conditions are pecu-
liar. Lastly, the best percent correct identification is
77% which is fair but clearly not competitive, as we
have anticipated already, and which can be explained
by the fact that (deliberately) we use a very simple,
Euclidian-based, distance metric.
It is also worth stressing that MFCC results have
been obtained using diagonal covariance matrices.
We also tested with full covariance matrices but these
were found to be singular which suggests a linear de-
pendency may exist among different MFCC coeffi-
cients.
5.3 Performance of F0 & F0std Features
Table 2 presents the percent correct speaker identi-
fication results when the average fundamental fre-
quency (F0) alone is used, when the F0 standard de-
viation is used, when both values are used and the co-
variance matrices are forced to be diagonal, and when
full covariance matrices are allowed in the compu-
tation of the distance metric (2). The most relevant
Table 2: Percent correct speaker identification using F0 fre-
quency only, using the standard deviation of F0, using both
frequency values and diagonal covariance matrices, or using
full covariance matrices.
F0 F0std F0+F0std F0+F0std (full)
29.73% 25.68% 39.19% 40.54%
conclusion is that both F0 and F0std possess a visible
potential helping the speaker discrimination task, and
that that potential is even more expressive when both
values are combined.
6 PERFORMANCE WHEN
FEATURES ARE COMBINED
We extended our simulation environment to allow any
combination of any number (from 1 to 19) of NRD
coefficients, any number (from 1 to 19) of MFCC co-
efficients, and any number of F0-related features (i.e.
from 1 to 2, 1 meaning just F0 and 2 meaning F0 plus
F0std) in an extended feature vector. Iterating over all
possibilities looking for the maximum overall identi-
fication performance, and using diagonal covariance
matrices, we were surprised to find that the best re-
sults were even poorer that those achieved with in-
dividual features. For example, we obtained 67.57%
which is less than the best results (77%) obtained us-
ing MFCCs alone (as reported in Sec. 5.2). In short,
using diagonal covariance matrices, data fusion at the
feature level, when all three types of features are si-
multaneously present in the feature vectors, does not
appear to lead to improvements.
As expected, using full covariance matrices leads
to numerical errors as covariance matrices are singu-
lar.
Before moving to a different fusion strategy, we
tried to arrange the covariance matrices so that they
are diagonal only in those regions where covariance
elements relate feature coefficients of the same type.
In other words, considering that each feature vec-
tor includes NRD, MFCC and F0-related coefficients,
the overall covariance matrix can be split into 9 sub-
matrices, only the three of which that lie along the
main diagonal, are forced to be locally diagonal. Al-
though the number of cases in which the overall co-
variance matrix is singular is smaller, the problem still
persists.
7 PERFORMANCE WHEN
DISTANCES ARE COMBINED
Since our attempts to ‘fuse’ features into extended
feature vectors did not produce useful results, we
moved to a new approach of “score fusion” which
is a more promising approach (Ramachandran et al.,
2002). According to this approach, distances (or
scores) for speaker identification are obtained sepa-
rately for different types of features (in our case we
have three: NRD, MFCC and F0-related features).
These distances are then combined, or ‘fused’, giving
rise to an overall distance which determines a success-
ful or unsuccessful speaker identification.
In this process, we also investigated why full co-
variance matrices did not produce useful results as re-
SIGMAP 2018 - International Conference on Signal Processing and Multimedia Applications
354
ported in Secs. 5.1 and 5.2.
Let us admit that we deal with a full-rank covari-
ance matrix C. Simple examples may help to high-
light the fact that even when all elements in C
−1
are positive-valued (which is not always guaranteed),
then there are good changes that some parcels in com-
puting d
2
according to Eq. (1) and involving off-
diagonal elements in C
−1
, are in fact negative, which
is against the concept of distance that, by definition, is
always positive. As a consequence, we redefined Eq.
(1) according to two simple and fair principles:
• the new distance metric should reduce to Eq. (1)
as a particular case when diagonal covariance ma-
trices are used,
• it should involve only positive values in the com-
putations.
Hence, considering that when diagonal covariance
matrices are used, Eq. (1) delivers a variance-
normalized Euclidian distance, we extended this con-
cept such that when products of difference factors are
involved that pertain to different feature coefficients,
the absolute value of those difference factors is con-
sidered instead, which is followed by a normalization
using the standard deviation of the feature coefficients
involved. Thus, the modified distance is computed as
follows:
d
2
=
|
x − µ
|
T
S
|
x − µ
|
, (3)
where S is first obtained as the outer product be-
tween the standard deviations of the feature vector,
i.e. S = σσ
T
, and finally all elements in S become
their reciprocal, i.e. s
i, j
= (s
i, j
)
−1
. Clearly, when C is
diagonal, then S = C
−1
and Eq. (3) gives rise to the
same result as Eq. (1).
When the modified distance metric according to
Eq. (3) is introduced in the distance metric defined by
Eq. (2), new results are obtained for the three types of
features. Those concerning NRD and MFCC are rep-
resented in Figs. 10 and 11, respectively. The results
Figure 10: Percent correct speaker identification when NRD
features based on 5 vowels are used for speaker modeling.
Results are presented when the NRD feature vector size
varies between 1 and 19, and when the modified distance
metric uses a full or diagonal S matrix.
in these figures for diagonal S matrix are exactly the
same as those represented in Figs. 7 and 9 for the case
of 5-vowel speaker modeling. It can be concluded
Figure 11: Percent correct speaker identification when
MFCC features based on 5 vowels are used for speaker
modeling. Results are presented when the MFCC feature
vector size varies between 1 and 19, and when the modified
distance metric uses a full or diagonal S matrix.
that concerning NRDs, the maximum performance in-
creases slightly (from about 42% to 43%) and then
performance decreases for feature vector sizes larger
than 14. Concerning MFCCs, results for full S ma-
trix are almost always slightly above those obtained
for diagonal S matrix and, in particular, the maximum
performance increases from around 77%, as already
seen in Sec. 5.2, to around 84%. Finally, the results
regarding F0-related features are presented in Table
3. The only new fact in this case and taking into con-
sideration the results presented in Table 2, is that the
results for full S matrix are even better than the results
that were obtained with full covariance C matrix.
Table 3: Percent correct speaker identification using F0 fre-
quency only, using F0 + F0std features and diagonal S ma-
trix, and using F0 + F0std features and full S matrix.
F0 F0+F0std (diag S) F0+F0std (full S)
29.73% 39.19 % 41.89%
According to Ramachandran et al. (Ramachan-
dran et al., 2002), improvements in fusion should be
expected only when data is such that it leads to uncor-
related errors when considered individually. We have
thus analysed the behaviour of distances for those
cases of correct identification using each feature type
individually. These results are shown in Fig. 12.
The feature vector size is 14 in the case of NRD and
MFCC, and 2 in the case of F0-related features. Sev-
eral interesting conclusions can be extracted from Fig.
12. First, when MFCC features are used, speakers
whose number is 2, 6, 16, 17 and 18 are not cor-
rectly identified and so it also happens for NRD and
F0-related features, with exception for speaker num-
ber 18 who is correctly identified using NRD features.
This shows however that identification errors for dif-
ferent features are not truly uncorrelated, which sug-
First Experiments on Speaker Identification Combining a New Shift-invariant Phase-related Feature (NRD), MFCCs and F0 Information
355
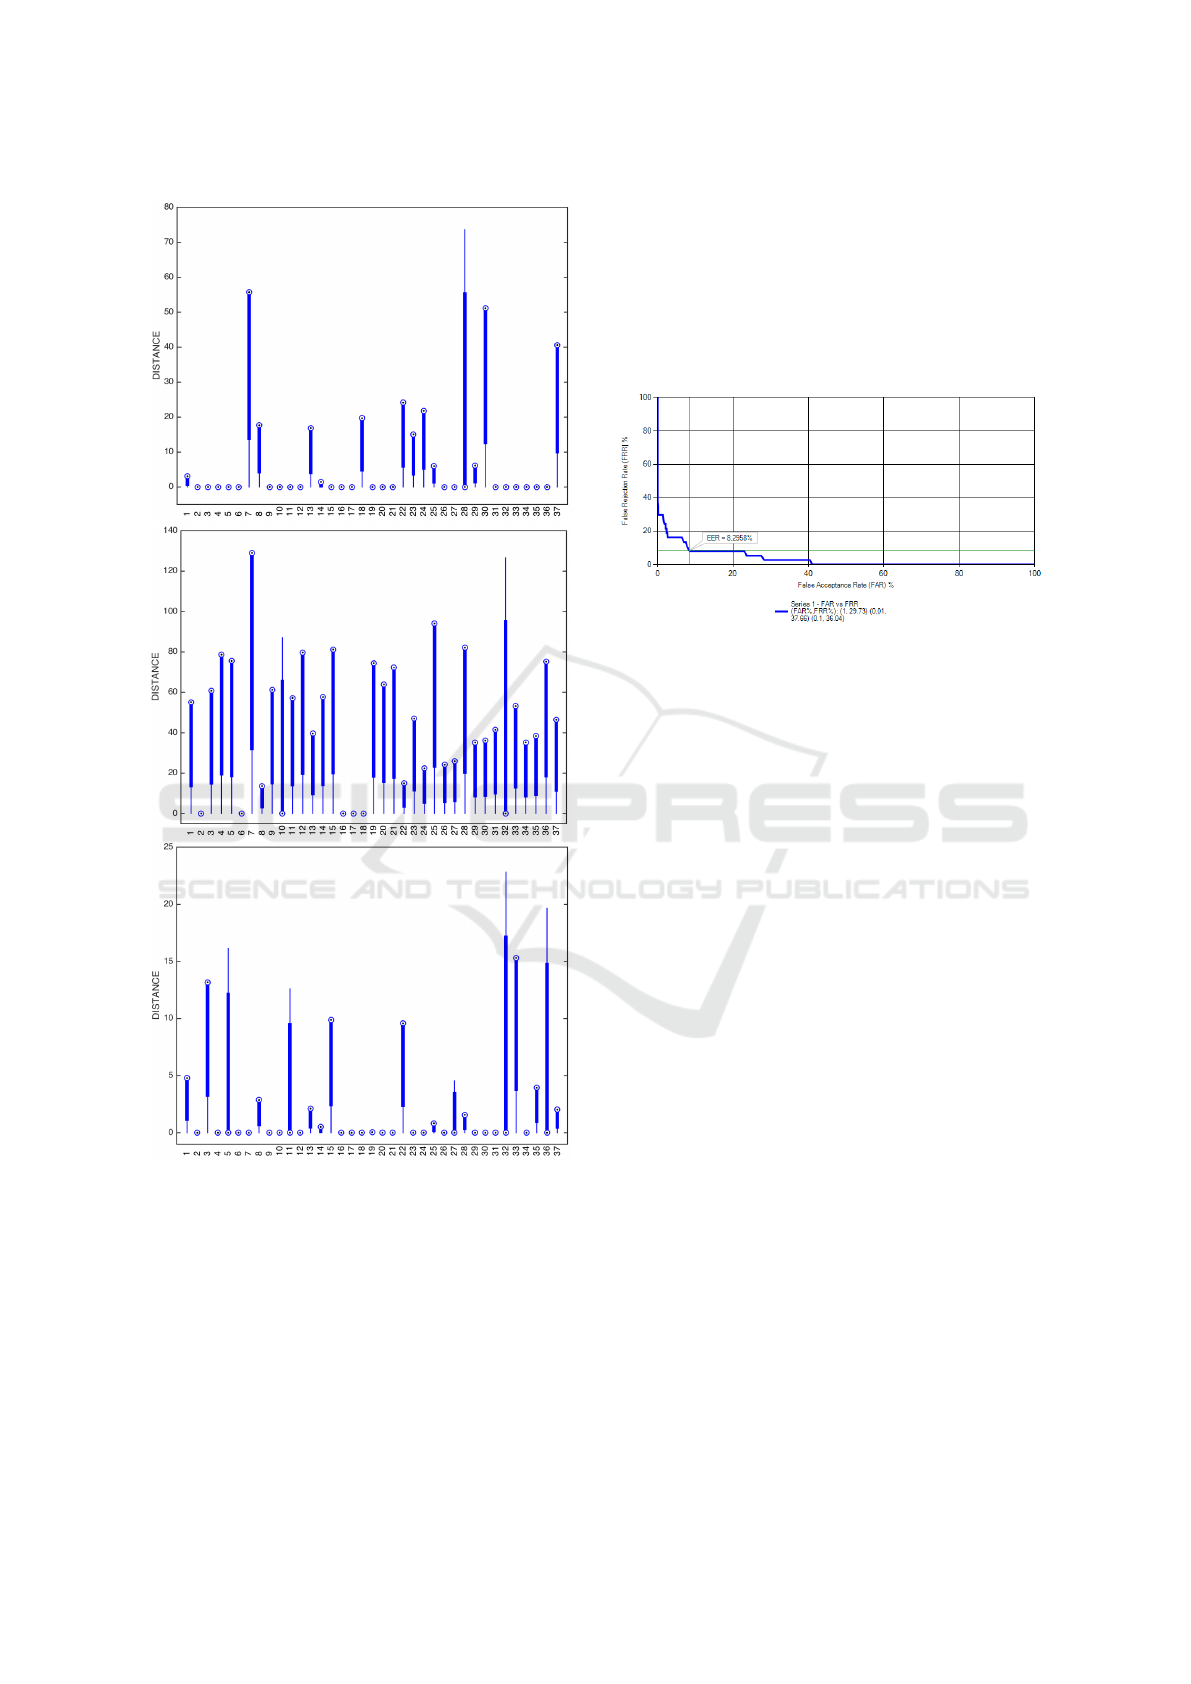
Figure 12: Distances associated with correct identification
cases when NRD features are used (top panel), when MFCC
features are used (middle panel) and when F0-related fea-
tures are used (lower panel). The numbers in the horizontal
represent the speaker number. Please note that no bar means
that the speaker has not been correctly identified.
gests fusion of distances is likely to face difficulties.
Our attempts to fuse distances involved additive
and multiplicative combinations as we were looking
for the simplest possible ways. Only multiplicative
combinations produced useful results. We started by
combining MFCC and NRD distances and enforcing
a saturation point on the NRD distance. We allowed
our simulation environment to search for the maxi-
mum performance using any combination of feature
vector sizes. We concluded that the maximum percent
correct speaker identification was 86.48%. As Fig.
13 illustrates, an analysis of the resulting score matrix
(after simple conversion of distances to scores, as sug-
gested in Sect. 4), leads to an EER=8.3%. For a given
Figure 13: Equal Error Rate (EER) when 14-dimensional
NRD and MFCC feature vectors are separately used in
speaker modeling but distances are combined in speaker
identification.
saturation threshold (25), this result emerged by us-
ing 12-dimensional NRD vectors and 14-dimensional
MFCC vectors. Interestingly, the same correct identi-
fication performance (86.48%) was also obtained for
other saturation levels, e.g. 35, in which case the di-
mension of NRD vectors is 15, and that of MFCC fea-
ture vectors is 14.
Trying to combine in a multiplicative way the dis-
tances due F0-based modeling, we have observed that
results do not improve. In fact, they drop instead to
81.1% correct identification.
Using the best scenario obtained so far combining
NRD and MFCC features, we also assessed the im-
pact of using diagonal S matrices. We concluded that
the correct identification level droped significantly
from 86.48% to 74.3%.
Quick overall conclusions are as follows:
• despite the deliberate simplistic statistical model-
ing conditions in this paper, the best speaker iden-
tification score that we achieved, in the order of
86.5%, can be considered fairly good especially
in face of the fact that about half of the subjects
in the database are twins, and that recordings for
speaker model training and testing consist of five
sustained vowels each about 1 second long,
• mixing acoustic features of different types does
not appear to add constructively in the same fea-
ture vector, which possibly explains why only
MFCC-related features are used by most speaker
identification systems,
SIGMAP 2018 - International Conference on Signal Processing and Multimedia Applications
356

• when speaker modeling and identification is im-
plemented separately using different categories of
features, and the performance of the individual
methods is quite asymmetric, their combination is
not guaranteed to deliver improved results, on the
contrary, chances are that the opposite happens,
• while improving fusion at the score level or at the
distance level is beneficial, optimizing fusion too
much can turn into a kind of black magic that
serves rather the purpose of overfitting the train-
ing and testing data,
• our results confirm that even for very special con-
ditions governing data base construction, MFCC
features deliver the best performance,
• despite the fact that the innovative time-shift in-
variant phase-related feature, as well as F0-related
features, exhibit a potentially interesting speaker
discrimination capability when they are consid-
ered separately for speaker modeling and identifi-
cation, further research is needed to constructively
combine them such as to improve their overall
performance.
8 CONCLUSIONS
In this paper we described a number of speaker iden-
tification experiments which focused on simple meth-
ods evaluating the performance of three types of
acoustic features, notably an innovative, time-shift
invariant, phase-related feature. We assessed the
speaker identification performance of all three types
of features individually considered, and studied fea-
ture fusion and distance fusion methods looking for
improved performance. Immediate future work will
address assessing how the performance in speaker
identification is affected when the high-quality voice
recordings we have used in this paper are replaced by
their corresponding telephonic versions. More long-
term future work will concentrate on extended, re-
fined or new features that possess a psychoacousti-
cal meaning and allow to effectively capture speaker
idiosyncratic traits (or gestures) without requiring so-
phisticated statistical modeling approaches. Of par-
ticular interest are ‘minutia level’ features, namely
pitch striations (Hansen and Hasan, 2015).
ACKNOWLEDGEMENTS
The author would like to thank Anil Alexander and
Oscar Forth at Oxford Wave Research for the use of
the Bio-Metrics software making it possible to pro-
duce some of the results presented in this paper.
This work was financed by FEDER - Fundo Eu-
ropeu de Desenvolvimento Regional funds through
the COMPETE 2020-Operacional Programme for
Competitiveness and Internationalization (POCI), and
by Portuguese funds through FCT-Fundac¸
˜
ao para a
Ci
ˆ
encia e a Tecnologia in the framework of the project
POCI-01-0145-FEDER-029308.
REFERENCES
Alam, M. J., Kenny, P., and Stafylakis, T. (2015). Com-
bining amplitude and phase-based features for speaker
verification with short duration utterances. In Pro-
ceeedings of Interspeech, pages 249–253.
Davis, S. B. and Mermelstein, P. (1980). Comparison
of parametric representations for monosyllabic word
recognition in continuously spoken sentences. IEEE
Transactions on Acoustics, Speech and Signal Pro-
cessing, 28(4):357–366.
de Cheveign
´
e, A. and Kawahara, H. (2002). Yin, a funda-
mental frequency estimator for speech and music. J.
Acoustical Society of America, 111(4):1917–1930.
Dias, S. and Ferreira, A. (2013). A hybrid LF-Rosenberg
frequency-domain model of the glottal source. In 2013
IEEE Workshop on Applications of Signal Processing
to Audio and Acoustics.
Dias, S. and Ferreira, A. (2014). Glottal pulse estimation -
a frequency domain approach. In Speech Processing
Conference. Tel-Aviv, Israel.
Dias, S., Sousa, R., and Ferreira, A. (2011). Glottal inverse
filtering: a new road-map and first results. In Speech
Processing Conference. Tel-Aviv, Israel.
Fernandes, V. and Ferreira, A. (2017). On the relevance
of F0, Jitter, Shimmer and HNR acoustic parameters
in forensic voice comparisons using GSM, VOIP and
contemporaneous high-quality voice records. In AES
Conference on Audio Forensics.
Ferreira, A. (2014). On the possibility of speaker discrim-
ination using a glottal pulse phase-related feature. In
IEEE International Symposium on Signal Processing
and Information Technology -ISSPIT. Noida, India.
Ferreira, A. (2016). Implantation of voicing on whispered
speech using frequency-domain parametric modelling
of source and filter information. In International Sym-
posium on Signal, Image, Video and Communications
(ISIVC), pages 159–166. Tunis, Tunisia.
Ferreira, A. and Fernandes, V. (2017). Consistency of the
F0, Jitter, Shimmer and HNR voice parameters in
GSM and VOIP communication. In DSP 2017.
Ferreira, A. and Sinha, D. (2016). Advances to a frequency-
domain parametric coder of wideband speech. 140th
Convention of the Audio Engineering Society. Paper
9509.
Ferreira, A. J. and Tribolet, J. M. (2018). A holistic glotal
phase related feature. In 21st International Confer-
First Experiments on Speaker Identification Combining a New Shift-invariant Phase-related Feature (NRD), MFCCs and F0 Information
357

ence on Digital Audio Effects (DAFx-18). Aveiro, Por-
tugal.
Ferreira, A. J. S. (2007). Static features in real-time recog-
nition of isolated vowels at high pitch. Journal of the
Acoustical Society of America, 112(4):2389–2404.
Ferreira, A. J. S. and Sousa, R. (2010). DFT-based fre-
quency estimation under harmonic interference. In 4th
International Symposium on Communications, Con-
trol and Signal Processing.
Hansen, J. H. L. and Hasan, T. (2015). Speaker recognition
by machines and humans. IEEE Signal Processing
Magazine, 32(6):136–145.
Mendes, D. and Ferreira, A. (2012). Speaker identification
using phonetic segmentation and normalized relative
delays of source harmonics. In 46th AES International
Conference on Audio Forensics, pages 215–222. Paper
9-1.
Nakagawa, S., Asakawa, K., and Wang, L. (2007). Speaker
recognition by combining MFCC and phase informa-
tion. In Proceeedings of Interspeech, pages 2005–
2008.
Padmanabhan, R., Parthasarathi, S. H. K., and Murthy,
H. A. (2009). Using group delay functions from all-
pole models for speaker recognition. In Proceeedings
of Interspeech, pages 2355–2358.
Rabiner, L. and Juang, B.-H. (1993). Fundamentals of
Speech Recognition. Prentice-Hall, Inc.
Rajan, P., Kinnunen, T., Hanilci, C., Pohjalainen, J., and
Alku, P. (2013). Using group delay functions from all-
pole models for speaker recognition. In Proceeedings
of Interspeech, pages 2489–2493.
Ramachandran, R. P., Farrell, K. R., Ramachandran, R., and
Mammone, R. J. (2002). Speaker recognition - general
classifier approaches and data fusion methods. Pattern
Recognition, 35(12):2801–2821.
Raynolds, D. A. (1997). Comparison of background nor-
malization methods for text-independent speaker ver-
ification. In Proceeedings of Eurospeech, pages 963–
966.
Saratxaga, I., Hernaez, I., Erro, D., Navas, E., and Sanchez,
J. (2009). Simple representation of signal phase for
harmonic speech models. Electronic Letters, 45(381).
Segundo, E. S., Tsanas, A., and G
´
omez-Vilda, P. (2017).
Euclidian distances as measures of speaker similarity
including identical twin pairs: a forensic investigation
using source and filter voice characteristics. Forensic
Science International, (270):25–38.
Sousa, R. and Ferreira, A. (2010). Importance of the rel-
ative delay of glottal source harmonics. In 39th AES
International Conference on Audio Forensics - prac-
tices and challenges, pages 59–69.
Sousa, R. and Ferreira, A. (2011). Singing voice analysis
using relative harmonic delays. In 12th Annual Con-
ference of the International Speech Communication
Association (Interspeech-2011), pages 1997–2000.
Stylianou, I. (1996). Harmonic plus noise models for
speech, combined with statistical methods, for speech
and speaker modification. PhD thesis,
´
Ecole Na-
tionale Sup
´
erieure des T
´
el
´
ecommunications, France.
Sundberg, J. (1987). The Science of the Singing Voice.
Northern Illinois University Press.
Ventura, J., Sousa, R., and Ferreira, A. (2012). Accurate
analysis and visual feedback of vibrato in singing.
In 5th International Symposium on Communications
Control and Signal Processing (ISCCSP).
Wang, L., Minami, K., Yamamoto, K., and Nakagawa, S.
(2010). Speaker identification by combining MFCC
and phase information in noisy environments. In IEEE
International Conference on Acoustics, Speech and
Signal Processing, pages 4502–4505.
Wang, L., Ohtsuka, S., and Nakagawa, S. (2009). High
improvement of speaker identification and verification
by combining mfcc and phase information. In IEEE
International Conference on Acoustics, Speech and
Signal Processing, pages 4529–4532.
SIGMAP 2018 - International Conference on Signal Processing and Multimedia Applications
358
