
Cost Comparison of Lambda Architecture Implementations for
Transportation Analytics using Public Cloud Software as a Service
Pedro F. Pérez-Arteaga
1
, Cristian C. Castellanos
2
, Harold Castro
2
, Dario Correal
2
, Luis A. Guzmán
1
and Yves Denneulin
3
1
Grupo de Sostenibilidad Urbana y Regional, SUR, Departamento de Ingeniería Civil y Ambiental,
Universidad de los Andes, Edificio Mario Laserna Cra 1° Este N° 19ª-40, Bogotá, Colombia
2
Departamento de Ingeniería de Sistemas y Computación, Universidad de los Andes,
Edificio Mario Laserna Cra 1° Este N° 19ª-40, Bogotá, Colombia
3
Ensimag, Institut National Polytechnique de Grenoble, Grenoble, France
Keywords: Lambda Architecture, Cost Comparison, Performance Evaluation, Transport Analytics, Bus Delay Prediction,
Software as a Service.
Abstract: Lambda architecture has gained high relevance for big data analytics by offering mixed and coordinated data
processing: real time processing for fast data streams and batch processing for large workloads with high
latency. However, concrete implementations over cloud infrastructures and cost comparisons are still not
being sufficiently analyzed. This paper presents a cost comparison of Lambda architecture implementations
using Software as a Service (SaaS) to support IT decision makers when streaming-analytics solutions must
be implemented. To do that, a case study of transportation analytics is developed on three public cloud
providers: Google Cloud Platform, Microsoft Azure, and Amazon Web Services Cloud. The evaluation is
carried out by comparing deployment, configuration, development, and performance costs in a public-
transportation delay-monitoring case study assessing various concurrency scenarios.
1 INTRODUCTION
Big data analytics (BDA) in real-time can provide up-
to-the-minute insights to enterprise users, so that
faster and better business decisions can be made.
BDA requires the collection of huge amounts of data
produced by multiple sources at high speed and its
processing with low latency using analytic
algorithms. In this context, Lambda architecture
(Marz and Warren, 2015) has gained high relevance
for BDA by offering mixed and coordinated data
processing: real time processing for fast data streams
and batch processing for large workloads with high
latency.
The Lambda architecture combines batch
precomputed views and low-latency responses by
building a series of layers which satisfy a subset of
concerns. The batch layer stores a copy of the master
dataset and precomputes the batch views. The batch
layer stores an immutable, constantly growing dataset
and computes arbitrary functions over the whole
dataset to generate the batch views. This heavy
workload implies high latency processing, and
therefore the next layers compensate for this
limitation. The speed layer compensates for the high
latency of the batch layer by precomputing the delta
of data not processed by the batch layer. The goal is
to guarantee that new data are included as soon as
needed for the user queries, thus offering speed views.
The serving layer is a specialized distributed database
that enables random reads on batch views. When new
batch views are generated, the serving layer
automatically swaps those in so that more up-to-date
results can be queried.
Cloud computing is an enabler for big data
solutions because it offers infrastructure, storage, and
processing capabilities that can be leased via pay-as-
you-go models. These capabilities can be offered in
different delivery models which are built one upon the
other. Infrastructure-as-a-Service (IaaS) provides a
self-contained environment comprised of IT
infrastructure resources. Platform-as-a-Service
(PaaS) offers a pre-configured cloud environment
ready for the development and deployment of
applications. Software-as-a-Service (SaaS) enables
customers to use high-level functional services
Pérez-Arteaga, P., Castellanos, C., Castro, H., Correal, D., Guzmán, L. and Denneulin, Y.
Cost Comparison of Lambda Architecture Implementations for Transportation Analytics using Public Cloud Software as a Service.
DOI: 10.5220/0006869308550862
In Proceedings of the 13th International Conference on Software Technologies (ICSOFT 2018), pages 855-862
ISBN: 978-989-758-320-9
Copyright © 2018 by SCITEPRESS – Science and Technology Publications, Lda. All rights reserved
855

without incurring in the cost of license acquisition or
software maintenance. This latter delivery model is
oriented to decrease the Total Cost of Ownership and
increase the Return on Investment.
Previous studies have proposed concrete
implementations of Lambda architecture (Villari et
al., 2014; Hasani et al., 2014; Batyuk and Voityshyn,
2016) including cloud services (Pham, 2015; Kiran et
al., 2015; Gribaudo et al., 2017). However, concrete
implementations of Lambda architecture over SaaS
and cost comparison have still not been sufficiently
analyzed. Cloud services facilitate the provisioning of
near-infinite and elastic resources necessary for
storing and processing stream data analytics and
heavy batch workloads. For this reason, the public
cloud is a natural environment to implement BDA
solutions.
This paper presents a cost comparison of Lambda
architecture implementations, taking advantage of the
SaaS delivery model to support IT decision making
when streaming-analytics solutions must be
implemented. To do that, a case study of
transportation analytics is developed on three public
cloud providers: Google Cloud Platform, Microsoft
Azure, and Amazon Web Services (AWS) Cloud. The
evaluation is carried out by comparing the
deployment, configuration, development, and
performance costs in a public-transportation delay-
monitoring case study assessing various concurrency
scenarios.
This paper is organized as follows: Section 2
shows previous studies with implementations of
Lambda architecture. Section 3 introduces the case
study of transportation analytics. Section 4 describes
the different implementations of Lambda architecture
using SaaS. Section 5 summarizes the test
methodology. Section 6 reports the results obtained.
Section 7 presents the discussion of the results.
Finally, Section 8 outlines the conclusions.
2 RELATED WORK
The following previous works have focused on
implementations and optimizations of Lambda
architectures deployed on IaaS and PaaS, but they
neither tackle implementations on SaaS of different
public vendors nor offer multi-factor cost
comparisons to support decision-making when a
Lambda architecture solution is instantiated. Pham
(2015) proposes a flexibly adaptive cloud-based
framework for BDA as a Service (BDAaaS) by
implementing Lambda architecture for real-time
analytics. The framework collects and analyzes data,
implementing concrete technologies for each Lambda
layer. These layers are deployed automatically over
public cloud providers. Kiran et al., (2015) present an
implementation of Lambda architecture to construct
data processing on Amazon EC2 delivered as a
service to minimize the cost of maintenance. Thota et
al., (2018) present an architecture for integration to
offer capabilities such as streaming, bulk processing,
and data services for cloud deployment. Grulich and
Zukunft (2017) propose a streaming processing
architecture for car information systems and validate
the scalability metrics on cloud infrastructure
deployment. Similarly to previous works,
Dissanayake and Jayasena (2017) offer an
implementation of Lambda architecture for IoT
analytics using AWS PaaS to address scalability,
availability, and performance quality attributes.
On the other hand, Gribaudo et al., (2017) present
a modeling approach, based on multi-formalism and
multi-solution techniques, for performance
assessment of Lambda architecture implementations
to optimize architecture designs. This work provides
a user domain language approach to model and
evaluate performance indices of Lambda architecture
implementations regarding specific infrastructure,
data speed, and computation parameters but tackles
neither the software development effort nor the cloud
service costs regarding the SaaS options provided by
different vendors.
3 CASE STUDY
Travel information services deal with the provision of
static and dynamic information about the road
transport network prior to and during trips (ISO,
2001). We are going to address a case study related to
this service domain: real-time transport status
information. Specifically, we use a service to provide
information about trip delays within a transportation
system. This information is generally provided by the
ITS authority in real-time or near real-time to offer
timely and accurate information to transport users.
Delay monitoring in public transportation services
requires the processing of large datasets of vehicle
locations to be combined with low latency in order to
report the delay times to users in near real-time. This
makes the delay-monitoring service a typical use case
to develop a big data solution that applies Lambda
architecture.
Our case study presents a proposed bus arrival
time prediction with Lambda architecture. The
developed architecture covers the batch layer using
historical data with a one-day execution window, and
SE-CLOUD 2018 - Special Session on Software Engineering for Service and Cloud Computing
856

the speed layer uses real-time data with a five-minute
execution window continually during the day. The
algorithm in both layers calculates an expected
average delay in five-minute windows. These
windows are generated for each key composed of the
route ID, stop ID, and window time. Additionally, the
delay average is grouped by day of the week. The
window time is defined by the groups of trip updates
reported within five minutes.
We take the Metro Vancouver’s regional
transportation GTFS dataset, which is publicly
available, and real-time trip update data (Translink
GTFS Realtime Open API), which provides
Vancouver’s real-time transportation data for the
analysis.
3.1 Translink Dataset
The open API of Translink serves trip update data in
GTFS Realtime (protobuffer format), and we send
requests to collect feeds every 60 seconds. These data
were collected during one week from December 11,
2017 to December 17, 2017 for 16 hours every day.
The GTFS real-time data contains just over 6,720
trip updates with 4,631,075 protobuffer files, which
are deserialized to JSON format. In summary, these
JSON files comprise 211 routes and 8,447 stops, each
pair with a delay time to the next stop. The size of the
dataset (binary format) is 383 MB in 6,720 individual
files.
3.2 Steps Needed to Calculate the
Waiting Time
A trip update provides information in real-time about
the trips in operation in the city of Vancouver. This
means that the first step is to join the planned GTFS
trips file with each trip update in GTFS Realtime.
This step is necessary in both layers.
In the next step, the speed layer receives a Travel
Update with approximately 45,000 JSON updates
every 60 seconds. The algorithm makes groups every
five minutes (time window) with exactly five JSON
updates. Then the speed layer assembles tuples with
the route ID, stop ID, and their expected delay
average. Every five minutes, the speed layer writes
the results composed of the stop ID, route ID, week
day, time window and average delay in the serving
layer. Consequently, the preprocessed view with the
real-time information calculation is ready to respond
to users’ requests. The goal is to guarantee the
availability of new data as soon as needed for the user
queries, thus offering real-time views.
Simultaneously, the batch layer job is executed at
the end of the day to compute the whole of the stored
raw data generating the same output (stop ID, route
ID, week day, time window, and average delay). Each
day, the batch layer writes the results over the serving
layer, cumulatively recomputing historic data. This
heavy workload implies high latency processing, and
therefore the speed layer compensates for this
limitation.
Lastly, we implement and evaluate the Lambda
architecture using SaaS with realistic and exhaustive
tests described in the next sections.
4 IMPLEMENTATION
To implement a Lambda architecture solution aligned
to our case study, we define architectural mechanisms
for each layer. The ingestion process is implemented
by means of an event data transfer mechanism. The
batch layer requires a batch processing engine
combined with a resilient distributed file system to
store the immutable master dataset. The speed layer
requires a streaming processing engine of low
latency. Finally, the serving layer can be instantiated
through a relational or column-family database
regarding the model structure and offering low
latency. To compare each BDA SaaS, we implement
versions for each Lambda layer and cloud platform
regarding the architectural decisions and the SaaS
catalog of each cloud vendor (Amazon, Google, and
Azure). In each layer of the Lambda architecture, we
select the service with the highest level of abstraction
and serverless delivery model. This selection is made
for two main reasons: to avoid low-level
implementation and to make the metrics comparable.
4.1 AWS Implementation
The AWS implementation is depicted in Figure 1. The
speed layer uses Kinesis Data Streams to ingest GTFS
messages and to send them to Kinesis Analytics to be
processed in real-time. The processing outputs (speed
views) are stored in an S3 batch bucket using an AWS
Lambda function. In the batch layer, Kinesis Firehose
ingests the raw data and stores it in an S3 bucket. Raw
data is read and processed by an AWS Glue job to be
persisted as batch views in the S3 result bucket. The
serving layer uses Amazon Athena to perform queries
directly in standard SQL over speed and batch views
stored in S3 buckets.
Cost Comparison of Lambda Architecture Implementations for Transportation Analytics using Public Cloud Software as a Service
857
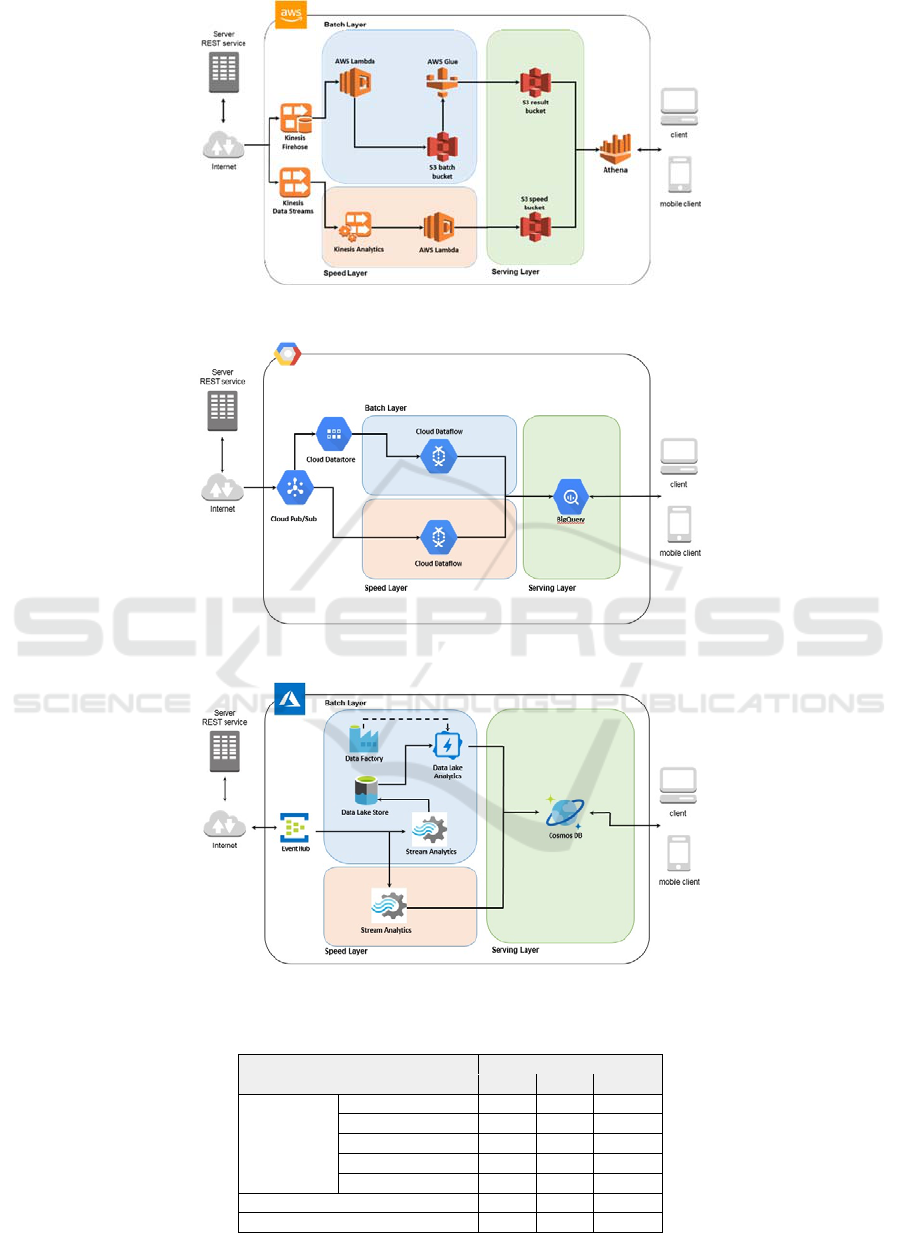
Figure 1: Implementation in AWS.
Figure 2: Implementation in Google Cloud.
Figure 3: Implementation in Microsoft Azure.
Table 1: Comparison metrics for layers.
Metric
Layer
Speed Batch Serving
Performance
Reading time
X
Processing time X X
Writing time
X
Response time
X
Time vs threads
X
Development/configuration effort X X X
Service costs X X X
SE-CLOUD 2018 - Special Session on Software Engineering for Service and Cloud Computing
858

4.2 Google Cloud Implementation
The Google Cloud implementation employs the
Dataflow service in both the speed and the batch layer
and its detail is presented in Figure 2. The speed layer
ingestion is developed by means of a topic in Cloud
Pub/Sub which passes the GTFS messages to a
Dataflow speed job. This job aggregates the
calculations and stores them in Google Cloud
BigQuery. In the batch layer, Pub/Sub service persists
messages in the Cloud Datastore as raw data. Then, a
batch Dataflow job reads the raw data and aggregates
delay averages to write the batch views into
BigQuery. BigQuery is the serving layer to persist
and query views using SQL-like scripts.
4.3 Azure Implementation
For Azure implementation, represented in Figure 3,
the speed layer uses EventHub to ingest GTFS
messages, and the Stream Analytics service processes
them in real-time. The processed speed views are
stored in Cosmos DB. In the batch layer, raw data is
persisted into Data Lake Store using a Stream
Analytics job. The raw data is read by a Data Lake
Analytics job which is scheduled through Data
Factory. The Data Lake Analytics job makes the
calculations and stores the results in Cosmos DB. The
serving layer is built as a Cosmos DB service which
stores the batch and speed views and offers an SQL-
like interface.
5 TEST
We evaluate the three implementations of the Lambda
architecture presented in Section 4 to compare
performance, development/configuration efforts, and
service costs in each layer using the dataset
introduced in Section 3.1. Table 1 summarizes the
metrics evaluated for each layer. The metrics used to
compare the cost of the implementations are
calculated by layer so that architects, administrators,
and developers can evaluate and select the best SaaS
candidate for each layer regarding performance
requirements, time to market, and budget.
5.1 Performance Test
To compare the performance for each public cloud
provider and layer, we define metrics related to
reading time, processing time, writing time, response
time, and response time versus active threads. In the
speed layer, we measure the processing time for each
micro-batch to evaluate the processing speed offered.
In the batch layer, we collect the reading time of raw
data, processing time, and results writing for each
daily execution. In the serving layer, we take the
response time and response time versus thread
metrics using a stress test with a ramping-up depicted
in Figure 4 to evaluate the final user experience when
the delay service is consumed.
The experiment involves a simulation of the
consumption of the GTFS dataset accelerated up to
60 times, which implies that one GTFS feed is
consumed each second. At the same time, the serving
layer is assessed by an automated stress test
implemented in JMeter which launches JDBC queries
that simulate delay service requests made by the
users. The request’s ramp-up reflects a real demand
scenario depicted in Translink (2013), where there are
time slots of low, medium, and high demand during
the day. Hence, Figure 4 details the number of
requests per day (one day = 16 minutes in the 60×
simulation). The whole simulation (seven days) on
each platform takes 112 minutes, where batch job
execution is performed every 16 minutes and a speed
job is performed every 5 seconds.
5.2 Development and Configuration
Regarding the development and configuration effort
quantification, we track the time invested by each
programmer to develop each layer. To have a
comparable effort metric, we ensure that developers
have similar technical skills. The development tasks
include training, coding, and testing. Thus, trip update
JSON parsing and join, filter, and aggregate
operations in each layer (speed and batch) are
registered in hours as ETL development. Time
invested in script building for the serving layer (SQL-
like in most cases) is also recorded. Additionally,
SaaS configuration tasks such as scheduling,
parameter setting, and service provisioning are also
timed.
5.3 Service Costs
Due to different SaaS pricing models for each layer,
the economic cost can be calculated according to the
demand for the tasks, requests, processing, storage, or
resources. So, we sum these costs to obtain a
cumulative cost reported by the vendor’s billing
service for each layer. The total cost of the experiment
(seven days) is projected to a monthly fee.
Cost Comparison of Lambda Architecture Implementations for Transportation Analytics using Public Cloud Software as a Service
859
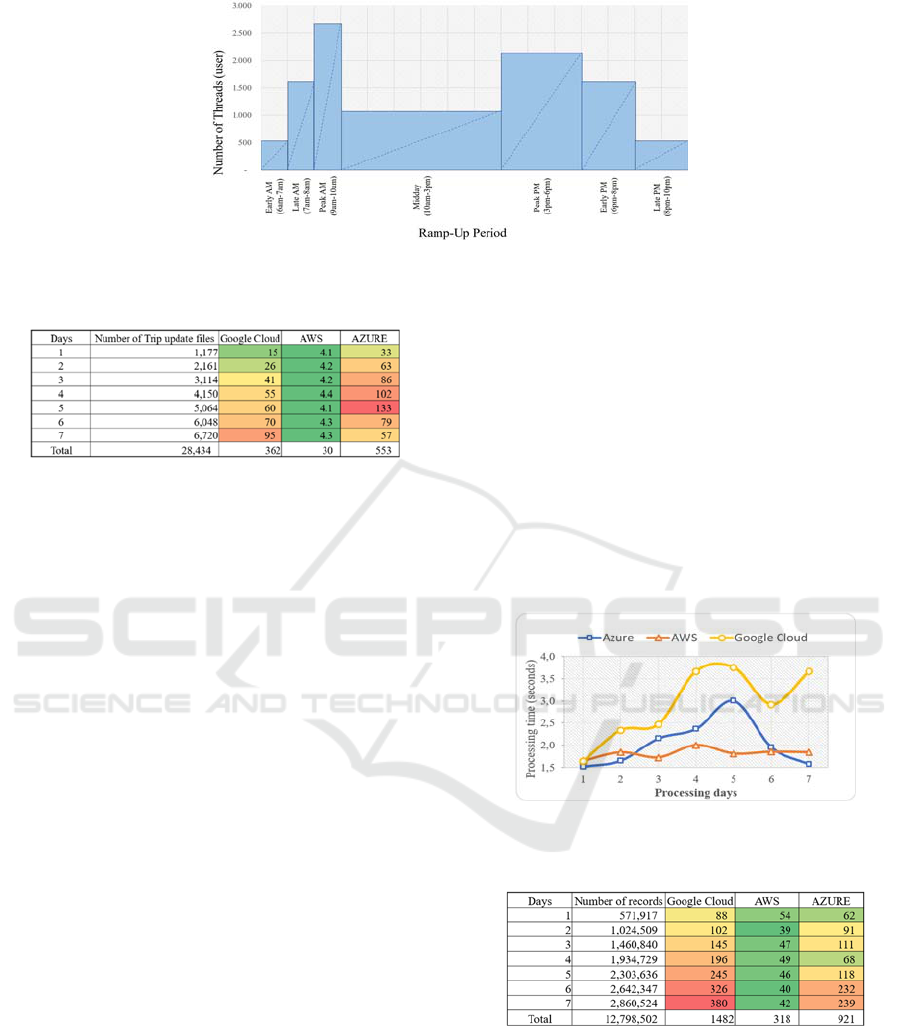
Figure 4: Number of threads per time slot (ramp-up).
Table 2: Average reading time to batch layer in seconds.
6 RESULTS
The case study allows us to evaluate the performance,
development effort, and cost of each public cloud.
The results of this evaluation are described in this
section.
6.1 Performance
The performance test of the batch layer involves the
cumulative processing of trip update files each day.
Approximately 1000 trip update files comprising
700,000 JSONs were collected each day. In total,
6,720 files and 4,631,075 JSONs were collected for
processing.
Before starting the processing in the batch layer,
the raw files of trip updates are read, and for this
reason Table 2 presents the average reading time for
each implementation. The average reading time of
AWS Glue in AWS S3 storage is the most stable and
efficient, while the other batch services take 12 times
(Google Cloud) and 18 times (Azure) longer to read
the raw data. The average reading time of the Cloud
Datastore service in Google Cloud has a constant
increase as the number of trip updates increases every
day. Finally, the average reading time of the Data
Lake Store service in Azure has the highest increase
until the fifth day, after which the average reading
time decreases, which may reflect scaling of the
service.
After reading the files, the next step is to calculate
the waiting time described in Section 3.2. This
processing time is shown in Figure 5. The AWS Glue
service that does the processing of the batch layer in
AWS is again the most consistent and efficient, since
the processing time is almost constant below two
seconds in each execution, despite the increasing
number of files. In contrast, the Google Cloud
Dataflow service has the lowest processing
performance with peaks almost every four seconds,
twice the processing time of AWS. Data Lake
Analytics in Azure is the most sensitive to the number
of processed files, and similarly to the reading time,
the service seems to have scaled during the fifth and
sixth days.
Figure 5: Average processing time for batch layer.
Table 3: Average writing time in batch layer.
The final step of batch processing is to write in the
serving layer. The average writing time is shown in
Table 3. The Amazon S3 service continues to show
consistent behavior, offering the best performance.
Conversely, Google BigQuery presents the worst
average writing times, showing a decreasing trend. In
addition, the Cosmos DB service presents
intermediate average writing times with a slight
increasing is observed in the last two days.
SE-CLOUD 2018 - Special Session on Software Engineering for Service and Cloud Computing
860
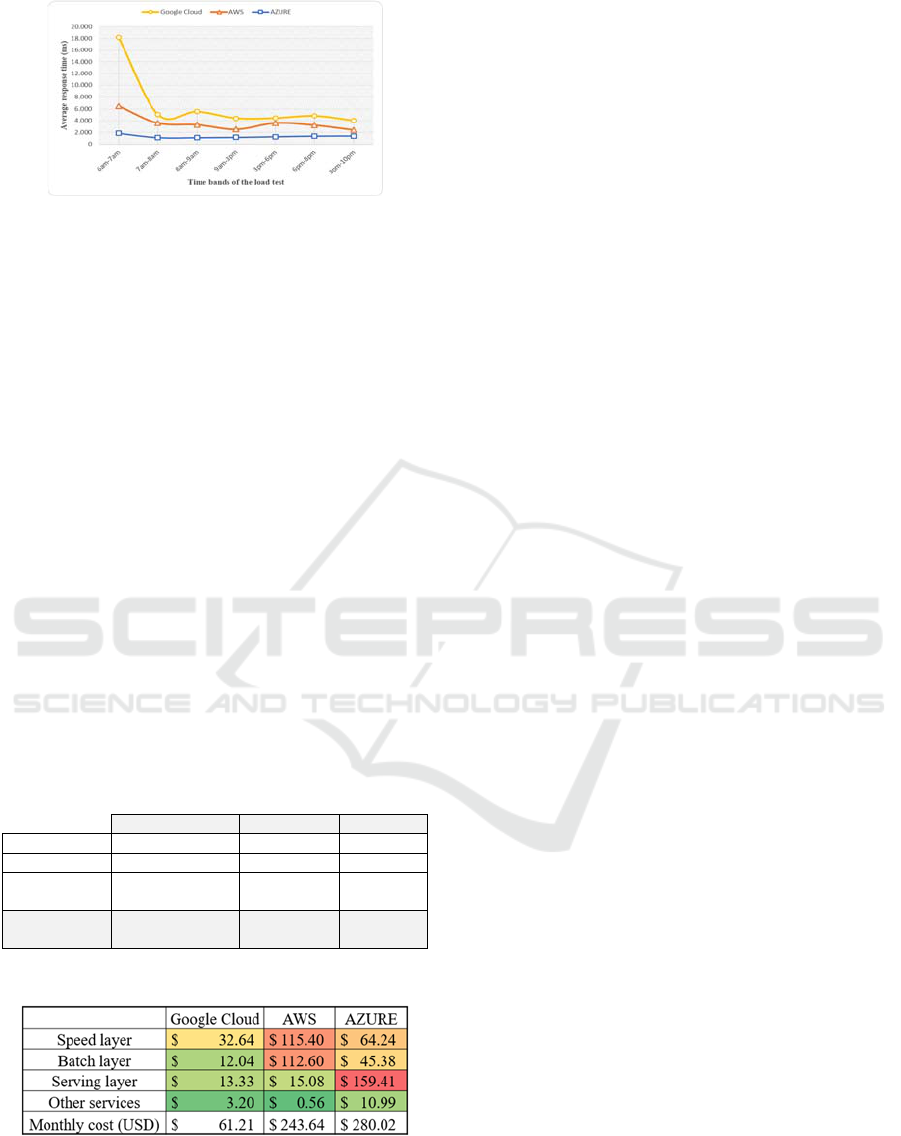
Figure 6: Average response time for the serving layer.
The processing times obtained in the speed layer
are constant on all platforms constrained to real-time
windows, and for this reason we do not consider it
valuable to compare them.
The metric of serving layer performance in
respect of response time is shown in Figure 6. It is
worthy of note that at the beginning of the stress test,
all services start with the highest latency, which is
especially noticeable in the Google serving layer, but
when the test moves forward, the latency is reduced.
Cosmos DB shows the lowest average response
times, followed by AWS Athena and Google
BigQuery respectively.
6.2 Development and Configuration
The effort required for learning, development,
configuration, and deployment was measured for each
developer. Table 4 shows that the total number of
development hours is highest for AWS, followed by
Azure and Google respectively.
Table 4: Development time of Lambda architecture on each
public cloud.
Google Cloud AWS Azure
Speed layer 26.1 42.8 37.4
Batch layer 31.6 31.5 39.7
Serving
layer
16.7 26.2 8.2
Total
(hours)
74.4 100.5 85.3
Table 5: Infrastructure monthly costs (USD).
Google Dataflow implementation requires the
lowest development time in the whole
implementation. Detailing the development effort in
the speed layer, the greatest effort is required for the
AWS Kinesis service. Google Dataflow
implementation seems to require the lowest
development time, probably due to its unified
programming model. In the batch layer,
implementation of the Data Lake Analytics service
requires the greatest effort, while the other cloud
services show similar time investments. Finally, in
the serving layer, the AWS AthenaS3 integration
requires the greatest time effort, while Azure Cosmos
DB requires the lowest development time.
6.3 Service Cost
Each implementation of the Lambda architecture is
deployed in different public cloud providers. We
define and calculate the costs required to replicate a
similar case study with data similar to Vancouver’s
transportation system and operate the system for four
weeks. As a result, Table 5 presents a summary of the
monthly fees generated by each provider during the
simulation. The highest monthly cost is generated by
Azure and is specifically due to the high cost of the
Cosmos DB service. Compared to the other
infrastructures, AWS Glue has the highest individual
costs in the batch layer, while Kinesis has the highest
costs in the speed layer. Google Cloud is the least
expensive provider in all layers, with a remarkable
difference. Finally, regarding the learning curve, the
Google Cloud free tier allows an inexpensive proof of
concept with these SaaSs compared to the other
vendors’ free tiers.
7 DISCUSSION
This document presents a comparison of the costs of
development and deployment for the same case study
over Lambda architecture using three different public
cloud providers (Google Cloud, Microsoft Azure, and
Amazon Web Services) with the main goal of
identifying how different public cloud providers with
the same architecture deployment can affect the
infrastructure cost of running and performance with
concurrent users. In order to obtain valid results, we
implemented three versions of the Lambda
architecture and deployed each one using a different
public cloud provider.
As a result of the development and testing process
of the three implementations deployed, we were able
to understand the challenges that must be overcome
to use the Lambda architecture.
Cost Comparison of Lambda Architecture Implementations for Transportation Analytics using Public Cloud Software as a Service
861

8 CONCLUSION
This work presented Lambda architecture
implementations for different public cloud vendors.
Also, this research offered a comparison of such
implementations to support decision makers when
they need to select specific vendors’ SaaSs in the
context of BDA. Based on the results obtained, we
recommend the most suitable SaaS for each layer
depending on the criteria selected.
In terms of performance, AWS obtained the best
metrics in the batch and speed layers. In the batch
layer, AWS showed the best performance in terms of
reading, processing, and writing time, whereas
Google Cloud seems to be affected by increasing data
size. Focusing on serving layer performance, Azure
presented a constant and efficient behavior compared
to other competitors.
Regarding the time-to-market, AWS required
more man-hours, especially in the speed and serving
layers. Azure had the fastest development in the
serving layer, but batch layer implementations
required more effort because they implied the
development and integration of Data Lake Store,
Stream Analytics, Data Factory, and Data Lake
Analytics services. Google Cloud development was
the fastest, which could be due to the unified
programming model for batch and speed processing
offered by Google Dataflow.
In terms of the cost of services, Azure was the
most expensive provider in the serving layer, whereas
AWS consumed more credits in the serving layer due
to the Cosmos DB service. In contrast, Google Cloud
presented the lowest price in all layers and offers the
widest free tier to initiate the training.
In summary, when performance is a strong
concern, despite the high cost, AWS (in the batch and
speed layers) is the best choice, and Azure (in the
serving layer) should be selected to obtain the best
response times. If the time-to-market guides the SaaS
selection, Google Cloud is recommended although
the performance could be affected. Finally, if service
pricing is an important constraint, Google Cloud
again offers the best choice by a factor of 1/4.
ACKNOWLEDGMENTS
This research was carried out by the Center of
Excellence and Appropriation in Big Data and Data
Analytics (CAOBA), supported by the Ministry of
Information Technologies and Telecommunications
of the Republic of Colombia (MinTIC) through the
Colombian Administrative Department of Science,
Technology and Innovation (COLCIENCIAS) under
contract no. FP44842-anex46-2015. Special thanks
are due to CAOBA’s members: Miguel Rodriguez,
Felipe Gonzalez-Casabianca, Miguel Barrera, and
Camilo Ortiz.
REFERENCES
Batyuk, A. and Voityshyn, V. (2016). Apache storm based
on topology for real-time processing of streaming data
from social networks. In 2016 IEEE DSMP, pages 345–
349. IEEE.
Dissanayake, D. M. C. and Jayasena, K. P. N. (2017). A
cloud platform for big iot data analytics by combining
batch and stream processing technologies. In 2017
NITC, pages 40–45.
Gribaudo, M., Iacono, M., and Kiran, M. (2017). A
performance modeling framework for lambda
architecture based applications. Future Generation
Computer Systems.
Grulich, P. M. and Zukunft, O. (2017). Smart stream-based
car information systems that scale: An experimental
evaluation. In 2017 IEEE iThings, pages 1030–1037.
Hasani, Z., Kon-Popovska, M., and Velinov, G. (2014).
Lambda architecture for real time big data analytic. ICT
Innovations, pages 133–143.
ISO (2001). Intelligent transport systems - Reference model
architecture(s) for de ITS sector. Part 1: ITS service
domains, service groups and services.
Kiran, M., Murphy, P., Monga, I., Dugan, J., and Baveja, S.
S. (2015). Lambda architecture for cost-effective batch
and speed big data processing. In 2015 IEEE
International Conference on Big Data (Big Data),
pages 2785–2792. IEEE.
Marz, N. and Warren, J. (2015). Big Data, Principles and
best practices of scalable real-time data systems.
Manning Publications Co.
Pham, L. M. (2015). A Big Data Analytics Framework for
IoT Applications in the Cloud. VNU Journal of Science:
Computer Science and Communication Engineering,
31(2):44–55.
Thota, C., Manogaran, G., Lopez, D., and Sundarasekar,
R.(2018). Architecture for Big Data Storage in
Different Cloud Deployment Models. In Handbook of
Research on Big Data Storage and Visualization
Techniques, pages 196–226. IGI Global.
TransLink (2013). 2011 Metro Vancouver Regional Trip
Diary Survey Analysis Report. Technical report,
TransLink, Vancouver.
Villari, M., Celesti, A., Fazio, M., and Puliafito, A. (2014).
AllJoyn Lambda: An architecture for the management
of smart environments in IoT. In 2014 International
Conference on Smart Computing Workshops, pages 9–
14. IEEE.
SE-CLOUD 2018 - Special Session on Software Engineering for Service and Cloud Computing
862
