
Investigating the Effect of Software Metrics Aggregation on Software
Fault Prediction
Deepanshu Dixit
1
and Sandeep Kumar
2
Department of Computer Science and Engineering, Indian Institute of Technology Roorkee, Roorkee, India
Keywords:
Software Fault Prediction, Aggregation of Software Metrics, Average Absolute Deviation, Interquartile Range.
Abstract:
In inter-releases software fault prediction, the data from the previous version of the software that is used for
training the classifier might not always be of same granularity as that of the testing data. The same scenario
may also happen in the cross project software fault prediction. So, one major issue in it can be the difference
in granularity i.e. training and testing datasets may not have the metrics at the same level. Thus, there is
a need to bring the metrics at the same level. In this paper, aggregation using Average Absolute Deviation
(AAD) and Interquartile Range (IQR) are explored. We propose the method for aggregation of metrics from
class to package level for software fault prediction and validated the approach by performing experimental
analysis. We did the experimental study to analyze the performance of software fault prediction mechanism
when no aggregation technique was used and when the two mentioned aggregation techniques were used.
The experimental study revealed that the aggregation improved the performance and out of AAD and IQR
aggregation techniques, IQR performs relatively better.
1 INTRODUCTION
Software fault prediction mechanism predicts
whether the software module is faulty or not before
applying the testing mechanism. More testing efforts
are made in a module which is predicted as faulty as
compared to the one predicted as non faulty (Rathore
and Kumar, 2017). In many software systems like
banking, financial systems, medical systems, satellite
systems, etc., if any bug is left undetected then severe
damages can be caused. Hence, testing is indeed
very important phase in the development of such
software systems (Arar and Ayan, 2016). In cases of
inter-releases software fault prediction, the data from
the previous version of the software that is used for
training the classifier might not always be of same
granularity as that of the testing data, which can be
a major issue. The same scenario may also happen
in the cross project fault prediction. Thus, there is a
need to bring the metrics at the same level. In this
paper, the software metrics available at the class level
are aggregated to package level by computing the
AAD and IQR values of the metrics at the class level.
Generally, the metrics used for the fault pre-
diction mechanism are LOC (Line Of Codes), Mc-
Cabes metrics, Halsteads metrics, Chidamber and Ke-
merer(C&K) metrics, etc. (Honglei et al., 2009)
and the common machine learning techniques used
are naive bayes (Yang et al., 2017), (Turhan et al.,
2013), logistic regression (Arar and Ayan, 2016),
(Zhao et al., 2017), artificial neural network (Kumar
et al., 2017), (Erturk and Sezer, 2015), support vec-
tor machine (Erturk and Sezer, 2015), decision tree
(Ghotra et al., 2015), random forest (Kamei and Shi-
hab, 2016), etc. In this paper, three machine learn-
ing techniques have been used: logistic regression
(Arar and Ayan, 2016), (Zhao et al., 2017), support
vector machine (Erturk and Sezer, 2015) and deci-
sion tree (Ghotra et al., 2015). Four different perfor-
mance evaluation measures, i.e., accuracy, precision,
recall and F-measure (Arar and Ayan, 2016), (Turhan
et al., 2013), (Kumar et al., 2017), (Kamei and Shi-
hab, 2016) have been used for performance analysis.
Datasets from the publicly available PROMISE data
repository (Menzies et al., 2015) have been used for
experimentation.
Following are the contributions of our work:
• Use of Average Absolute Deviation (AAD) and
Interquartile Range (IQR) based aggregation for the
software metrics are explored. Mostly the aggrega-
tion techniques explored in different works in the field
of software fault prediction are sum, mean, median,
maximum, standard deviation, Gini index, Theil in-
dex, Atkinson index and Hoover index, while AAD
304
Dixit, D. and Kumar, S.
Investigating the Effect of Software Metrics Aggregation on Software Fault Prediction.
DOI: 10.5220/0006884003040311
In Proceedings of the 13th International Conference on Software Technologies (ICSOFT 2018), pages 304-311
ISBN: 978-989-758-320-9
Copyright © 2018 by SCITEPRESS – Science and Technology Publications, Lda. All rights reserved

and IQR have not yet been explored in this field.
• Aggregation of metrics directly from class level
to package level are presented.
• Experimental investigation is done to compare
fault prediction mechanism with and without apply-
ing aggregation technique.
• Performance of learning models, logistic regres-
sion, support vector machine and decision tree are
compared in both the scenarios, with and without ag-
gregation.
Following research questions can be answered
based upon the experimental results obtained in this
work:
RQ1: How does logistic regression, support vec-
tor machine, and decision tree based learning models
perform in without aggregation and with aggregation
scenarios?
RQ2: How does aggregation of metrics affect the
performance of software fault prediction?
RQ3: Out of AAD and IQR, which method of ag-
gregation for metrics produces better results with ref-
erence to software fault prediction ?
Rest of the paper is organized as follows. Section
2 presents the related work. Section 3 presents the
proposed methodology. Section 4 describes the ex-
perimental setup. The results and the corresponding
observations of the experiments conducted in this pa-
per are given in Section 5. Threats to validity are pre-
sented in Section 6, followed by conclusion in Section
7.
2 RELATED WORKS
(Zhang et al., 2017) addressed the problem of differ-
ence in granularity, i.e., the difference in the levels
at which software metrics are collected. They aggre-
gated the data metrics from method level to file level.
They analyzed eleven aggregation techniques on 255
open source projects. Experiments were conducted
using ten-fold cross validation technique. Four defect
prediction models were dealt with: defect proneness
model, defect rank model, defect count model and ef-
fort aware model. (Zimmermann et al., 2007) worked
on three releases of publicly available eclipse datasets
and mapped the packages and classes to the number
of bugs that were reported before and after the release.
They used version archives and bug tracking systems
to find the failed modules in the system. In the soft-
ware fault prediction mechanism, they computed the
metrics at method, class and file level and aggregated
them to higher levels, i.e., file and package level us-
ing average, total and maximum values of the metrics.
(Herzig, 2014) used summation, median, mean and
maximum value as the metric aggregation techniques
in software fault prediction mechanism in his work.
(Posnett et al., 2011) used summation while (Koru
and Liu, 2005) used minimum, maximum, summa-
tion and average for the aggregation of metrics in
software fault prediction in their works. According
to (Vasilescu et al., 2011), the software metrics are
generally collected at the micro level such as method,
class and package level. In order to have a view from
the macro level, i.e., system level, these metrics have
to be aggregated. In this paper, the traditional and
econometric aggregation techniques are studied to an-
alyze the correlations amongst them. (Serebrenik and
van den Brand, 2010) were the first to apply a fa-
mous econometric measure of inequality, Theil index,
in the field of software metric aggregation. Theil in-
dex has been used to get important insights in organ-
isation, software system evolution and in sources of
inequality. (Mordal-Manet et al., 2011) used mean,
(Walter et al., 2016) used mean, standard deviation,
Gini index, Theil index, Atkinson index, Kolm index,
Hoover index and mean logarithmic deviation while
(Ivan et al., 2015) used summation and product for
metric aggregation in software quality model. (Sanz-
Rodriguez et al., 2011) used weighted mean, the Cho-
quet integral and multiple linear regression for the ag-
gregation of metrics to analyze the effect of aggre-
gation in selecting the reusable educational materials
from repositories on the web. (Vasa et al., 2009) ap-
plied Gini index as the aggregation technique to study
the effect on the information the metrics give about
the software system. Most of these available works
present sum, mean, median, maximum, standard de-
viation, Gini index, Theil index, Atkinson index and
Hoover index as the aggregation methods and only a
few of them have used aggregation in software fault
prediction. However, to the best of our knowledge,
AAD and IQR aggregation methods have not been
explored so far for software fault prediction. Also,
most of the works present method to file level or file
to package level aggregation. In this paper, efforts
are done to present approach for aggregation of soft-
ware metrics from class to package level for software
fault prediction based on AAD and IQR techniques.
In addition, extensive experimental investigations are
performed using sixteen releases of eight datasets in
inter-releases scenario to analyze the effect of aggre-
gation on the performance of software fault predic-
tion.
Investigating the Effect of Software Metrics Aggregation on Software Fault Prediction
305
3 METHODOLOGY
In software metrics, there are various granularities
such as method level, class level, file level, package
level, etc. (Zimmermann et al., 2007), (Zimmermann
et al., 2009). In this paper, the metrics in the dataset
are aggregated from the class level to package level.
This section presents some basic terminologies and
the proposed method.
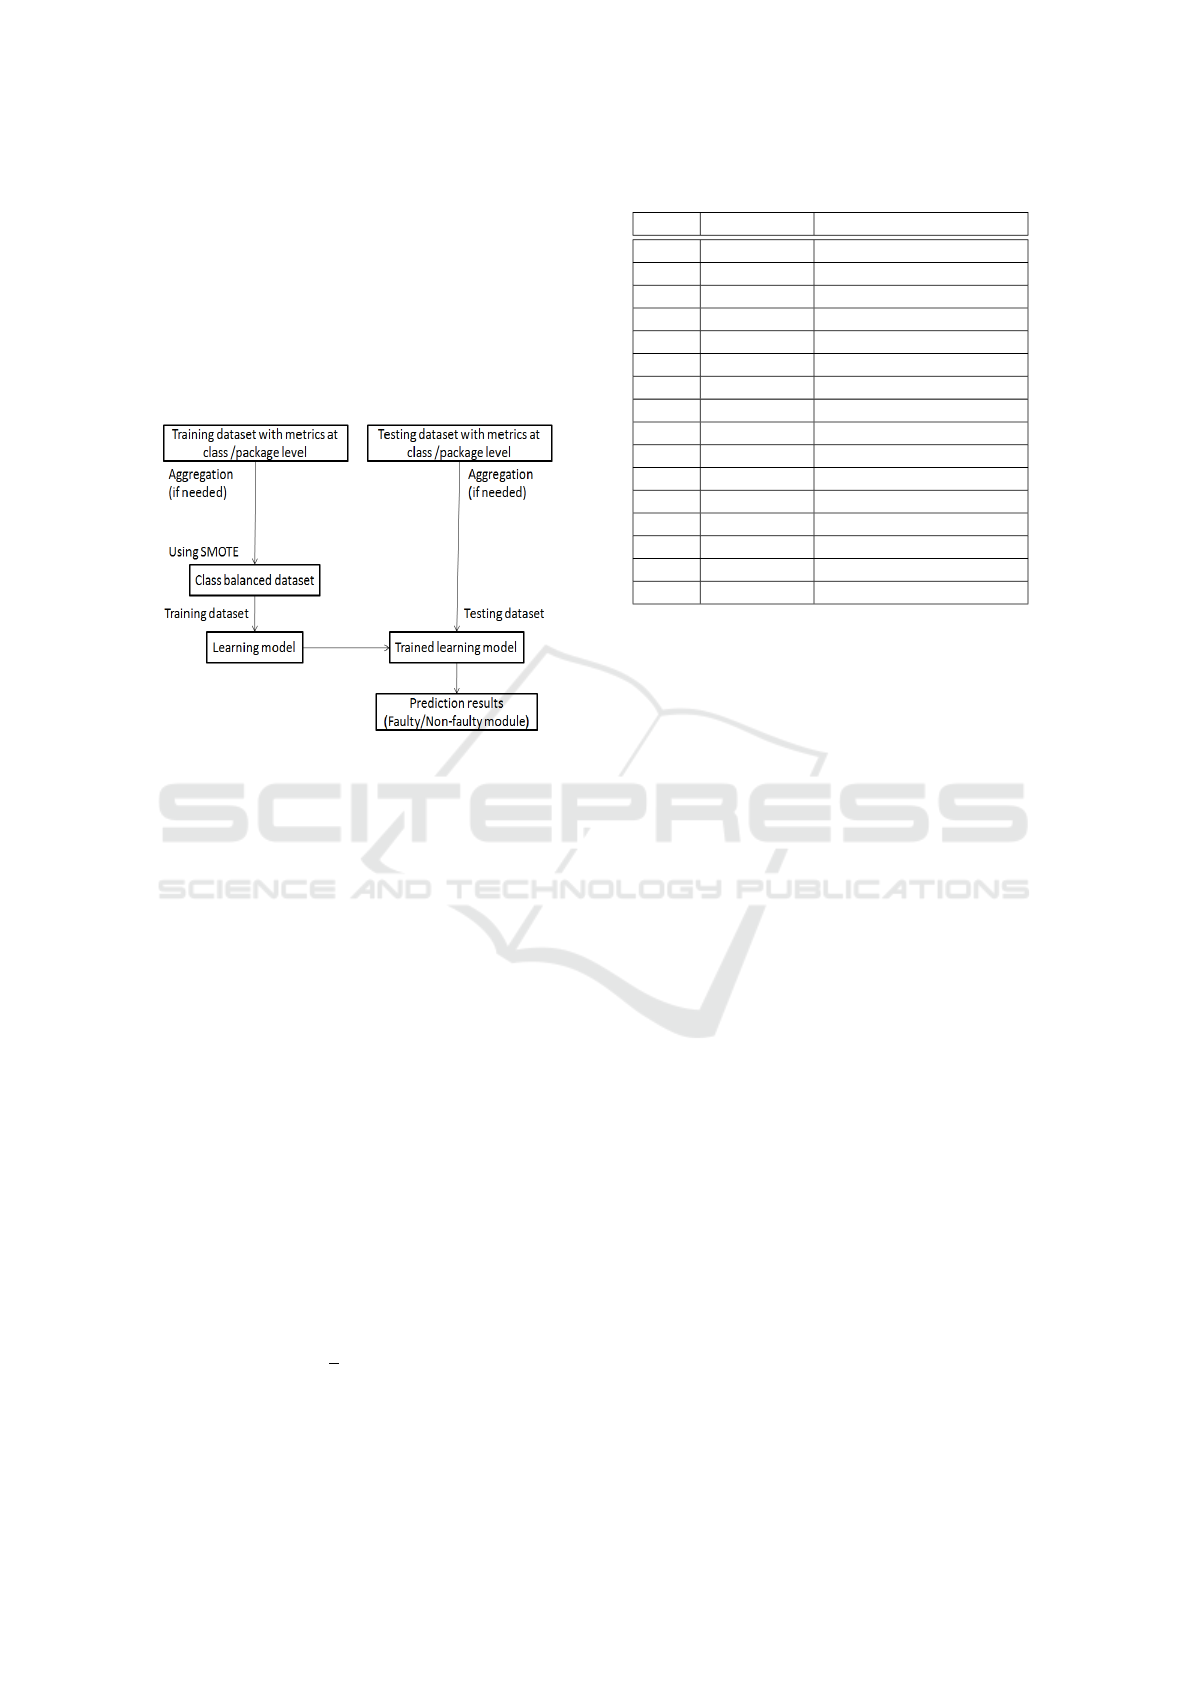
Figure 1: Our approach of fault prediction mechanism.
3.1 Use of Aggregation
In the inter-releases prediction and cross project fault
prediction, the granularity of training and testing
dataset metrics might not always be the same and
when they are needed to be brought at the same level,
then aggregation of the metrics can be used. In a par-
ticular package there exist several classes. The metric
values of all those classes which belong to the same
package are combined together by using aggregation
technique to give one value per metric for every pack-
age. It needs to be done for all the classes and pack-
ages. In this work, we have used the following aggre-
gation methods for analyzing their effect on the soft-
ware fault prediction performance:
3.1.1 Average Absolute Deviation
AAD depicts the average value of the absolute devi-
ations of a given set of values {x
1
, x
2
, ....x
n
} from a
central point. The central point is the average of the
given set of values.
AAD =
1
n
n
∑
i=1
|x
i
− A(X)| (1)
Where A(X) is the average of the set of values
{x
1
, x
2
, ....x
n
}.
Table 1: Overview of the datasets used.
S.No. Dataset No. of modules (classes)
1 ant 1.6 351
2 ant 1.7 745
3 camel 1.4 872
4 camel 1.6 965
5 ivy 1.4 241
6 ivy 2.0 352
7 poi 2.5 385
8 poi 3.0 442
9 synapse 1.1 222
10 synapse 1.2 256
11 velocity 1.5 214
12 velocity 1.6 229
13 xalan 2.5 803
14 xalan 2.6 885
15 xerces 1.3 453
16 xerces 1.4 588
3.1.2 Interquartile Range
IQR is a measure of statistical dispersion, which is the
difference between the third and the first quartile, for
a given set of values.
IQR = Q3 − Q1 (2)
Where Q3 is the third quartile and Q1 is the first quar-
tile.
3.2 Approach
Figure 1 shows the work flow of activities in the ap-
proach proposed in this paper. Following steps are
followed in the proposed approach:
Step1: For all the classes that belong to the same
package, the metric values are aggregated using ei-
ther of the two aggregation techniques proposed, i.e.,
AAD and IQR. The aggregation of metrics is done
from the class level to the closest level,i.e., lowest
level package.
Step2: Generally, in every software system, the
number of faulty modules is lesser than the num-
ber of non faulty modules, making the dataset imbal-
ance and thus leading to inaccurate fault prediction.
In order to deal with the class imbalance problem,
SMOTE ( Synthetic Minority Over-sampling Tech-
nique (Chawla et al., 2002)) is used in our work.
Step3: Earlier version of the dataset is used for
training and the later version is used for testing. Eight
pairs of training-testing datasets have been used in our
work.
Step4: Perform fault prediction mechanism using
the training and testing datasets, generated in previous
step.
ICSOFT 2018 - 13th International Conference on Software Technologies
306
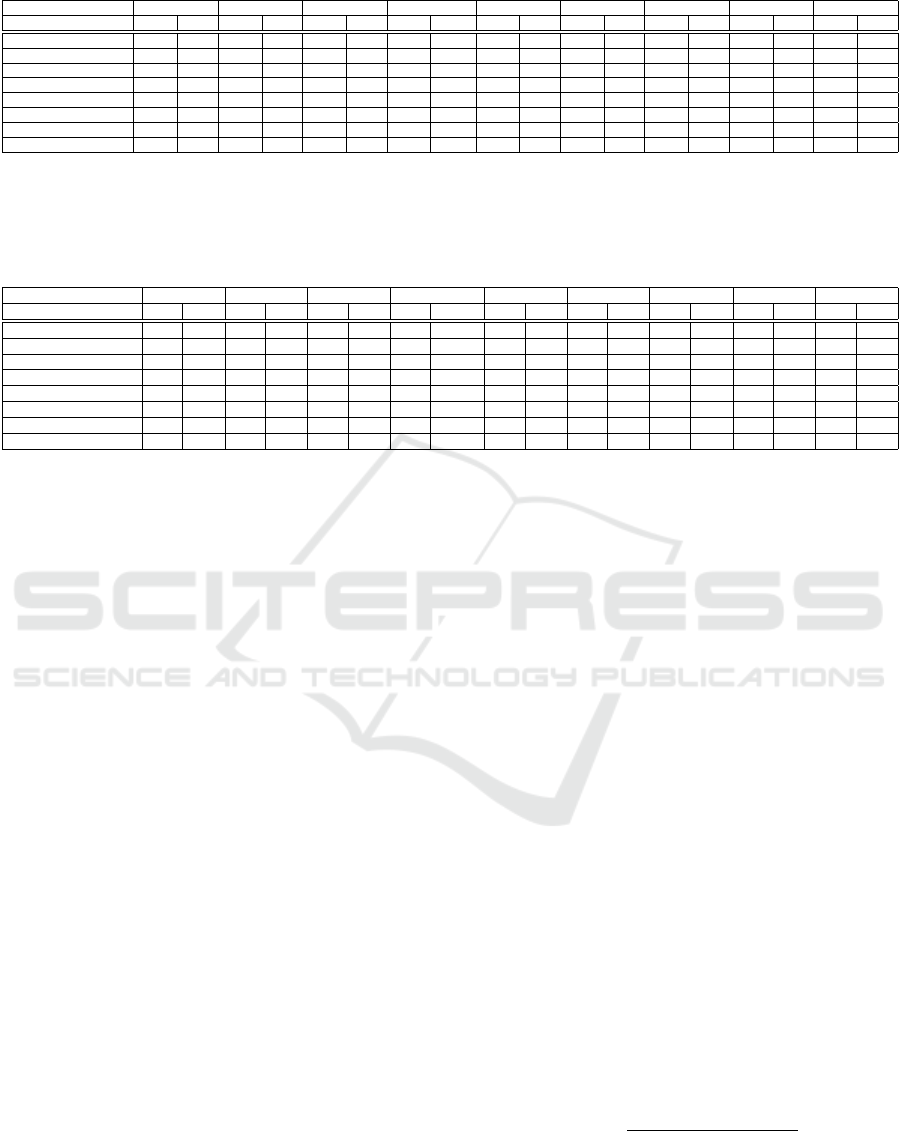
Table 2: Performance in terms of Accuracy % and Precision.
Training-Testing set LR w/o agg. LR AAD LR IQR SVM w/o agg. SVM AAD SVM IQR DT w/o agg. DT AAD DT IQR
Acc. Prec. Acc. Prec. Acc. Prec. Acc. Prec. Acc. Prec. Acc. Prec. Acc. Prec. Acc. Prec. Acc. Prec.
ant1.6-ant1.7 72.21 0.41 46.15 0.46 50 .5 73.69 0.44 70.14 0.63 64.17 0.58 75.57 0.46 67.16 0.63 62.68 0.62
camel1.4-camel1.6 60.62 0.25 85.6 0.69 80.8 0.63 70.56 0.33 87.2 0.73 88 0.74 77.92 0.42 81.6 0.64 84.8 0.72
ivy1.4-ivy2.0 77.27 0.06 73.07 0.61 57.69 0.42 77.55 0.13 61.53 0.45 71.15 0.75 82.67 0.2 59.61 0.41 61.53 0.46
poi2.5-poi3.0 66.28 0.75 80 1 50 1 62.89 0.73 70 0.86 90 1 41.4 0.61 80 0.88 90 1
synapse1.1-synapse1.2 62.89 0.45 57.57 0.66 39.39 0.46 63.28 0.45 57.57 0.63 60.60 0.66 69.53 0.55 54.54 0.61 54.54 0.62
velocity1.5-velocity1.6 61.13 0.45 60 0.77 68 0.88 55.89 0.42 84 0.82 92 0.88 57.2 0.42 88 0.83 80 0.81
xalan2.5-xalan2.6 56.38 0.53 69.04 0.93 61.9 0.95 67.79 0.64 73.8 0.9 69.04 0.93 57.85 0.54 83.33 0.91 80.95 0.91
xerces1.3-xerces1.4 47.61 0.9 60.52 1 63.15 1 50.34 0.91 73.68 1 76.31 1 39.45 0.87 68.42 1 76.31 1
* LR w/o agg.=Logistic Regression without aggregation, LR AAD=Logistic Regression with Average Absolute Deviation, LR IQR=Logistic Regression with Interquartile Range, SVM
w/o agg.=Support Vector Machine without aggregation, SVM AAD=Support Vector Machine with Average Absolute Deviation, SVM IQR=Support Vector Machine with Interquartile
Range, DT w/o agg.=Decision Tree without aggregation, DT AAD=Decision Tree with Average Absolute Deviation, DT IQR=Decision Tree with Interquartile Range, Acc.=Accuracy
,Prec.=Precision.
Table 3: Performance in terms of Recall and F-measure.
Training-Testing set LR w/o agg. LR AAD LR IQR SVM w/o agg. SVM AAD SVM IQR DT w/o agg. DT AAD DT IQR
Rec. F-m. Rec. F-m. Rec. F-m. Rec. F-m. Rec. F-m. Rec. F-m. Rec. F-m. Rec. F-m. Rec. F-m.
ant1.6-ant1.7 0.63 0.5 1 0.63 1 0.66 0.67 0.53 0.83 0.72 0.8 0.67 0.58 0.51 0.67 0.65 0.48 0.54
camel1.4-camel1.6 0.52 0.34 0.85 0.76 0.7 0.66 0.52 0.4 0.82 0.77 0.85 0.79 0.4 0.41 0.7 0.67 0.7 0.71
ivy1.4-ivy2.0 0.07 0.06 0.68 0.65 0.42 0.42 0.17 0.15 0.26 0.33 0.31 0.44 0.17 0.18 0.26 0.32 0.31 0.37
poi2.5-poi3.0 0.69 0.72 0.76 0.86 0.41 0.58 0.64 0.68 0.76 0.81 0.88 0.93 0.21 0.31 0.88 0.88 0.88 0.93
synapse1.1-synapse1.2 0.52 0.48 0.52 0.58 0.31 0.37 0.44 0.44 0.63 0.63 0.63 0.64 0.45 0.5 0.57 0.59 0.52 0.57
velocity1.5-velocity1.6 0.73 0.56 0.46 0.58 0.53 0.66 0.78 0.54 0.93 0.87 1 0.93 0.76 0.55 1 0.9 0.86 0.83
xalan2.5-xalan2.6 0.43 0.48 0.71 0.8 0.6 0.74 0.67 0.66 0.78 0.84 0.71 0.8 0.61 0.57 0.89 0.9 0.86 0.89
xerces1.3-xerces1.4 0.33 0.48 0.51 0.68 0.54 0.7 0.36 0.52 0.67 0.8 0.7 0.83 0.21 0.34 0.61 0.76 0.7 0.83
* LR w/o agg.=Logistic Regression without aggregation, LR AAD=Logistic Regression with Average Absolute Deviation, LR IQR=Logistic Regression with Interquartile Range, SVM
w/o agg.=Support Vector Machine without aggregation, SVM AAD=Support Vector Machine with Average Absolute Deviation, SVM IQR=Support Vector Machine with Interquartile
Range, DT w/o agg.=Decision Tree without aggregation, DT AAD=Decision Tree with Average Absolute Deviation, DT IQR=Decision Tree with Interquartile Range, Rec.=Recall,
F-m.=F-measure.
4 EXPERIMENTAL SETUP
We have used sixteen releases of datasets (8 projects,
each with two releases) from the PROMISE data
repository (Menzies et al., 2015) for experimentation.
The earlier release of a dataset is used for training pur-
pose to predict the fault proneness for the later release
that is used as testing dataset. There are eight pairs of
training-testing datasets in our experiments. Table 1
provides the details of the used datasets.
Various software metrics in the dataset are:
Weighted methods per class (WMC), Depth of In-
heritance Tree (DIT), Number of Children (NOC),
Coupling between object classes (CBO), Response
for a Class (RFC), Lack of cohesion in methods
(LCOM), Lack of cohesion in methods (LCOM3),
Number of Public Methods (NPM), Data Access Met-
ric (DAM), Measure of Aggregation (MOA), Measure
of Functional Abstraction (MFA), Cohesion Among
Methods of Class (CAM), Inheritance Coupling (IC),
Coupling Between Methods (CBM), Average Method
Complexity (AMC), Afferent couplings (Ca), Effer-
ent couplings (Ce), Maximum McCabes cyclomatic
complexity (Max CC), Average McCabes cyclomatic
complexity (Avg CC) and Lines of Code (LOC).
All the implementations in this work have been
done using the R programming language version
3.4.0. It is widely used in data analysis and software
fault predictions.
Three machine learning techniques have been
used for the experimentation: logistic regression
(Arar and Ayan, 2016), (Zhao et al., 2017), support
vector machine (Erturk and Sezer, 2015) and decision
tree (Ghotra et al., 2015).
4.1 Performance Evaluation Measures
Used
In binary classification of fault prediction, if in a
package, even a single faulty class is present then that
package is declared to be faulty otherwise non faulty
(Zhao et al., 2017), (Zimmermann et al., 2007), (Zhou
and Leung, 2006). This concept has been used for
calculation of values of performance measures. Four
different performance evaluation measures have been
used as discussed below:
Accuracy: It denotes the percentage of correctly clas-
sified instances to the total number of instances.
Accuracy =
T P + T N
T P + T N + FP + FN
∗ 100 (3)
Precision: It denotes the number of correctly classi-
fied faulty instances amongst the total number of in-
stances classified as faulty.
Investigating the Effect of Software Metrics Aggregation on Software Fault Prediction
307

Precision =
T P
T P + FP
(4)
Recall: It denotes the number of correctly classified
faulty instances amongst the total number of instances
which are faulty.
Recall =
T P
T P + FN
(5)
F-measure: It denotes the harmonic mean of the pre-
cision and recall values.
F − measure =
2 ∗ precision ∗ recall
precision + recall
(6)
Where TP represents True Positive, FP represents
False Positive, TN represents True Negative and FN
represents False Negative.
5 EXPERIMENTAL RESULTS
AND ANALYSIS
In this section, firstly, we have presented the exper-
imental results and then the observations obtained
from the analysis of these results have been presented.
Initially, the experiments are performed using LR,
SVM and DT for inter-releases fault prediction on
class level datasets without applying aggregation.
Then, AAD and IQR aggregation methods are ap-
plied on each of the datasets for metric aggregation
from the class level to package level and LR, SVM,
and DT are used for prediction on the aggregated
datasets. Table 2 shows the performance in terms of
accuracy and precision for these experiments and per-
formance in terms of recall and F-measure is shown
in Table 3. Comparative analysis of performance of
LR, SVM, and DT without using aggregation to corre-
sponding performance on applying aggregation meth-
ods in terms of F-measure are shown in Figure 2, Fig-
ure 3, and Figure 4 respectively.
Following observations are drawn on analyzing
the results:
• From Table 2, it can be seen that DT performs
better than the other two classifiers in 50% cases, both
in terms of accuracy and precision when no aggrega-
tion is used. From Table 3, it is observed that SVM
performs better than other two classifiers in 75% cases
in terms of recall, while in terms of F-measure, both
SVM and DT came out to be the best, in 37.5% cases,
when no aggregation is used.
• When AAD is used for aggregation, it can be
seen from Table 2 that SVM performs better than
the other two classifiers in 50% cases, in terms of
accuracy, while LR performs better than the other
two classifiers in 62.5% cases, in terms of precision.
When AAD is used for aggregation, it can be seen
from Table 3 that LR and DT gave the best results ,i.e.,
both in 37.5% cases in terms of recall, while SVM
performs better than the other two classifiers in 50%
cases in terms of F-measure.
• When IQR is used for aggregation, it can be seen
from Table 2 that SVM performs better than the other
two classifiers in 87.5% and 75%cases in terms of ac-
curacy and precision respectively. It can be seen from
Table 3 that SVM performs better than the other two
classifiers in 62.5% and 87.5%cases in terms of recall
and F-measure respectively.
• From Table 2, 3 and Figure 2, 3, 4, it is observed
that for all the learning models, prediction after apply-
ing aggregation shows better performance for most of
the datasets as compared to the case when no aggre-
gation is applied. Out of eight pairs of datasets, in al-
most all the pairs of datasets, either aggregation using
AAD or IQR performs better than the learning models
without applying aggregation in terms of precision,
recall and F-measure for all of the three used classi-
fiers. In terms of accuracy, in five out of eight pairs
of datasets, using either AAD or IQR for aggregation
performs better than the learning models without ap-
plying aggregation for all of the three used classifiers.
• From Table 2 and 3 it is observed that aggre-
gation using IQR shows better performance as com-
pared to aggregation using AAD in terms of accuracy,
precision, recall and F-measure, when SVM classi-
fier is used. Aggregation using IQR shows better per-
formance as compared to aggregation using AAD in
terms of accuracy and precision and shows an equiv-
alent performance in terms of F-measure, when DT
classifier is used.
Table 4 shows the comparative analysis of the pre-
sented work with the existing similar works. From
Table 4, it can be seen that the aggregation techniques
AAD and IQR show performance values in the com-
parable and even better range as the other aggregation
techniques explored so far.
Based on the results obtained from the experi-
ments conducted, following research questions can be
answered:
RQ1: How does LR, SVM, and DT based learn-
ing models perform in without aggregation and with
aggregation scenarios?
It is observed that these three learning models per-
form well in both scenarios. However, the perfor-
mance is improved on using the aggregation for all
three learning models.
RQ2: How does aggregation of metrics affect the
performance of software fault prediction?
ICSOFT 2018 - 13th International Conference on Software Technologies
308
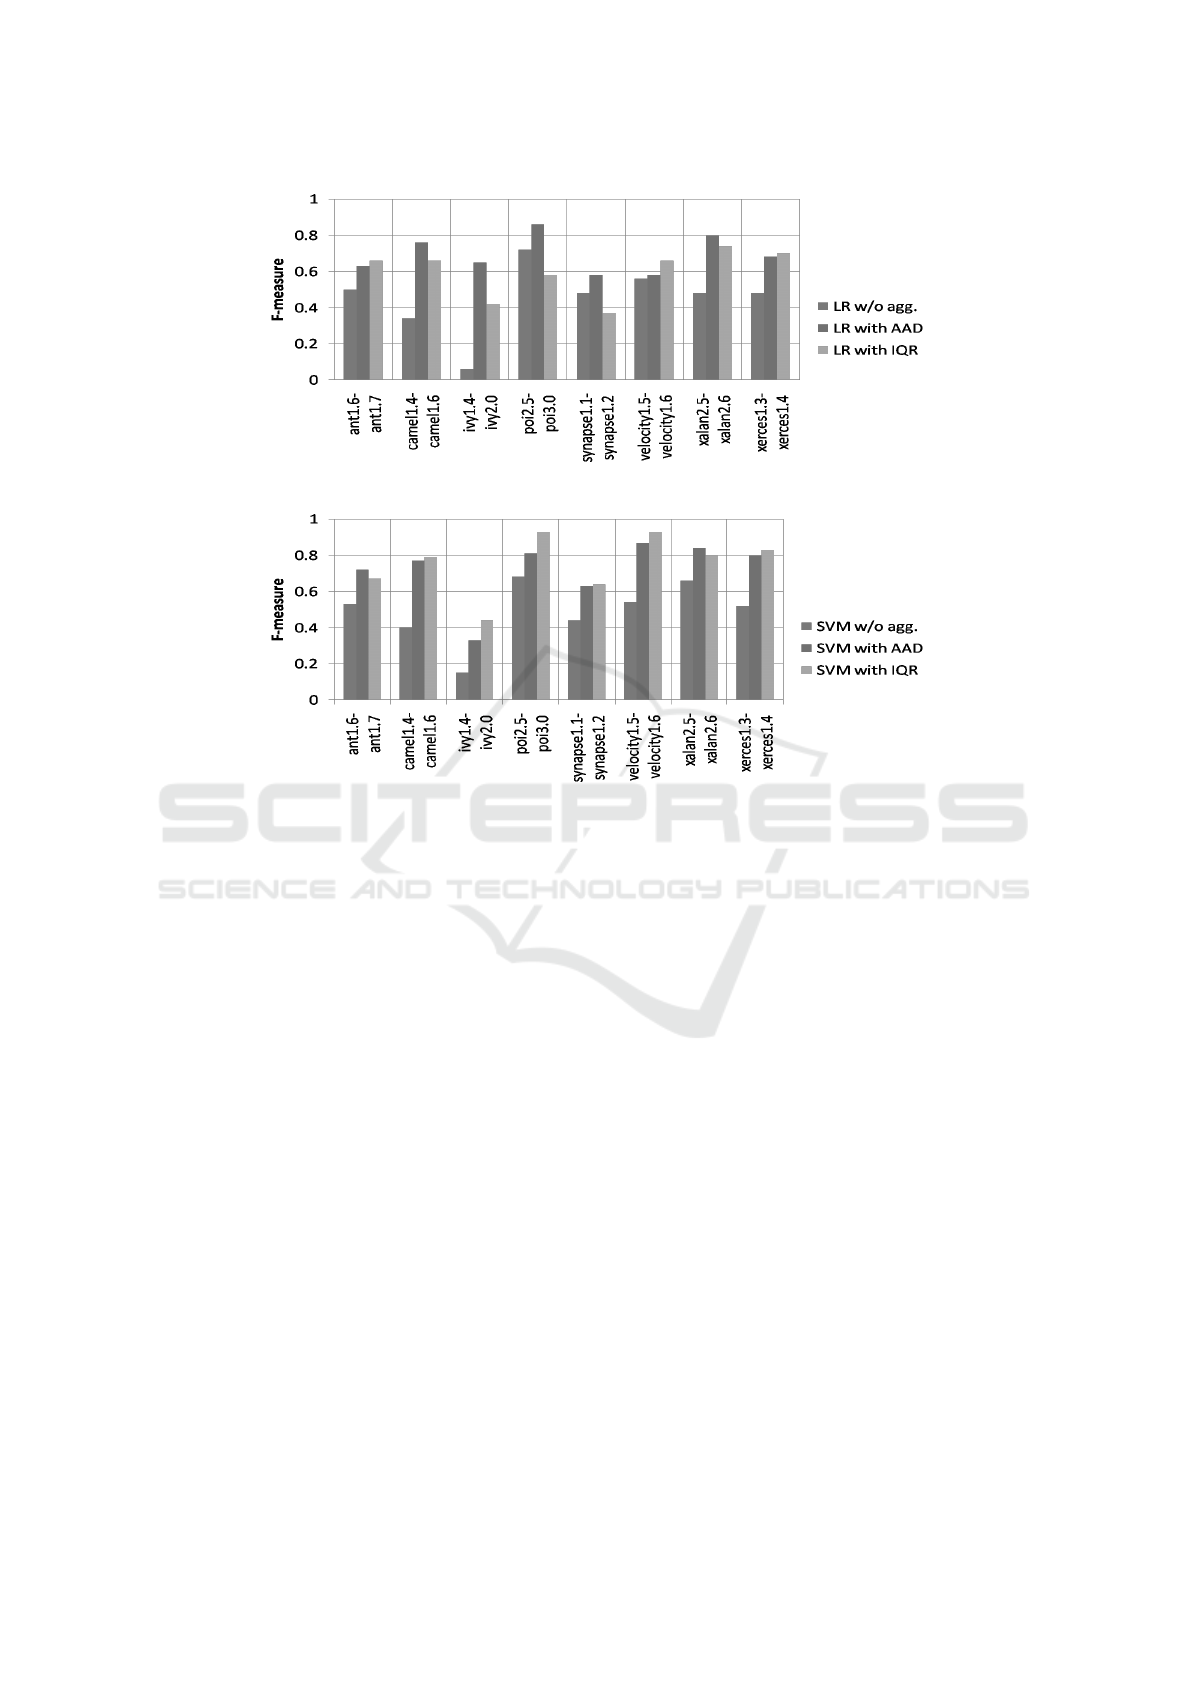
Figure 2: Comparative analysis of performance of LR.
Figure 3: Comparative analysis of performance of SVM.
It is observed from the analysis of experimental
results that the performance of software fault predic-
tion is comparable and even improved in all the sce-
narios under consideration after applying the aggre-
gation of metrics. It shows that if granularity levels
of training datasets and testing datasets are different,
then aggregation can be applied in these datasets to
make them reach same level of granularity and fault
prediction can be performed with acceptable results.
RQ3: Out of AAD and IQR, which method of ag-
gregation for metrics produces better results with ref-
erence to software fault prediction ?
IQR method of aggregation has produced better
results as compared to AAD method of aggregation
in majority of the scenarios under consideration, with
reference to software fault prediction.
6 THREATS TO VALIDITY
In this section, we have presented some possible
threats that may affect the results shown in experi-
mentation.
Internal validity : In this work, we performed
experimentation in inter-releases prediction. Exper-
imentation in different scenario or using different
learning models and different aggregation methods
may produce different results.
External validity : We leveraged different types of
open source software fault datasets of PROMISE data
repository to validate the proposed fault prediction
model using aggregation. The performance might get
affected by some industrial software fault datasets.
Conclusion validity : SMOTE method is used to
balance all imbalanced datasets. Other types of nor-
malization techniques can be used for normalization
of fault datasets and may affect the results.
7 CONCLUSIONS
In this paper, two aggregation methods, Average
Absolute Deviation (AAD) and Interquartile Range
(IQR), for aggregation of software metrics from class
level to package level are investigated for their ef-
fect on the software fault prediction. Aggregation
may need to be performed in inter-releases and cross
project prediction scenarios where the granularity of
the training dataset and the target testing dataset is of
different level. From the experimental analysis, it is
observed that the performance of software fault pre-
diction is comparable or even improved after apply-
Investigating the Effect of Software Metrics Aggregation on Software Fault Prediction
309
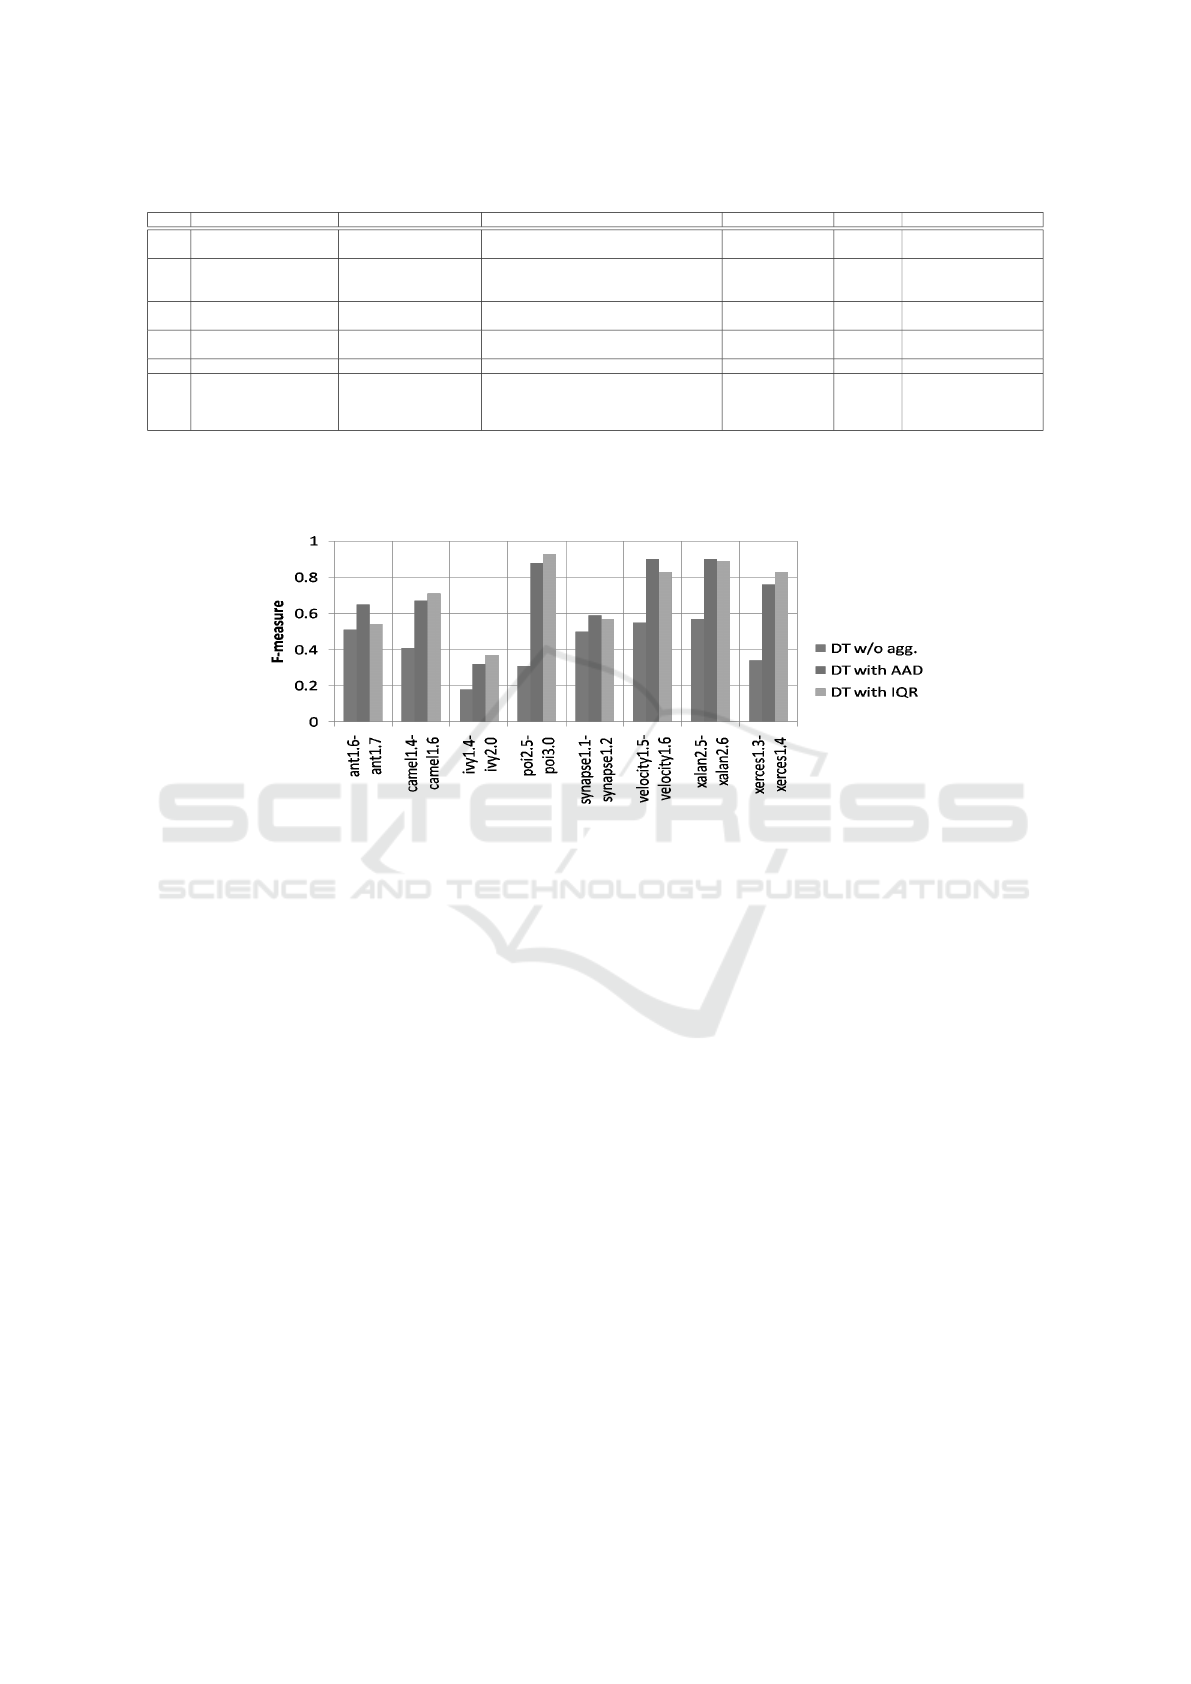
Table 4: A Comparative study of previous similar works with our work.
S.No. Work Reference Classifier(s) Agg. Tech. Agg. Level P.E.M. Range (Min.-Max. value)
1 Zhang et al., (2017) RF
All schemes, Sum,Mean,Median,SD,COV,
Gini,Hoover,Atkinson,Shannon,Entropy,Theil
Method to File AUC 0.55-1 !
2 Zimmermann et al., (2007) LR Average,Sum,Maximum
Method,Class&File
to File&Package
Accuracy
Precision
Recall
61.2-78.9%
0.453-0.785
0.185-0.789
3 Herzig, (2014) MLR,RP,NB,RF,SVM,TP Sum,Maximum,Mean,Median
various levels to
Binary&File level
Precision
Recall
0.29-0.81
0.12-0.70
4 Posnett et al., (2011) LR Sum File to Package
AUC ROC
AUC CE
0.65-1
0.41-0.99
5 Koru and Liu, (2005) DT Minimum,Maximum,Sum,Average Method to Class F-measure 0-0.76
6 Our work LR,SVM,DT AAD,IQR Class to Package
Accuracy
Precision
Recall
F-measure
39.39-92%
0.41-1
0.26-1
0.32-0.93
* Agg.Tech.=Aggregation Technique, Agg. Level=Aggregation Level, P.E.M.=Performance Evaluation Measure, SD=Standard Deviation, COV=Coefficient of Variation, AUC=Area Un-
der Curve,RF=Random Forest, LR=Logistic Regression, MLR=Multinomial Logistic Regression, RP=Recursive Partitioning, NB=Naive Bayes, SVM=Support Vector Machine, TP=Tree
Bagging, DT=Decision Tree, AUC ROC=Area Under Curve Receiver Operating Characteristic, AUC CE=Area Under Curve Cost Effectiveness, AAD=Average Absolute Deviation,
IQR=Interquartile Range.
!: Minimum-Maximum range for best aggregation technique.
Figure 4: Comparative analysis of performance of DT.
ing the aggregation of metrics. Out of AAD and IQR
methods of aggregation, better performance for soft-
ware fault prediction is found for IQR. In future, at-
tempts will be made to design new aggregation meth-
ods to get better prediction results.
ACKNOWLEDGEMENT
This publication is an outcome of the R&D work
undertaken in the project under the Visvesvaraya
PhD Scheme of Ministry of Electronics & Informa-
tion Technology, Government of India, being imple-
mented by Digital India Corporation (formerly Media
Lab Asia).
REFERENCES
Arar,
¨
O. F. and Ayan, K. (2016). Deriving thresholds of
software metrics to predict faults on open source soft-
ware: Replicated case studies. Expert Systems with
Applications, 61:106–121.
Chawla, N. V., Bowyer, K. W., Hall, L. O., and Kegelmeyer,
W. P. (2002). Smote: synthetic minority over-
sampling technique. Journal of artificial intelligence
research, 16:321–357.
Erturk, E. and Sezer, E. A. (2015). A comparison of some
soft computing methods for software fault prediction.
Expert Systems with Applications, 42(4):1872–1879.
Ghotra, B., McIntosh, S., and Hassan, A. E. (2015). Re-
visiting the impact of classification techniques on the
performance of defect prediction models. In Proceed-
ings of the 37th International Conference on Software
Engineering-Volume 1, pages 789–800. IEEE Press.
Herzig, K. (2014). Using pre-release test failures to build
early post-release defect prediction models. In 2014
IEEE 25th International Symposium on Software Re-
liability Engineering (ISSRE), pages 300–311. IEEE.
Honglei, T., Wei, S., and Yanan, Z. (2009). The research
on software metrics and software complexity metrics.
In Computer Science-Technology and Applications,
2009. IFCSTA’09. International Forum on, volume 1,
pages 131–136. IEEE.
Ivan, I., Zamfiroiu, A., Doinea, M., and Despa, M. L.
(2015). Assigning weights for quality software
metrics aggregation. Procedia Computer Science,
55:586–592.
Kamei, Y. and Shihab, E. (2016). Defect prediction: Ac-
complishments and future challenges. In Software
Analysis, Evolution, and Reengineering (SANER),
2016 IEEE 23rd International Conference on, vol-
ume 5, pages 33–45. IEEE.
Koru, A. G. and Liu, H. (2005). Building effective
ICSOFT 2018 - 13th International Conference on Software Technologies
310

defect-prediction models in practice. IEEE software,
22(6):23–29.
Kumar, L., Misra, S., and Rath, S. K. (2017). An empirical
analysis of the effectiveness of software metrics and
fault prediction model for identifying faulty classes.
Computer Standards & Interfaces, 53:1–32.
Menzies, T., Krishna, R., and Pryor, D. (2015). The
promise repository of empirical software engineering
data (2015).
Mordal-Manet, K., Laval, J., Ducasse, S., Anquetil, N., Bal-
mas, F., Bellingard, F., Bouhier, L., Vaillergues, P.,
and McCabe, T. J. (2011). An empirical model for
continuous and weighted metric aggregation. In 2011
15th European Conference on Software Maintenance
and Reengineering (CSMR), pages 141–150. IEEE.
Posnett, D., Filkov, V., and Devanbu, P. (2011). Eco-
logical inference in empirical software engineering.
In Proceedings of the 2011 26th IEEE/ACM Interna-
tional Conference on Automated Software Engineer-
ing, pages 362–371. IEEE Computer Society.
Rathore, S. S. and Kumar, S. (2017). Linear and non-linear
heterogeneous ensemble methods to predict the num-
ber of faults in software systems. Knowledge-Based
Systems, 119:232–256.
Sanz-Rodriguez, J., Dodero, J. M., and Sanchez-Alonso, S.
(2011). Metrics-based evaluation of learning object
reusability. Software Quality Journal, 19(1):121–140.
Serebrenik, A. and van den Brand, M. (2010). Theil index
for aggregation of software metrics values. In Soft-
ware Maintenance (ICSM), 2010 IEEE International
Conference on, pages 1–9. IEEE.
Turhan, B., Mısırlı, A. T., and Bener, A. (2013). Empiri-
cal evaluation of the effects of mixed project data on
learning defect predictors. Information and Software
Technology, 55(6):1101–1118.
Vasa, R., Lumpe, M., Branch, P., and Nierstrasz, O. (2009).
Comparative analysis of evolving software systems
using the gini coefficient. In 2009 IEEE International
Conference on Software Maintenance (ICSM), pages
179–188. IEEE.
Vasilescu, B., Serebrenik, A., and van den Brand, M.
(2011). You can’t control the unfamiliar: A study
on the relations between aggregation techniques for
software metrics. In 2011 27th IEEE International
Conference on Software Maintenance (ICSM), pages
313–322. IEEE.
Walter, B., Wolski, M., Prominski, P., and Kupi
´
nski, S.
(2016). One metric to combine them all: experimen-
tal comparison of metric aggregation approaches in
software quality models. In Software Measurement
and the International Conference on Software Pro-
cess and Product Measurement (IWSM-MENSURA),
2016 Joint Conference of the International Workshop
on, pages 159–163. IEEE.
Yang, X., Lo, D., Xia, X., and Sun, J. (2017). Tlel: A two-
layer ensemble learning approach for just-in-time de-
fect prediction. Information and Software Technology,
87:206–220.
Zhang, F., Hassan, A. E., McIntosh, S., and Zou, Y. (2017).
The use of summation to aggregate software metrics
hinders the performance of defect prediction mod-
els. IEEE Transactions on Software Engineering,
43(5):476–491.
Zhao, Y., Yang, Y., Lu, H., Liu, J., Leung, H., Wu, Y., Zhou,
Y., and Xu, B. (2017). Understanding the value of
considering client usage context in package cohesion
for fault-proneness prediction. Automated Software
Engineering, 24(2):393–453.
Zhou, Y. and Leung, H. (2006). Empirical analysis of
object-oriented design metrics for predicting high and
low severity faults. IEEE Transactions on software
engineering, 32(10):771–789.
Zimmermann, T., Nagappan, N., Gall, H., Giger, E., and
Murphy, B. (2009). Cross-project defect prediction: a
large scale experiment on data vs. domain vs. process.
In Proceedings of the the 7th joint meeting of the Eu-
ropean software engineering conference and the ACM
SIGSOFT symposium on The foundations of software
engineering, pages 91–100. ACM.
Zimmermann, T., Premraj, R., and Zeller, A. (2007). Pre-
dicting defects for eclipse. In Proceedings of the third
international workshop on predictor models in soft-
ware engineering, page 9. IEEE Computer Society.
Investigating the Effect of Software Metrics Aggregation on Software Fault Prediction
311
