
Localization of Visitors for Cultural Sites Management
F. Ragusa
1
, L. Guarnera
1
, A. Furnari
1
, S. Battiato
1
, G. Signorello
2
and G. M. Farinella
1,2
1
DMI - IPLab, University of Catania, Catania, Italia
2
CUTGANA, University of Catania, Italia
Keywords:
Localization, Video Summarization, Egocentric Vision, First Person Vision, Temporal Video Segmentation,
Cultural Heritage.
Abstract:
We consider the problem of localizing visitors in a museum from egocentric (first person) images. Localization
information can be useful to both assist the user during his visit (e.g., by suggesting where to go and what to
see next) and to provide behavioral information to the manager of the museum (e.g., how much time has been
spent by visitors at a given location?). To address the problem, we have considered a dataset of egocentric
videos acquired using two cameras: a head-mounted HoloLens and a chest-mounted GoPro. We performed
experiments exploiting a state-of-the-art method for room-based temporal segmentation of egocentric videos.
Experiments pointed out that compelling information can be extracted to serve both the visitors and the site-
manager. A web interface has been developed to provide a tool useful to manage the cultural site and to
perform analysis of the videos acquired by visitors. Also a digital summary is generated as additional service
for the visitors providing “sharable” memories of their experience.
1 INTRODUCTION
Museums and cultural sites receive lots of visitors ev-
ery day. To improve the fruition of cultural goods, a
site manager should provide tools to assist the visitors
during their tours so that they can get information on
what they are observing and what to see next. Also,
museum managers have to gather information to un-
derstand the behaviour of the visitors (e.g., what has
been liked most) in order to obtain suggestions on the
path to follow during a tour or to better perform the
placement of artworks. Traditional systems are un-
suitable to acquire information useful to understand
the visitor’s habits or interests. To collect such vis-
itors’data in an automated way (i.e., what they have
seen and where they have been), past works have em-
ployed fixed cameras and classic third person vision
algorithms to detect, track, count visitors and to es-
timate their gaze (Bartoli et al., 2015). As inves-
tigated by other authors (Colace et al., 2014; Cuc-
chiara and Del Bimbo, 2014; Seidenari et al., 2017;
Taverriti et al., 2016), wearable devices equipped with
a camera such as smart glasses (e.g., Google Glass,
Microsoft HoloLens and Magic Leap) offer interest-
ing opportunities to develop the aforementioned tech-
nologies and services for visitors and site managers.
In particular, a wearable system in this application
domain should be able to carry out at least the fol-
lowing tasks: 1) localize the visitor at any moment of
the visit, 2) recognize the cultural goods observed by
the visitor, 3) estimate the visitor’s attention, 4) pro-
file the user, 5) recommend what to see next. In this
work, we present a wearable system able to collect
information useful for the site management. We con-
centrate on the problem of room-based localization of
visitors in cultural sites from egocentric visual data
and on the development of a tool for the site manager
which can be used to perform the analysis of where a
visitor has spent time. The proposed system allows to
create a summary of the visits that can be given as a
gift to the visitors so they can share the summary of
the visit with others. The problem has been exploited
by employing a dataset of egocentric videos acquired
at the “Monastero dei Benedettini”, which is an UN-
ESCO World Heritage Site located in Catania, Italy.
The dataset has been acquired with two different de-
vices and contains more than 4 hours of video (Ra-
gusa et al., 2018). To improve the knowledge about
the visitors for a site manager and to help him to un-
derstand where the visitors go during their visits and
how much time they spend in each room, we have
developed a web tool with a simple Graphical User
Interface which is able to summarize each visit.
The reminder of the paper is organized as follows.
Section 2 briefly summarizes the dataset considered
in this work. The algorithm to perform room-based
Ragusa, F., Guarnera, L., Furnari, A., Battiato, S., Signorello, G. and Farinella, G.
Localization of Visitors for Cultural Sites Management.
DOI: 10.5220/0006886404070413
In Proceedings of the 15th International Joint Conference on e-Business and Telecommunications (ICETE 2018) - Volume 1: DCNET, ICE-B, OPTICS, SIGMAP and WINSYS, pages 407-413
ISBN: 978-989-758-319-3
Copyright © 2018 by SCITEPRESS – Science and Technology Publications, Lda. All rights reserved
407

localization of visitors in a cultural site is discussed in
Section 3. Section 4 reports the experimental results,
whereas the graphical user interface to allow the site
manager to analyze the processed egocentric videos,
as well as the web module useful to generate mem-
ories for the visitors is presented in Section 5. We
conclude the paper with hints for future works in Sec-
tion 6.
2 VEDI DATASET
The dataset used in this work (UNICT-VEDI)
is publicy available for research purposes at
http://iplab.dmi.unict.it/VEDI. The dataset has been
acquired using two wearable devices: Microsoft
Hololens and a chest mounted GoPro Hero4. The two
devices have been used simultaneously to acquire the
whole dataset. Each frame of the videos is labelled
according to two levels: 1) the location of the visi-
tor and 2) the “point of interest”, i.e. cultural good
of interest currently observed by the visitor, if any.
Both labelling levels allow for a “negative” class (i.e.,
frames containing visual information which is not of
interest). The dataset contains samples of a total of 9
environments and 56 points of interests. Some frames
related to the 9 environments are shown in Figure 1.
3 METHOD
To address the localization task, we follow the ap-
proach proposed by (Furnari et al., 2018) that is com-
posed by three main steps: Discrimination, Rejec-
tion, Sequential Modelling, which are summarized
in Figure 2. We trained the system considering the
dataset summarized in Section 2 to perform tempo-
ral segmentation with respect to the 9 locations. Per-
formances have been measured considering frame-
based (FF
1
) and segment-based (ASF
1
) F
1
scores (see
(Furnari et al., 2018) for more details).
To exploit the method in (Furnari et al., 2018), we
defined a set of M = 9 positive classes (y
i
∈ 1, ..., 9)
that corresponds to the 9 considered environments.
We train the method using training videos collected
at each of the 9 considered locations.
At testing time, the input of the algorithm is an
egocentric video V = {F
1
, . . . , F
N
} composed by N
frames F
i
. We assume that each input frame belongs
to one of the M positive classes or none of them (“neg-
ative class”). The output is a set of L video segments
S = {s
i
}
1≤i≤L
, each associated with one of the M
considered classes defined or to the “negative class”.
Some details of the three steps are given in the fol-
lowing.
3.1 Discrimination
In this phase, a multi-class classifier based on deep
learning is trained only on positive samples. For each
frame F
i
, we aim at estimating the class y
i
belonging
to the M positive classes. We consider the posterior
probability distribution obtained with the multi-class
classifier:
P(y
i
|F
i
, y
i
6= 0) (1)
where y
i
6= 0 denotes that the “negative class” is ex-
cluded from this probability distribution. We classify
each frame using the Maximum a Posteriori (MAP)
criterion obtaining the most probable class y
∗
i
for each
frame F
i
.
3.2 Negative Rejection
This step aims at recognizing the frames that contain
noise caused by fast head movements and by transi-
tion between two environments. These frames rep-
resent the “negative class”. The multi-class classifier
trained in the Discrimination step has no knowledge
of the “negative class”. Given this consideration, we
set a neighborhood of size K centered at frame F
i
to
be classified, and let Y
K
i
= {y
i−b
K
2
c
, . . . , y
i+b
K
2
c
} be
the set of positive labels assigned to the frames com-
prised in the chosen neighbourhood of size K. We
hence quantify the probability of each frame F
i
to be-
long to the negative class by estimating the variation
ratio (a measure of entropy) of the nominal distribu-
tion of the assigned positive labels by the multi-class
classifier to the set Y
K
i
:
P(y
i
= 0|F
i
) = 1 −
∑
i+b
K
2
c
k=i−b
K
2
c
[y
k
= mode(Y
K
i
)]
K
(2)
where [·] is the Iverson bracket and mode(Y
K
i
) is the
most frequent label of Y
K
i
. Considering y
i
= 0 (F
i
belongs to the negative class) in Equation (2) and
y
i
6= 0 (F
i
doesn’t belong to the negative class) in
Equation (1), the posterior probability P(y
i
|F
i
) to per-
form classification with rejection can be defined as
follows:
P(y
i
|F
i
) =
(
P(y
i
= 0|F
i
) if y
i
= 0
P(y
i
6= 0|F
i
)P(y
i
|F
i
, y
i
6= 0) otherwise
(3)
SIGMAP 2018 - International Conference on Signal Processing and Multimedia Applications
408
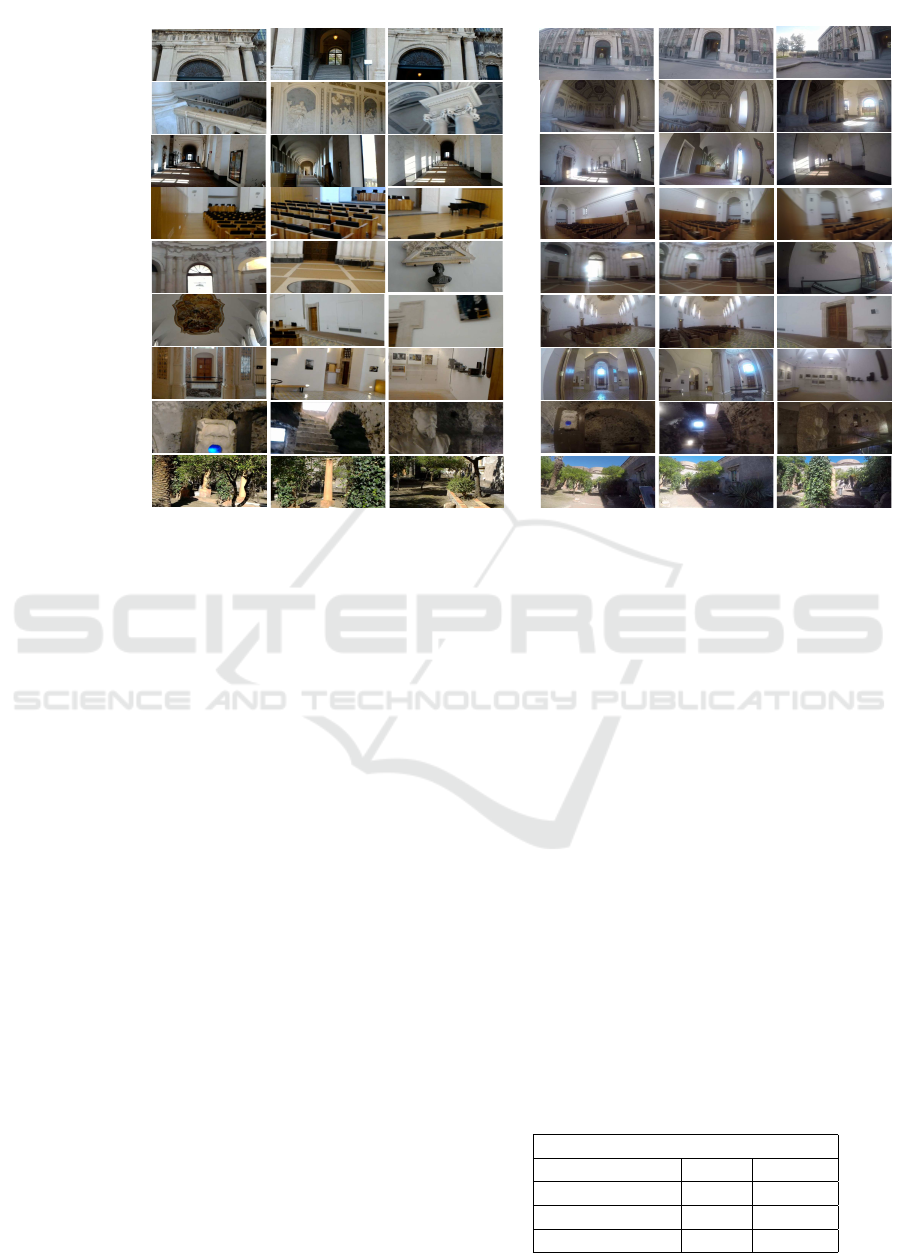
1. Cortile
Microsoft Hololens
GoPro Hero 4
2. Scalone
Monumentale
3. Corridoi
4. Coro di Notte
5. Antirefettorio
6. Aula Santo
Mazzarino
7. Cucina
8. Ventre
9. Giardino dei
Novizi
Figure 1: Some frames for each considered environment, acquired with Microsoft Hololens (left column) and GoPro Hero4
(right column).
3.3 Sequential Modelling
The goal of the Sequential Modelling step is to per-
form smoothing of the segmentation results enforcing
temporal coherence among neighbouring predictions.
To perform this, we employ a Hidden Markov Model
(HMM) (Bishop, 2006) with M positive classes plus
the negative one. Given the video V , the HMM mod-
els the conditional probability of L = {y
1
, . . . , y
N
} as
follows:
P(L|V ) ∝
N
∏
i=2
P(y
i
|y
i−1
)
N
∏
i=1
P(y
i
|F
i
) (4)
where P(y
i
|F
i
) models the emission probability (i.e.,
the probability of being in state y
i
given the frame
F
i
) and P(y
i
|y
i−1
) is the state transition. An “almost
identity matrix” is used to model the state transition
probabilities P(y
i
|y
i−1
), which encourage the model
to change state rarely:
P(y
i
|y
i−1
) =
(
ε, if y
i
6= y
i−1
1 − Mε, otherwise
(5)
where ε is a parameter to control the amount of
smoothing in the predictions. The optimal set of la-
bels L, according to the defined HMM, can be ob-
tained using the well-known Viterbi algorithm. The
final segmentation S is obtained by considering the
connected components of the optimal set of labels L.
4 RESULTS
We tested the method discussed in the previous sec-
tion on the UNICT-VEDI dataset described in Sec-
tion 2. Experiments have been performed on both the
sets of data acquired using Hololens and GoPro. To
find the optimal values for the parameters K (neigh-
borhood size for negative rejection) and ε (sequential
modelling smoothing parameter), we perform a grid
search on a video used as validation to fix the param-
eters. K = 50 and ε = e
−152
were the best parame-
ters for Hololens experiments whereas K = 300 and
ε = e
−171
for GoPro experiments. To evaluate the ob-
tained temporal segmentations we used the two com-
plementary F
1
measures FF
1
and ASF
1
as defined in
(Furnari et al., 2018). Specifically, FF
1
is a frame
based measure, whereas ASF
1
is a segment based
measure. Quantitative results related to the average
FF
1
measure (mFF
1
) and the average ASF
1
measure
(mASF
1
) are summarized in Table 1 and Table 2. The
Table 1: Average FF1 and ASF1 scores obtained using the
considered method trained and tested on Hololens data.
Hololens
mFF1 mASF1
Discrimination 0.734 0.004
Rejection 0.656 0.006
Seq. Modelling 0.822 0.712
Localization of Visitors for Cultural Sites Management
409
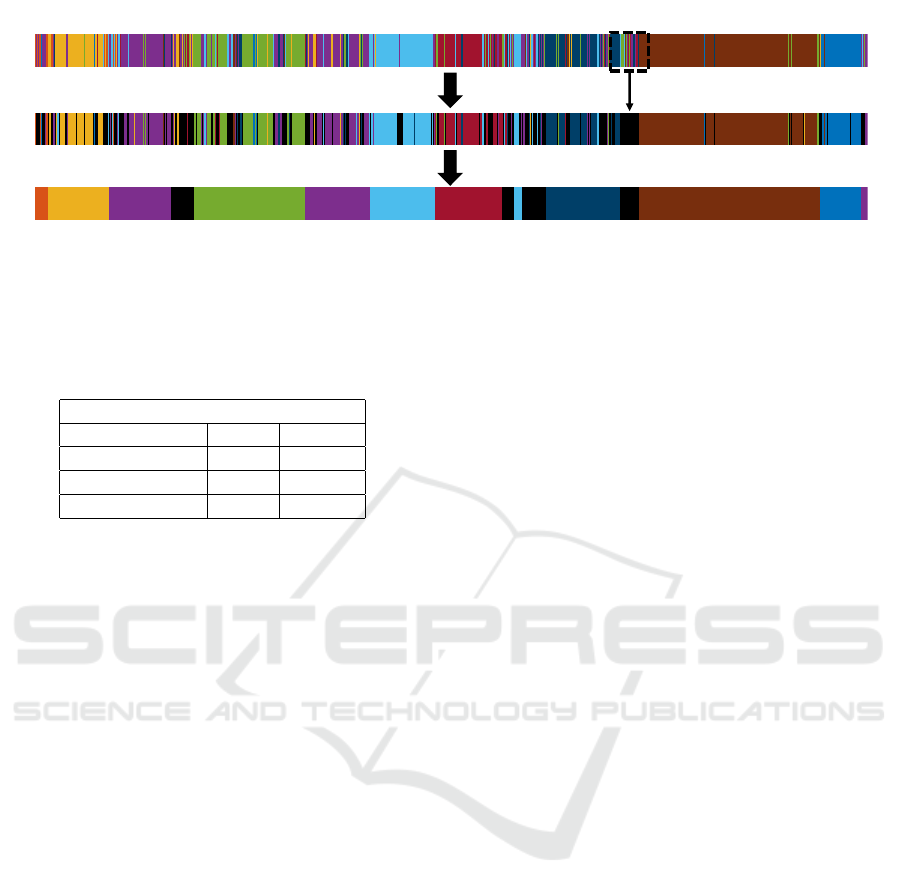
1. Discrimination
2. Negative Rejection
3. Sequential Modelling
temporal sliding window
Figure 2: The method is composed by 3 steps: 1) The Discrimination step consists in a frame by frame classification where the
multi-class classifier is trained without “negative” samples; 2) The Negative Rejection step quantifies the probability of each
frame to belong to the negative class using a sliding window; 3) The Sequential Modelling step smooths the segmentation
enforcing temporal coherence among neighboring predictions.
Table 2: Average FF1 and ASF1 scores obtained using the
considered method trained and tested on GoPro data.
GoPro
mFF1 mASF1
Discrimination 0.883 0.080
Rejection 0.540 0.016
Seq. Modelling 0.810 0.713
results indicate that the proposed method is useful to
provide localization information to the visitors or for
the site manager.
5 CULTURAL SITE
MANAGEMENT
The system described in this paper is complemented
with a web interface that allows a site manager to
handle the analysis of the cultural site. This mod-
ule consists of 7 sections which are useful to: 1) cre-
ate, manage and delete a project related to a cultural
site, 2) add rooms of a considered site, 3) define the
points of interest for each environment of a site, 4)
set the topology of the cultural site, 5) create sam-
ple image templates used to create summaries of the
visit, 6) generate the videos that summarize the vis-
its, 7) send an email to visitors containing the video
summary. Figure 3 shows an image of the developed
interface. The first four sections of the interface are
designed to allow the manager to handle the cultural
site (i.e. which environments are there? How many
points of interest?), the others are used to automati-
cally generate video summaries of the visits. Details
on the management interface are discussed in Section
5.1 and Section 5.2. In Section 5.3 we discuss an in-
terface which can be used by a manager to analyse
the first person videos acquired by the visitors in a
fast way.
5.1 Management Interface
In the first section of the interface, called Pro j ects,
the site manager can create a new project for a cul-
tural site using the button Create, delete an existing
project through the button Delete Pro ject or select
the project to manage. For each project, the user can
upload a representative logo related to the site un-
der consideration. Each site is composed by environ-
ments (i.e. a cultural site such as a museum can have a
bookshop, a courtyard, etc.) and the manager can add
these using the form called Environments. Adding a
new environment, the manager is able to insert the
name of the considered environment, a description
and a map (i.e., an image) which specifies the position
of the environments in the current site. Furthermore,
the environment can be modified or deleted using the
button Modi f y − Delete Environment. Each environ-
ment can have points of interest inside (i.e statues,
paintings, etc.) and these data can be included to im-
prove the information about the environment. In the
section Points o f Interest, a point of interest can be
added selecting an existing environment. The cultural
site manager has to choose a name and the type of
the point of interest, insert a description and upload
the related picture. As for the environments, is possi-
ble to modify and delete an existing point of interest.
For each added environment and point of interest, the
system assigns a unique identifier (ID). The section
Labeling and Topology shows a list with all added
environments and the corresponding point of interest
by using the assigned IDs (Figure 4). In the subsec-
tion Topology is possible to create the topology of the
site as an undirected graph. To create a connection be-
tween two environments, the site manager has to enter
the IDs of the environments to be connected. Then the
topology is generated and shown in Figure 5.
SIGMAP 2018 - International Conference on Signal Processing and Multimedia Applications
410
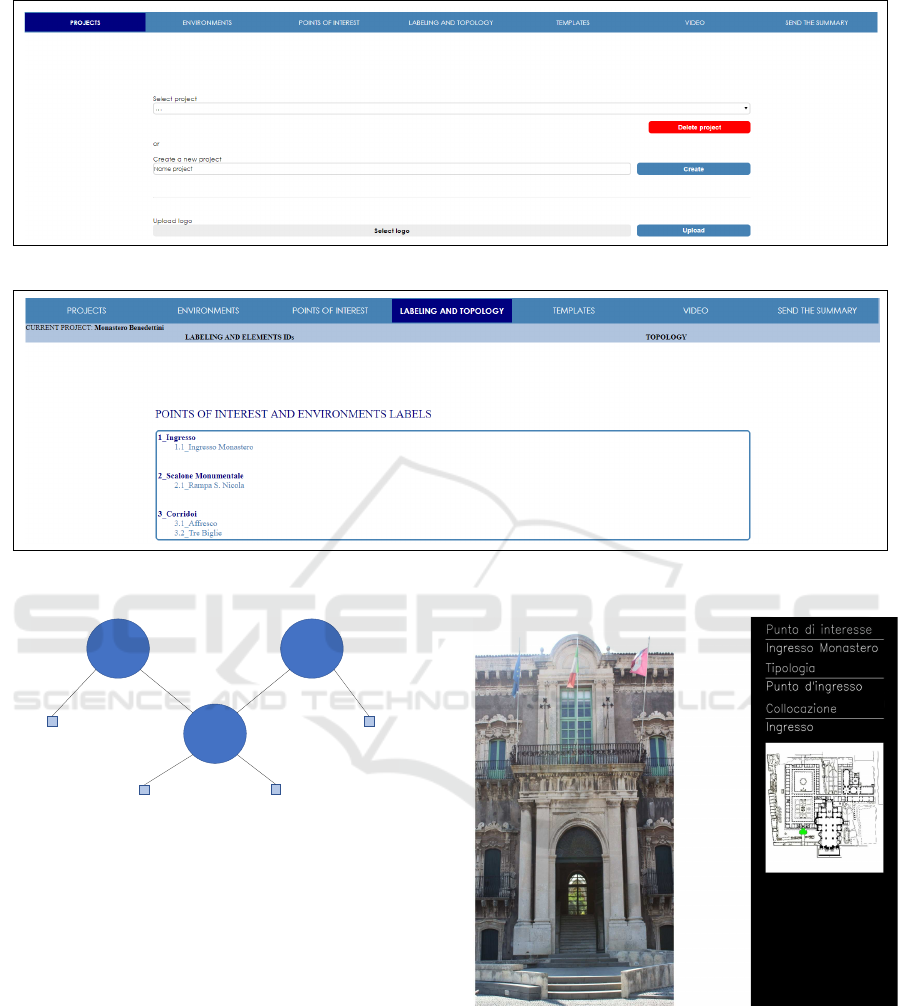
Figure 3: Management interface.
Figure 4: The system generates an automatic identifier (ID) for each environment and each point of interest added by the
manager.
1 2
3
1.1 2.1
3.1 3.2
Figure 5: An example of topology shown as an undirected
graph with 3 environments and 4 points of interest.
5.2 Digital Summary
A long egocentric video of a visit is useless for both
the visitor and the site manager, due to the huge head
motion. Since visitors usually take photos or record
short videos to remember or share the most interesting
part of a site, our system aims to generate a summary
of the video to create a digital gift for the visitors. As-
suming to have an egocentric video labeled frame by
frame using the method discussed in Section 3, the
system is able to compute a video summary of the en-
vironments visited by a tourist. The system takes as
input: 1) the descriptions and the maps of environ-
ments added in the previous sections Environments;
2) the logo of the current project uploaded in the sec-
tion Pro jects; 3) the image templates automatically
generated to describe the environments (see the ex-
Figure 6: Example of template related to an environment.
ample in Figure 6). The templates are used to create
the final video summary. Specifically, for each tem-
poral segment related to an environment, the system
associates the related template for n seconds to pro-
duce the final video. In the section of the interface
called Video, the site manager can automatically cre-
ate the video summary for each visitor and send it via
email.
Localization of Visitors for Cultural Sites Management
411
2. map
3. current object
4. predicted labels
1. current frame
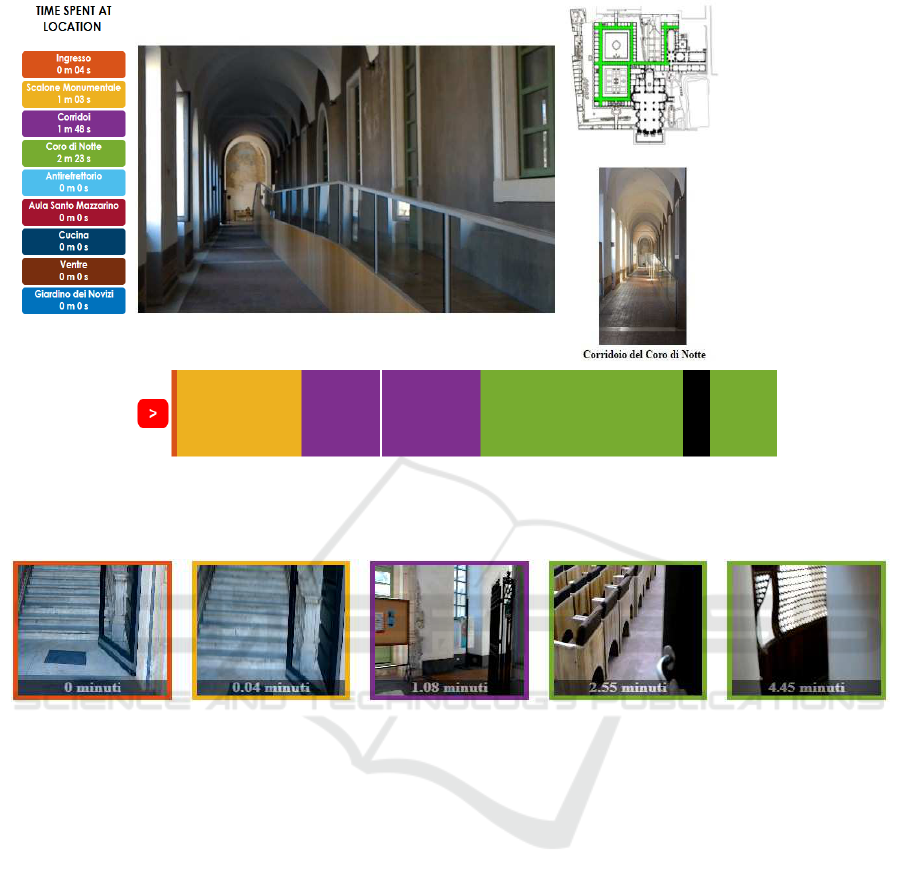
Figure 7: The video player is composed by: 1) the current frame of the video; 2) a map that indicates the current location; 3)
a pictures of the point of interest observed by the visitor; 4) the predicted location.
Figure 8: Each colored block represents the environment visited by the user in a given video segment. It contains also
information on how much time has been spent in that environment.
5.3 Manager Visualization Tool
Manager Visualization Tool (MV T ) is an interface
useful to help the site manger to analyse the output
of the system which automatically localizes (room-
based) the visitor during his tour (see Section 3). With
this tool, the site manager, can interact with the seg-
mented videos related to different visits.
The GUI is composed of various sections. The
VideoList is a list that contains all egocentric videos
related to the different visits that the manager can
analyse. The section called Time Spent At Location
is a list that contains all environments present in the
selected video. Each environment is represented by
a colored block, as shown in Figure 7. Each block
contains the name of the environment and the time
spent by the visitor in that environment. The other
main sections of the interface shown in Figure 7 are
related to the video player and its functionalities. For
each frame the interface shows a map that localize the
environment of the observed frame and a colored seg-
mented sequence that indicates the predicted labels.
Trough a slidebar, the site manager can browse the
video. One more section shown in Figure 8 is com-
posed of some colored blocks that indicate the frame
where a transition phase between the environments
start, as well as how much time the visitor spent at
that location. Selecting a frame allows to seek the
video.
6 CONCLUSION
This work has investigated the problem of localiz-
ing visitors in a cultural site. To study the prob-
lem of localization at room-level, we have used a
dataset that contains more than 4 hours of egocen-
tric videos. The localization problem is investigated
reporting results using a state-of-the-art method for
location-based temporal segmentation of egocentric
videos (Furnari et al., 2018). The web module to anal-
SIGMAP 2018 - International Conference on Signal Processing and Multimedia Applications
412

yse the output of this localization pipeline has been
proposed to help a site manager to understand where
the visitors go and how much time they spend at each
location. The tool is able to generate automatic video
summary of the visits which can be sent to visitor as a
gadget. Future works will consider the problem of un-
derstanding which cultural goods are observed by the
visitors to improve the system and to help site man-
agers to have more insights about the behaviour of
visitors.
ACKNOWLEDGEMENTS
This research is supported by PON MISE - Horizon
2020, Project VEDI - Vision Exploitation for Data
Interpretation, Prog. n. F/050457/02/X32 - CUP:
B68I17000800008 - COR: 128032, and Piano della
Ricerca 2016-2018 linea di Intervento 2 of DMI of the
University of Catania. We gratefully acknowledge the
support of NVIDIA Corporation with the donation of
the Titan X Pascal GPU used for this research.
REFERENCES
Bartoli, F., Lisanti, G., Seidenari, L., Karaman, S., and
Del Bimbo, A. (2015). Museumvisitors: a dataset for
pedestrian and group detection, gaze estimation and
behavior understanding. In Proceedings of the IEEE
Conference on Computer Vision and Pattern Recogni-
tion Workshops, pages 19–27.
Bishop, C. M. (2006). Pattern recognition and Machine
Learning. Springer.
Colace, F., De Santo, M., Greco, L., Lemma, S., Lombardi,
M., Moscato, V., and Picariello, A. (2014). A context-
aware framework for cultural heritage applications.
In Signal-Image Technology and Internet-Based Sys-
tems (SITIS), 2014 Tenth International Conference on,
pages 469–476. IEEE.
Cucchiara, R. and Del Bimbo, A. (2014). Visions for aug-
mented cultural heritage experience. IEEE MultiMe-
dia, 21(1):74–82.
Furnari, A., Battiato, S., and Farinella, G. M. (2018).
Personal-location-based temporal segmentation of
egocentric video for lifelogging applications. Journal
of Visual Communication and Image Representation.
Ragusa, F., Furnari, A., Battiato, S., Signorello, G., and
Farinella, G. M. (2018). Egocentric visitors localiza-
tion in cultural sites. submitted to ACM Journal on
Computing and Cultural Heritage.
Seidenari, L., Baecchi, C., Uricchio, T., Ferracani, A.,
Bertini, M., and Bimbo, A. D. (2017). Deep artwork
detection and retrieval for automatic context-aware
audio guides. ACM Transactions on Multimedia Com-
puting, Communications, and Applications (TOMM),
13(3s):35.
Taverriti, G., Lombini, S., Seidenari, L., Bertini, M., and
Del Bimbo, A. (2016). Real-time wearable computer
vision system for improved museum experience. In
Proceedings of the 2016 ACM on Multimedia Confer-
ence, pages 703–704. ACM.
Localization of Visitors for Cultural Sites Management
413
