
Cross Project Software Defect Prediction using Extreme Learning
Machine: An Ensemble based Study
Pravas Ranjan Bal
1
and Sandeep Kumar
2
Department of Computer Science and Engineering, Indian Institute of Technology Roorkee, Roorkee, India
Keywords:
Extreme Learning Machine, Heterogeneous Ensemble, Cross Project Defect Prediction, Software Defect
Prediction.
Abstract:
Cross project defect prediction, involves predicting software defects in the new software project based on the
historical data of another project. Many researchers have successfully developed defect prediction models
using conventional machine learning techniques and statistical techniques for within project defect prediction.
Furthermore, some researchers also proposed defect prediction models for cross project defect prediction.
However, it is observed that the performance of these defect prediction models degrade on different datasets.
The completeness of these models are very poor. We have investigated the use of extreme learning machine
(ELM) for cross project defect prediction. Further, this paper investigates the use of ELM in non linear hetero-
geneous ensemble for defect prediction. So, we have presented an efficient nonlinear heterogeneous extreme
learning machine ensemble (NH ELM) model for cross project defect prediction to alleviate these mentioned
issues. To validate this ensemble model, we have leveraged twelve PROMISE and five eclipse datasets for
experimentation. From experimental results and analysis, it is observed that the presented nonlinear hetero-
geneous ensemble model provides better prediction accuracy as compared to other single defect prediction
models. The evidences from completeness analysis also proved that the ensemble model shows improved
completeness as compared to other single prediction models for both PROMISE and eclipse datasets.
1 INTRODUCTION
A software defect is a bug in the defective code re-
gion of the software project. Early prediction of soft-
ware defects helps to the software practitioners to
reduce the cost and save time during the develop-
ment of the software project (Menzies et al., 2007;
Ostrand et al., 2005). Many researchers have suc-
cessfully documented the success of software defect
prediction models for within project defect predic-
tion using different types of statistical techniques,
conventional machine learning techniques, and en-
semble techniques in recent years (Menzies et al.,
2007; Rathore and Kumar, 2017a; Rathore and Ku-
mar, 2017b; Rathore and Kumar, 2017c; DAmbros
et al., 2012; Lee et al., 2011).
In within project defect prediction system, a soft-
ware fault prediction model is trained and tested on
the different parts of a dataset collected from same
project. Cross project defect prediction, aims to pre-
dict software defects in the defective code region of a
different unlabeled software project dataset (Hosseini
et al., 2017; He et al., 2012). Training is done on
a labeled dataset of a project and testing/prediction
is done on the dataset of a different project. How-
ever, this category of software defect prediction for
projects with limited number of samples shows lim-
ited accuracy due to difficulty in training software de-
fect prediction models (Zhang et al., 2016). Most
of the researchers have successfully developed the
software defect prediction models as single predic-
tor using different machine learning and statistical
techniques. These techniques include linear regres-
sion, neural networks, generalized regression neu-
ral network, decision tree regression, logistic regres-
sion, radial basis function neural network and zero
inflated Poisson regression etc.. Some recent works
which have shown use of these techniques for soft-
ware fault prediction are (Rathore and Kumar, 2017a;
Yang et al., 2015; Khoshgoftaar and Gao, 2007; Kan-
mani et al., 2007; Lursinsap, 2002). Recently, some
researchers have developed different types of ensem-
ble methods such as, homogeneous ensemble, het-
erogeneous ensemble, linear, and nonlinear ensemble
techniques, to build software fault prediction mod-
els for providing better prediction accuracy (Rathore
320
Bal, P. and Kumar, S.
Cross Project Software Defect Prediction using Extreme Learning Machine: An Ensemble based Study.
DOI: 10.5220/0006886503200327
In Proceedings of the 13th International Conference on Software Technologies (ICSOFT 2018), pages 320-327
ISBN: 978-989-758-320-9
Copyright © 2018 by SCITEPRESS – Science and Technology Publications, Lda. All rights reserved

and Kumar, 2017b; Rathore and Kumar, 2017c; Li
et al., 2016). However, these ensemble models are
designed only for within project defect prediction and
inter release prediction. It is very difficult to obtain
good prediction accuracy for cross project defect pre-
diction using single predictor (Zhang et al., 2016).
To alleviate these issues, we have investigated the
use of extreme learning machine (ELM) and subse-
quently present a non-linear heterogeneous ensemble
using ELM (NH ELM) for cross project defect pre-
diction. Many conventional machine learning algo-
rithms are based on gradient based learning algorithm
and these algorithm such as back propagation learning
algorithm takes more computational time to minimize
the training error (Huang et al., 2006). Use of only
back propagation learning algorithm as base learner
in ensemble takes relatively high computational time.
Thus, we need an efficient and accurate learning algo-
rithm such as extreme learning machine (Huang et al.,
2006) to build a software defect prediction model for
cross project defect prediction. The essence of using
extreme learning machine to build an ensemble model
is that (a) it provides better prediction accuracy, (b)
it is an efficient learning algorithm, (c) it leverages
singular value decomposition method to optimize the
output weights and obtain the global minima easily,
and (d) it improves the generalization performance of
the network.
Following are the contributions of our work:
1. We have investigated the use of ELM and non-
linear heterogeneous ensemble using ELM for
software defect prediction.
2. The presented NH ELM model has been deployed
to predict number of faults on PROMISE and
eclipse datasets for cross project defect prediction
scenario. In this domain, only very few works are
available for cross project defect prediction.
3. The use of ELM as well as ensemble based on
ELM have not been explored for software defect
prediction so far.
The rest of the paper is organized as follows. Sec-
tion 2 presents the details of related works. Section
3 describes ensemble model for cross project defect
prediction. Section 4 presents experimental setup re-
quired to validate the presented model. Experimental
results and analysis is presented in section 5. Section
6 describes threats to validity followed by conclusion
in section 7.
2 RELATED WORKS
In this section, we have discussed recent related
works on software fault prediction.
Rathore et al. in their works (Rathore and Ku-
mar, 2017b; Rathore and Kumar, 2017c) developed
two ensemble models, linear and non-linear hetero-
geneous ensemble models, to predict the number of
software faults. The experiments leveraged fifteen
PROMISE datasets. The experiments were performed
for intra release prediction as well as for inter release
prediction scenario. The results found that both en-
semble models provide consistently better prediction
accuracy than other single prediction models for both
prediction scenarios.
Zhang et al. (Zhang et al., 2016) used unsuper-
vised classifier to predict software defects for cross
project defect prediction. The study leveraged two
types of unsupervised classifier, distance based clas-
sifier and connectivity based classifier, to evaluate
the cross project defect prediction analysis. The
study compared these two types of classifier over
PROMISE and NASA datasets. The results found that
connectivity based classifier performs better than dis-
tance based classifier.
Nam et al. (Nam et al., 2017) proposed a hetero-
geneous defect prediction model to predict software
faults for cross project defect prediction. This work
developed a defect prediction model to predict soft-
ware defects using unmatched metrics. The study had
used PROMISE datasets to validate the model. The
experimental results found that the proposed model
outperforms as compared to other models across all
datasets.
He et al. (He et al., 2014) developed a hybrid
framework for cross project defect prediction using
imbalanced datasets of PROMISE data repository.
The proposed model was compared with the tradi-
tional regular Cross Project Defect Prediction (CPDP)
model over eleven PROMISE datasets. The results
found that the presented framework effectively solved
the imbalanced dataset problem and improved the
prediction accuracy as compared to traditional regu-
lar CPDP model.
Laradji et al. (Laradji et al., 2015) proposed a
heterogeneous ensemble model for prediction of soft-
ware faults using some selected software metrics. The
work has used greedy forward selection method to se-
lect the software metrics. The experimental results
suggested that only few features provide higher AUC
performance measure and the use of greedy forward
selection method in ensemble to select best features
for prediction of software faults.
Huang et al. (Huang et al., 2006) proposed an effi-
Cross Project Software Defect Prediction using Extreme Learning Machine: An Ensemble based Study
321

cient learning algorithm called extreme learning ma-
chine for both prediction and classification purposes.
Authors had suggested that the use of ELM in ensem-
ble can reduce over-fitting problem and improve the
generalization performance of the network (Lan et al.,
2009). Sometimes, single extreme learning machine
prediction model provides poor prediction accuracy
due to the reason of random weight generation. How-
ever, improved version of extreme learning machine
namely ensemble ELM, regularized ELM, evolution-
ary ELM, etc. have better accuracy for all datasets
(Huang et al., 2015). Motivated from this, we have
presented a non-linear heterogeneous extreme learn-
ing machine ensemble (NH ELM) model for cross
project defect prediction.
In summary, it can be observed that all the above
discussed works have used various learning models
for prediction of number of faults. But, ELM has not
been explored till now for the prediction of number of
faults. In this paper, we have used ELM and ensemble
based on ELM for prediction of number of software
faults in cross project defect prediction scenario.
3 ENSEMBLE MODEL FOR
CROSS PROJECT DEFECT
PREDICTION
In this section, we have explained the basic concept
of extreme learning machine and the non-linear het-
erogeneous ensemble model for cross project defect
prediction.
3.1 Basic Concept of Extreme Learning
Machine
Consider that an arbitrary training sample (x
i
, t
i
) is
given, where i = 1, ··· , N and N is the total number
of training samples. For this training sample, the out-
put function of an ELM with m hidden nodes in the
hidden layer can be mathematically modeled by Eq.
(1)
f
m
(x) =
m
∑
i=1
β
i
g
i
(x) = Gβ (1)
Where,
G =
g
1
(x
1
) . . . g
m
(x
1
)
g
1
(x
2
) . . . g
m
(x
2
)
.
.
. . . .
.
.
.
g
1
(x
N
) . . . g
m
(x
N
)
and
β = [β
1
β
2
. . . β
m
]
T
Where, G is the hidden layer matrix with activa-
tion function g(x), β is the output weight matrix of an
ELM network and is defined by Eq. (2).
β = G
†
T (2)
Where, G
†
is the Moore-Penrose generalized in-
verse of matrix G and T = [t
1
t
2
. . . t
N
]
T
is the tar-
get matrix. Singular Value Decomposition (SVD)
method (Golub and Reinsch, 1970) has been used to
evaluate the Moore-Penrose generalized inverse for
our experiment.
3.2 Heterogeneous Ensemble Model
An overview of the non-linear heterogeneous ensem-
ble model used for cross project defect prediction
is shown in Fig. 1. We have leveraged extreme
learning machine (ELM) and back propagation neu-
ral network (BPNN) as base learners for our ensem-
ble model. Extreme learning machine has been used
to predict the final output of the ensemble model. We
have used stacking (Wolpert, 1992) based ensemble
method to build the non-linear heterogeneous ensem-
ble (NH ELM) model to predict the number of soft-
ware faults. The NH ELM model is trained and tested
on different datasets.
4 EXPERIMENTAL SETUP
This section describes experimental setup that is re-
quired to validate the ensemble model for cross
project defect prediction.
4.1 Preprocessing of Datasets
We have leveraged twelve PROMISE (Menzies et al.,
2015) and five eclipse (D’Ambros et al., 2010)
datasets to validate the ensemble model. Table 1
explains the details of software fault datasets. All
datasets have been preprocessed in two steps before
training of the model. In the first step, we have bal-
anced all imbalanced datasets through SMOTER al-
gorithm (Torgo et al., 2013). In the second step, all
software fault datasets have been normalized through
min − max normalization method (Patro and Sahu,
2015) with a range [0, 1].
4.2 Performance Measures
We have used four performance measures, predic-
tion level at l (MacDonell, 1997), Average Rela-
tive Error (ARE) (Willmott and Matsuura, 2005),
ICSOFT 2018 - 13th International Conference on Software Technologies
322
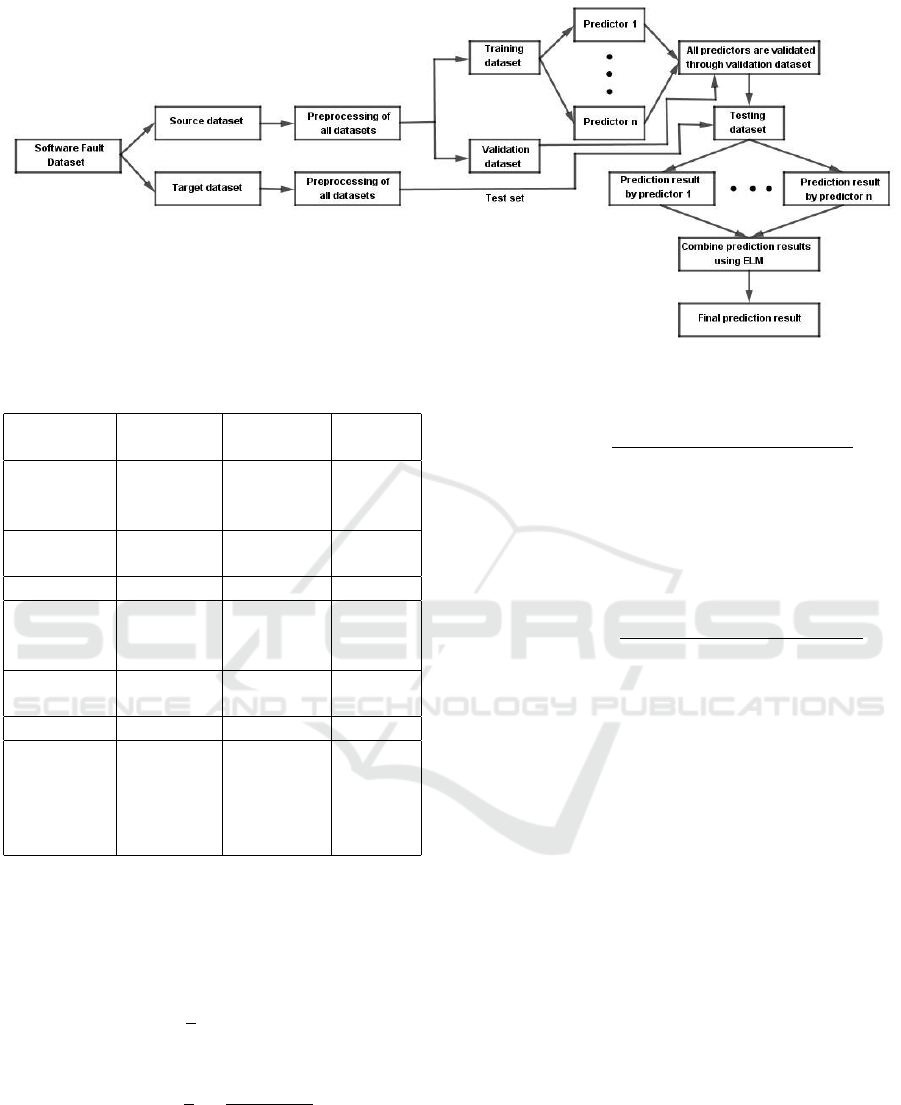
Figure 1: An overview of non-linear heterogeneous ensemble model for cross project defect prediction.
Table 1: An overview of Software fault datasets.
Datasets # Features # Modules Defect
Rate
Ant 1.3 20 125 16 %
Ant 1.5 20 293 12.26 %
Ant 1.7 20 745 28.67 %
Camel 1.2 20 608 55.1 %
Camel 1.4 20 872 19.94 %
Lucene 2.4 20 340 59.7 %
Prop V4 20 3022 9.57 %
Prop V85 20 3077 44.52 %
Prop V121 20 2998 16.51 %
Xalan 2.4 20 723 17.94 %
Xalan 2.6 20 885 86.7 %
Xerces 1.3 20 453 17.96 %
Eclipse 15 997 20.04 %
Equinox 15 324 66.15 %
Lucene 15 691 10.2 %
Mylyn 15 1862 15.15 %
Pde 15 1497 16.22 %
Average Absolute Error (AAE) (Willmott and Mat-
suura, 2005) and measure of completeness (Briand
and W
¨
ust, 2002) to evaluate the ensemble model and
other comparative models.
AAE =
1
k
k
∑
i=1
|(Y
0
i
− Y
i
)| (3)
ARE =
1
k
k
∑
i=1
|(Y
0
i
− Y
i
)|
(Y
i
+ 1)
(4)
Where, k is the total number of samples, Y
0
i
is the pre-
dicted number of defects and Y
i
is the actual number
of defects. We have added a value 1 with the actual
number of defects in the denominator of ARE, which
provides well formed prediction accuracy (Gao and
Khoshgoftaar, 2007).
MoC value =
Predicted number o f de f ects
Actual number o f de f ects
(5)
Measure of Completeness analysis (MoC) value mea-
sures the completeness performance of software de-
fect prediction model. Nearly 100% completeness
value provides best model.
Pred(l) value =
# o f samples whose value ≤ l
Total # o f samples
(6)
Pred (l) value computes, how many number of soft-
ware samples that are under the threshold value of
the AREs. For our experiment, we have chosen the
threshold value is 0.3 (MacDonell, 1997).
4.3 Tools and Techniques Used
We have used R studio for experimentation. We have
compared five other single prediction models with the
ensemble model. These models include decision tree
regression, linear regression, back propagation neural
network, radial basis function neural network, and ex-
treme learning machine. Based upon the study avail-
able in (Kanmani et al., 2007; Lursinsap, 2002), we
have selected 5 and 30 hidden neurons in the hid-
den layer of back propagation neural network and ra-
dial basis function neural network, respectively. We
have also used sigmoid transfer function as activa-
tion function for back propagation neural network.
For decision tree regression and linear regression, the
experimental setup is same as explained by Rathore
et al. (Rathore and Kumar, 2017a). We have also
conducted Friedman’s non-parametric test (Higgins,
2003) to check the significance of the presented en-
semble model and its comparative models.
Cross Project Software Defect Prediction using Extreme Learning Machine: An Ensemble based Study
323

5 EXPERIMENTAL RESULTS
This section presents experimental results of the pre-
sented ensemble model and its comparative models
for cross project defect prediction.
5.1 Cross Project Defect Prediction for
PROMISE and Eclipse Datasets
The measure of completeness analysis of the pre-
sented ensemble model and its comparative single
prediction models for cross project defect prediction
over PROMISE and eclipse datasets are shown in Fig.
2 and 3 respectively. Table 2 and 3 show the perfor-
mance analysis of the presented model and its com-
parative single prediction models for cross project de-
fect prediction analysis over PROMISE and eclipse
datasets in terms of AAE, ARE, and Pred l values re-
spectively. From the experimental results and anal-
ysis of Table 2 and 3, it is observed that the predic-
tion accuracy of the ensemble model outperforms as
compared to other single prediction models over all
PROMISE and eclipse datasets. It is evident from Fig.
2 and 3, the measure of completeness value of the en-
semble model is better than other single defect predic-
tion models across most of the PROMISE and eclipse
datasets for cross project defect prediction analysis.
Observation : The model provides measure of
completeness value along with the consideration of
AAE and ARE performance analysis. For example,
when the model provides 100% nearest measure of
completeness value, the prediction error performance
of the model should be minimized. Hence, we final-
ize measure of completeness analysis of the model
by considering the AAE and ARE performance mea-
sures.
Figure 2: Measure of completeness analysis of six software
fault prediction models for cross project defect prediction
over PROMISE datasets.
Figure 3: Measure of completeness analysis of six software
fault prediction models for cross project defect prediction
over eclipse datasets.
5.2 Statistical Test Analysis
Table 4 shows the Friedman’s statistical test analy-
sis for cross project defect Prediction over PROMISE
and eclipse datasets. From statistical analysis of cross
project defect prediction scenario, it is observed that
all p−values are less than the given significant level
(α−value). Thus, the ensemble model and its com-
parative single defect prediction models are signifi-
cantly different for both datasets.
From this experimental analysis, following re-
search questions are answered as below:
RQ 1 : How does the heterogeneous ensemble
(NH ELM) model perform for cross project defect
prediction analysis?
From Table 2 and 3, it is observed that NH ELM
model performs fairly well for cross project defect
prediction scenario for all the dataset. From Table 2, it
can be seen that the highest and lowest value of AAE
and ARE shown by the NH ELM are 0.0166 − 0.044
and 0.0157 − 0.04 respectively. From Table 3, it can
be seen that the highest and lowest value of AAE and
ARE shown by the NH ELM are 0.0142 − 0.053 and
0.013 − 0.0474 respectively.
RQ 2 : Does NH ELM model improve the predic-
tion accuracy than other single prediction models for
cross project defect prediction analysis ?
Yes, NH ELM model shows improved prediction
accuracy than other single prediction models for al-
most all datasets except one eclipse dataset for cross
project defect prediction analysis. It is evident from
the AAE, ARE, and Pred l analysis shown in Table
2 and 3 and the measure of completeness analysis
shown in Fig. 2 and 3. The results obtained from
Friendmans test also confirms this observations.
RQ 3 : Does the use of heterogeneous ensemble
with ELM as base learner shows improved accuracy
as compared to participating learning models espe-
cially with reference to ELM?
From table 2 and 3, it can be observed that ELM
ICSOFT 2018 - 13th International Conference on Software Technologies
324

Table 2: Performance measure analysis of six software fault prediction models for cross project defect prediction. Best values
are bold faced.
PROMISE datasets LR DTR BPNN RBF ELM NH ELM
Ant 1.3 - Camel 1.2 AAE 0.1474 0.0785 0.0607 0.1678 0.0775 0.0368
ARE 0.1421 0.0734 0.0556 0.1619 0.0727 0.0344
Pred l 93.28 93 97.2 87.97 97.6 100
Ant 1.7 -Camel 1.4 AAE 0.0592 0.0617 0.0615 0.0658 0.0671 0.0272
ARE 0.0525 0.0617 0.0545 0.06 0.06 0.025
Pred l 99.27 97.53 98.91 99.49 98.4 100
Xalan 2.6 - Xerces 1.3 AAE 0.0518 0.0582 0.0642 0.0768 0.1047 0.0166
ARE 0.0487 0.0545 0.0601 0.0731 0.0982 0.0157
Pred l 97.8 97.99 96.29 99.72 93.41 100
Xalan 2.4 - Ant 1.7 AAE 0.0813 0.0881 0.0915 0.0876 0.0852 0.0399
ARE 0.0722 0.0881 0.0789 0.0785 0.0738 0.0353
Pred l 99.72 98.97 98.79 99.72 99.16 99.86
Prop v4 - Ant 1.7 AAE 0.0875 0.1158 0.0822 0.092 0.1212 0.0415
ARE 0.0763 0.1052 0.0696 0.0825 0.1018 0.0371
Pred l 99.44 99.53 99.16 99.72 96.37 99.86
Prop v85 -Lucene 2.4 AAE 0.051 0.0549 0.0644 0.0649 0.0676 0.044
ARE 0.0451 0.0478 0.0568 0.0598 0.0583 0.04
Pred l 100 98.23 97.05 100 97.64 100
Ant 1.3 - Prop v4 AAE 0.1653 0.1317 0.1295 0.1679 0.0928 0.0348
ARE 0.1486 0.1149 0.11 0.1515 0.0871 0.0315
Pred l 92.7 91.68 92.73 91.75 97.33 99.77
Ant 1.5 - Prop v121 AAE 0.1141 0.0971 0.0961 0.1172 0.0661 0.0197
ARE 0.1078 0.0897 0.0898 0.111 0.0643 0.0181
Pred l 95.84 88.73 92.97 96.72 99.08 99.93
Lucene 2.4 - Prop v85 AAE 0.0405 0.0643 0.0373 0.0478 0.069 0.021
ARE 0.038 0.0643 0.0349 0.0451 0.0642 0.0194
Pred l 99.55 94.39 99.55 99.55 98.26 99.92
shows comparable or better performance as com-
pared to the other best performing models such as
LR, DTR, BPNN and RBF as reported in recent
works of software fault prediction (Rathore and Ku-
mar, 2017a; Kanmani et al., 2007; Khoshgoftaar and
Gao, 2007; Lursinsap, 2002) in this domain. Fur-
ther, from the experimental results in Table 2 and
3, it can be seen that the heterogeneous ensemble
performs better as compared to both participating
base learners, i.e, BPNN and ELM. Highest value of
AAE and ARE for NH ELM is 0.0166 and 0.0157
for PROMISE datasets and 0.0142 and 0.013 for
eclipse datasets, where for ELM and BPNN, the val-
ues of AAE are 0.0661 and 0.0373, respectively for
PROMISE datasets and 0.0378 and 0.0279, respec-
tively for eclipse datasets and the values of ARE
are 0.0583 and 0.0349, respectively for PROMISE
datasets and 0.0363 and 0.0261, respectively for
eclipse datasets. Also, Table 2 and 3 show that per-
formance of NH ELM is much better than the other
best performing single learning models. Similar re-
sults are expected in the other possible pairs also.
6 THREATS TO VALIDITY
In this section, we have presented some possible
threats that may degrade the performance of the en-
semble model for cross project defect prediction.
Internal Validity: In this work, we have used sig-
moid function as differential activation function in the
hidden layer of extreme learning machine to find the
final prediction accuracy of the non-linear ensemble
model. The use of non-differentiable activation func-
tion for ELM may produce different prediction accu-
racy.
External Validity: We have leveraged different types
of open source software fault datasets of PROMISE
data repository and eclipse datasets to validate the en-
semble model. Some industrial software fault datasets
may affect the performance of the ensemble model.
Conclusion Validity: Min-Max normalization
method has been used to normalize all datasets.
SMOTER method has been used to balance all
imbalanced datasets. Other types of normalization
technique such as Z-score method can be used for
normalization of fault datasets and may affect the
results.
Cross Project Software Defect Prediction using Extreme Learning Machine: An Ensemble based Study
325

Table 3: Performance measure analysis of six software fault prediction models for cross project defect prediction over eclipse
datasets. Best values are bold faced.
PROMISE datasets LR DTR BPNN RBF ELM NH ELM
Eclipse - Lucene AAE 0.0826 0.0629 0.0728 0.0839 0.0642 0.027
ARE 0.0728 0.0561 0.0638 0.0786 0.0579 0.0251
Pred l 99.43 100 99.67 99.83 99.67 100
Mylyn - Pde AAE 0.1172 0.0594 0.0279 0.0408 0.0482 0.0173
ARE 0.1137 0.0576 0.0261 0.0396 0.0466 0.0157
Pred l 93.86 99.84 99.84 99.96 99.84 99.67
Equinox - Pde AAE 0.0883 0.0473 0.0402 0.055 0.0378 0.0142
ARE 0.0859 0.0457 0.0386 0.0536 0.0363 0.013
Pred l 99.52 99.84 99.76 99.88 99.84 100
Equinox - Mylyn AAE 0.0642 0.0572 0.0608 0.0591 0.0555 0.028
ARE 0.0603 0.0519 0.0562 0.0553 0.05 0.0262
Pred l 99.06 99.68 98.87 99.75 99.28 100
Mylyn - Equinox AAE 0.1602 0.0609 0.0635 0.0657 0.0698 0.0529
ARE 0.141 0.0545 0.0543 0.0592 0.0637 0.0473
Pred l 86.59 99.74 99.22 99.48 99.74 100
Pde - Equinox AAE 0.0576 0.0637 0.063 0.0672 0.0549 0.053
ARE 0.0487 0.0533 0.0525 0.0606 0.0468 0.0474
Pred l 99.22 98.96 98.19 99.48 99.48 99.43
Table 4: Friedman’s statistical test analysis for cross project
defect Prediction over PROMISE and Eclipse datasets.
Promise datasets (α = 0.05)
χ
2
value df p-value
AAE 25.5 5 0.00011
ARE 26.14 5 8.35e-05
Eclipse datasets (α = 0.05)
χ
2
value df p-value
AAE 19.23 5 0.0017
ARE 18.28 5 0.0026
7 CONCLUSION
In this paper, we have investigated the use of extreme
learning machine and heterogeneous ensemble using
ELM for cross project defect prediction. To vali-
date this ensemble model, we have leveraged twelve
PROMISE and five eclipse datasets. We have prepro-
cessed all software fault datasets to avoid over-fitting
problem of the presented ensemble model and other
models. From experimental results and analysis, it is
observed that ELM shows comparable or better per-
formance in cross project defect prediction as com-
pared to other reputed best performing models such
as LR, DTR, RBF, etc. Further, the nonlinear hetero-
geneous ensemble model provides better prediction
accuracy as compared to the other single defect pre-
diction models. It is also observed that the prediction
accuracy of the ensemble is better than both of the
participating learning models, i.e., BPNN and ELM.
The evidences from measure of completeness anal-
ysis also proved that the presented ensemble model
shows improved completeness as compared to other
single defect prediction models throughout most of
the datasets. Thus, we can deploy extreme learning
machine based ensemble model for prediction of soft-
ware defects. In future, we will explore different vari-
ants of extreme learning machine to build software
fault prediction model for better prediction accuracy.
ACKNOWLEDGMENTS
The authors are thankful to Ministry of Electron-
ics and Information Technology, Government of In-
dia. This publication is an outcome of the R&D
work undertaken in the project under the Visves-
varaya PhD Scheme of Ministry of Electronics and
Information Technology, Government of India, being
implemented by Digital India Corporation (formerly
Media Lab Asia).
REFERENCES
Briand, L. C. and W
¨
ust, J. (2002). Empirical studies of qual-
ity models in object-oriented systems. In Advances in
computers, volume 56, pages 97–166. Elsevier.
D’Ambros, M., Lanza, M., and Robbes, R. (2010). An ex-
tensive comparison of bug prediction approaches. In
Mining Software Repositories (MSR), 2010 7th IEEE
Working Conference on, pages 31–41. IEEE.
ICSOFT 2018 - 13th International Conference on Software Technologies
326

DAmbros, M., Lanza, M., and Robbes, R. (2012). Evaluat-
ing defect prediction approaches: a benchmark and an
extensive comparison. Empirical Software Engineer-
ing, 17(4-5):531–577.
Gao, K. and Khoshgoftaar, T. M. (2007). A comprehensive
empirical study of count models for software fault pre-
diction. IEEE Transactions on Reliability, 56(2):223–
236.
Golub, G. H. and Reinsch, C. (1970). Singular value de-
composition and least squares solutions. Numerische
mathematik, 14(5):403–420.
He, P., Li, B., and Ma, Y. (2014). Towards cross-project
defect prediction with imbalanced feature sets. arXiv
preprint arXiv:1411.4228.
He, Z., Shu, F., Yang, Y., Li, M., and Wang, Q. (2012).
An investigation on the feasibility of cross-project
defect prediction. Automated Software Engineering,
19(2):167–199.
Higgins, J. J. (2003). Introduction to modern nonparametric
statistics.
Hosseini, S., Turhan, B., and Gunarathna, D. (2017). A sys-
tematic literature review and meta-analysis on cross
project defect prediction. IEEE Transactions on Soft-
ware Engineering.
Huang, G., Huang, G.-B., Song, S., and You, K. (2015).
Trends in extreme learning machines: A review. Neu-
ral Networks, 61:32–48.
Huang, G.-B., Zhu, Q.-Y., and Siew, C.-K. (2006). Extreme
learning machine: theory and applications. Neuro-
computing, 70(1-3):489–501.
Kanmani, S., Uthariaraj, V. R., Sankaranarayanan, V., and
Thambidurai, P. (2007). Object-oriented software
fault prediction using neural networks. Information
and software technology, 49(5):483–492.
Khoshgoftaar, T. M. and Gao, K. (2007). Count models
for software quality estimation. IEEE Transactions
on Reliability, 56(2):212–222.
Lan, Y., Soh, Y. C., and Huang, G.-B. (2009). Ensemble of
online sequential extreme learning machine. Neuro-
computing, 72(13-15):3391–3395.
Laradji, I. H., Alshayeb, M., and Ghouti, L. (2015). Soft-
ware defect prediction using ensemble learning on se-
lected features. Information and Software Technology,
58:388–402.
Lee, T., Nam, J., Han, D., Kim, S., and In, H. P. (2011). Mi-
cro interaction metrics for defect prediction. In Pro-
ceedings of the 19th ACM SIGSOFT symposium and
the 13th European conference on Foundations of soft-
ware engineering, pages 311–321. ACM.
Li, W., Huang, Z., and Li, Q. (2016). Three-way decisions
based software defect prediction. Knowledge-Based
Systems, 91:263–274.
Lursinsap, A. M. P. S. C. (2002). Software fault predic-
tion using fuzzy clustering and radial-basis function
network.
MacDonell, S. G. (1997). Establishing relationships be-
tween specification size and software process effort in
case environments. Information and Software Tech-
nology, 39(1):35–45.
Menzies, T., Greenwald, J., and Frank, A. (2007). Data
mining static code attributes to learn defect predictors.
IEEE transactions on software engineering, 33(1):2–
13.
Menzies, T., Krishna, R., and Pryor, D. (2015). The
promise repository of empirical software engineering
data. http://openscience.us/repo. North Carolina State
University, Department of Computer Science.
Nam, J., Fu, W., Kim, S., Menzies, T., and Tan, L. (2017).
Heterogeneous defect prediction. IEEE Transactions
on Software Engineering.
Ostrand, T. J., Weyuker, E. J., and Bell, R. M. (2005). Pre-
dicting the location and number of faults in large soft-
ware systems. IEEE Transactions on Software Engi-
neering, 31(4):340–355.
Patro, S. and Sahu, K. K. (2015). Normalization: A prepro-
cessing stage. arXiv preprint arXiv:1503.06462.
Rathore, S. S. and Kumar, S. (2017a). An empirical
study of some software fault prediction techniques
for the number of faults prediction. Soft Computing,
21(24):7417–7434.
Rathore, S. S. and Kumar, S. (2017b). Linear and non-linear
heterogeneous ensemble methods to predict the num-
ber of faults in software systems. Knowledge-Based
Systems, 119:232–256.
Rathore, S. S. and Kumar, S. (2017c). Towards an ensemble
based system for predicting the number of software
faults. Expert Systems with Applications, 82:357–382.
Torgo, L., Ribeiro, R. P., Pfahringer, B., and Branco,
P. (2013). Smote for regression. In Portuguese
conference on artificial intelligence, pages 378–389.
Springer.
Willmott, C. J. and Matsuura, K. (2005). Advantages of the
mean absolute error (mae) over the root mean square
error (rmse) in assessing average model performance.
Climate research, 30(1):79–82.
Wolpert, D. H. (1992). Stacked generalization. Neural net-
works, 5(2):241–259.
Yang, X., Tang, K., and Yao, X. (2015). A learning-to-rank
approach to software defect prediction. IEEE Trans-
actions on Reliability, 64(1):234–246.
Zhang, F., Zheng, Q., Zou, Y., and Hassan, A. E. (2016).
Cross-project defect prediction using a connectivity-
based unsupervised classifier. In Proceedings of the
38th International Conference on Software Engineer-
ing, pages 309–320. ACM.
Cross Project Software Defect Prediction using Extreme Learning Machine: An Ensemble based Study
327
