
Air Traffic Safety Risk Assessment
based on Rough Set and BP Neural Network
Lan Ma
*
, Weian Li and Zengxian Geng
Air Traffic Management College,
Civil Aviation University of China, Tianjin, China
Keywords: Air Traffic Safety, Rough Set, Attribute Reduction, BP Neural Network.
Abstract: The safety of air traffic control is an important link in the safety system of civil aviation industry. In order to
evaluate the safety risk of air traffic control in a more comprehensive and reliable way, proposing an air
traffic safety risk modeling and evaluation method based on rough set and BP neural network. After
analyzing the factors that may affect the safety in the actual work of ATC, 24 attribute variables which can
measure the safety risk of ATC are given. Aiming at the shortcomings of traditional neural network training
with high redundancy, slow convergence and easy to fall into local optimum, the attribute reduction method
is used to reduce the input attribute by rough set theory. Under the premise of not affecting the training
results and the accuracy of the data, removing the low correlation attributes with the results, the network
structure is simplified, the training times are reduced, and the training speed and accuracy of the neural
network are improved. Use the simplified condition attributes of the original data after rough attribute
reduction as input data, the conflict resolution object is as output data, using MATLAB to build the neural
network, and the trained network is tested and verified to be reliable. Compared with the model before the
reduction of the initial data, significantly improves the accuracy and efficiency. The model is verified by
examples The results show that the combination of rough set and BP neural network can accurately evaluate
the risk of air traffic control, change the risk assessment from qualitative to quantitative, and provide
guidance for the actual operation.
1 INTRODUCTION
*
The unsafe incidents in civil aviation operations can
be divided into five categories: aircraft operation,
aircraft maintenance, ground support, airport
operations and ATC safeguards. It can be seen that
some of the unsafe incidents are related to ATM
system. Air Traffic Management System is an
important part of the civil aviation system. It is also
a complex system of structural correlation. In recent
years, air traffic control accidents such as runway
incidents caused by security problems are common.
In order to ensure the safe operation of civil aviation
system, it is crucial to assess the air traffic safety
risk (Zellweger and Donohue 2015).
*
Ma Lan, female, Civil Aviation University of China,
Associate Professor, Ph.D. major research area:
Transportation planning, air traffic control information
processing.
1.1 Research Status
As people pay more attention to the safety of ATC,
more and more scholars inland and abroad are
engaged in the research of ATC safety, and they
have achieved some results. In the 1990s, academics
in the United States and European countries started
to study the theory of civil aviation safety risk
management. Shyur (2008) quantified the aviation
risk caused by human error with studying aviation
accidents and safety indicators. The benchmark risk
function was taken into aviation risk evaluation as
the quadratic function, then get a proportional risk
model to investigate non-linear aviation safety
factors and evaluate aviation risk; Al Basman and
Hu (2012) have studied the theory of stochastic
safety analysis that can be used in ATC systems and
proposed two ways that a multi-level Markov chain
and air traffic flow assessment to solve the safety
issues in the ATC environment;
Cruck and Lygeros
(2015)
have built a hybrid model which can be man-
Ma, L., Li, W. and Geng, Z.
Air Traffic Safety Risk Assessment based on Rough Set and BP Neural Network.
DOI: 10.5220/0006889008630870
In Proceedings of the 13th International Conference on Software Technologies (ICSOFT 2018), pages 863-870
ISBN: 978-989-758-320-9
Copyright © 2018 by SCITEPRESS – Science and Technology Publications, Lda. All rights reserved
863
machine interaction, this model can be used in
complex situations to forecast, in order to percept air
traffic safety risk.
Domestic research on ATC safety risks started a
little later than abroad. However, in recent years
there have been some achievements. Many scholars
have used Bayesian analysis (Liao et al. 2015), gray-
level analysis(Guo et al. 2015), matter-element
analysis theory (Zhang et al. 2016) and other
methods to study the ATM safety problems. Based
on the analysis of triangular fuzzy mathematics and
ANP principle, Du et al. (2010) have established an
air traffic control security risk assessment model
with Fuzzy-ANP in view of the interaction of
security risk factors; China's civil aviation industry
now put forward the safety management system
(SMS) whose core is risk management to control the
security risk through the overall operation of the
various links (Lu 2017).
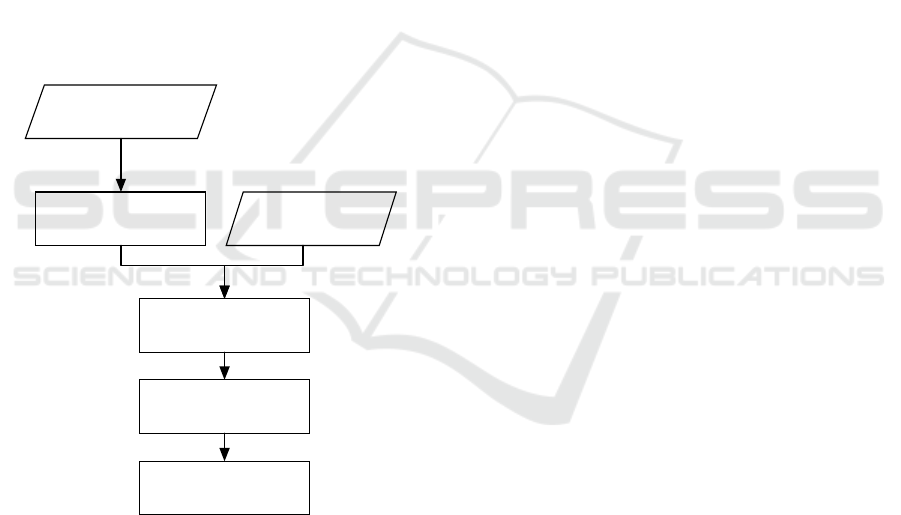
1.2 Introduction
ATC work experience and expert
advice
Air traffic control risk
assessment index system
ATC Risk Assessment Data
Rough set attribute reduction
Build neural network
Use test data to evaluate ATC
safety level
Figure 1: Research content and process.
This paper combines and draws on the
advantages of the existing researches, and on this
basis expands and builds the risk assessment index
system. Then it extends the qualitative research to
quantitative research that can be more universal, and
using rough set theory with attribute reduction
function makes the neural network model structure
(Wang 2013) more concise, and makes the
forecasting results fast and accurate. The research
content and process is shown in figure 1.
2 CONSTRUCTION OF RISK
ASSESSMENT INDEX SYSTEM
Based on a comprehensive analysis of the
characteristics and significance of air traffic control
system and its important position in the civil
aviation industry, air traffic control risk assessment
indicators (Luo et al. 2009) are generally divided
into four categories: human factors, equipment
factors, environmental factors and management
factors The factors are the first layer of the whole
index system, and then combine the examples of the
ATC operation and the opinions given by the ATC
experts. Each factor contains several sub-factors and
they are evaluated as an indicator in the subsequent
research. The final index system has the
characteristics of science, and fits the actual work of
the ATC. Air traffic control security risk assessment
indicator system in Figure 4.
In order to analyze the impact of each indicator
on the safety of ATC by means of qualitative and
quantitative analysis, investigate the senior
management of ATC system, controllers and ATC
experts in the form of questionnaires. And ask them
to combine their own actual work or research
conditions, or assessment of an unsafe event, and
mark each indicator based on their own knowledge
and experience, scoring criteria: 1 point - very good,
2 points - good, 3 points - ordinary, 4 points - poor,
5 points - very poor. After marking the index, given
the general
Evaluation of the security risk rating, there are
five levels: level 1 is lowest risk, level 2 is lower
risk, level 3 is medium risk, level 4 is higher risk,
and level 5 is highest risk. Summarizing above
work, the safety risk assessment system for ATC and
the results of the questionnaire form the data
foundation for the follow-up study in this paper.
3 INDEX REDUCTION BASED
ON ROUGH SET THEORY
Rough set theory (Wang et al. 2009) is used to
analyze and process data. It was first proposed by
Polish mathematician Z. Pawlak in 1982, which has
many advantages. It does not need too much raw
data to find the hidden rules of data, it is now widely
used in data mining, pattern recognition and other
fields.
Finally, complete content and organizational
editing before formatting. Please take note of the
SE-CLOUD 2018 - Special Session on Software Engineering for Service and Cloud Computing
864

following items when proofreading spelling and
grammar:
3.1 Rough Set Theory Applied to Air
Traffic Control
Define abbreviations and acronyms the first time
they are used in the text, even after they have been
defined in the abstract. In general, it is best to avoid
acronyms in the abstract unless they are critical.
Abbreviations such as IEEE, SI, MKS, CGS, SC,
DC, and RMS do not have to be defined. Do not use
abbreviations in the title or heads unless they are
unavoidable.
Obviously, the collated original data is too
complicated to subsequent computational studies.
Then we find that all the attributes are not equally
important. There are some redundant or inconclusive
attributes that can be eliminated, further obtaining a
more streamlined and intuitive decision table.
Given R is a set of reduced attributes to be
obtained, P is a set of condition attributes
corresponding to 24 ATM safety risk assessment
indicators, X is an instance set with removal
compatibility examples, EXPECT is a termination
condition for attribute dependencies, The following
algorithm:
Initialize, make
()
RcoreC=
,
()
P
CcoreC=−
,
1k =
.
• Remove all compatible instances of U, that is:
()
R
X
UPOSD=− (1)
• Calculation
()
()
()
R
card POS D
k
card U
=
(2)
• if
k EXPECT≥ , the algorithm terminates;
otherwise, if
() ()
RC
POS D POS D= , returns
()
()
()
C
card POS D
k
card U
=
(3)
the algorithm terminates;
• For any
p
P∈
, calculation of
{}
()
()
p
Rp
card POS D
υ
∪
= (4)
{}
()
()
{}
()
max_ /
p
Rp
m sizePOS D RPD
∪
=∪∪ (5)
• For all
p
P∈ , calculation
pp
m
υ
× with the
maximum value, and
given
{
}
RR P=∪ ,
{
}
PP p=− ;
• Return to the first step
3.2 Data Attribute Reduction
In the study, 310 scoring surveys were conducted on
the 24 safety risk assessment indicators of air traffic
control. The final survey data constituted the domain
U of the knowledge representation system, and then
formed a complete decision table. The safety risk
indicators {X1, X2, X3 , ..., X24} is the condition
attribute, the security risk level is the decision
attribute, the value of the attribute is 1, 2, 3, 4, 5,
which meets the discretization requirements of the
attribute reduction of the rough set. Show in table 1.
Table 1: Air traffic safety risk assessment decision table.
U
attribute C attribute D
X1 X2 X3 … X24 safety risk level
1 1 3 1 … 2 1
2 3 1 2 … 1 3
3 4 1 2 … 2 2
4 3 1 1 … 1 3
… … … … … … …
310 2 1 2 … 2 1
The reducing result is usually not the only one.
Finding all reductions or minimal reductions have
proved to be an NP-hard problem. The general
solution to this problem is heuristic search, which
builds a reduced set of attributes by computing
dependencies of attributes. And there are common
attribute reduction methods like Johnson greedy
algorithms and genetic algorithms.
Air Traffic Safety Risk Assessment based on Rough Set and BP Neural Network
865

For processing the original data, using Rosetta
software to conduct attribute reduction, the software
is table logic data tool based on rough set theory
framework, it can be used to simplify the model. The
processed data excel tables imported into Rosetta
software for data complement and discretization.
And select the method to reduce the data, then you
can directly get attribute reduction results.
Table 2: Reduced air traffic safety risk assessment.
Factors number indicators
human
factors
X1
Controller technical level is not up to
standard
X2
Controller psychological quality is not
up to standard
X3
Emergency response capacity is not
enough
X5
Controller or department head safety
awareness and sense of responsibility
is not enough
equipment
factors
X7
Communication equipment is not
working properly
X8
Navigation device is not working
properly
X9
Monitoring equipment is not working
properly
environ-
ment
factors
X13 Seat monitoring means imperfect
X14
Scene monitoring and guidance
system is not working properly
X16
Weather conditions and weather
disasters
manage-
ment
factors
X19 Poor management practices
X20
Department of high frequency of
conflict intensity
X23
Safety education and training system
is not perfect
After processing the data, the attributes after
reduction are shown in Table 2, it can be seen that
the attribute reduction obviously reduces the number
of attributes from the original 24 to 13. To a certain
extent, the reduction result also reflects the impact of
various factors on the safety of ATC, showing that
the most obvious impact of ATC safety is human
factor.
4 AIR TRAFFIC CONTROL
SECURITY RISK ASSESSMENT
BY NEURAL NETWORK
METHOD
After the text edit has been completed, the paper is
ready for the template. Duplicate the template file by
using the Save As command, and use the naming
convention prescribed by your conference for the
name of your paper. In this newly created file,
highlight all of the contents and import your
prepared text file. You are now ready to style your
paper; use the scroll down window in the formatting
toolbar (
Silva.et al. 2017).
4.1 Construction and Application of BP
Neural Network based on Rough
Set
Analyzing the reduction result of the safety risk
indicators assessment data of ATC. It can be
concluded that there is a certain causal relationship
between the attributes and the final safety
assessment, and the inherent law of the relation can
be tapped by neural network (Liu et al. 2010) to get
the quantitative and qualitative assessment of ATC
risk assessment.
Aiming at the shortcomings of traditional neural
network training with high redundancy, slow
convergence and easy to fall into local optimum, the
attribute reduction method is used to reduce the
input attribute by rough set theory. Under the
premise of not affecting the training results and the
accuracy of the data, removing the low correlation
attributes with the results, the network structure is
simplified, the training times are reduced, and the
training speed and accuracy of the neural network
are improved.
For the general pattern recognition problem,
adopting a three-layer neural network structure
(Bruin et al. 2017)
. The following is the step of
modeling the neural network of air traffic safety risk
assessment(Ma and Chang 2017):
• Initialize weights, assign random values in the
interval (0,1) to each connection weight and
threshold;
• Determine the number of neurons in each layer,
the number of neurons in the input layer is 13
attributes, the attribute values input after
discretization;
SE-CLOUD 2018 - Special Session on Software Engineering for Service and Cloud Computing
866
• Determine the number of hidden layer neurons.
In the three-layer network, choosing the number
of hidden layer neurons is a very complex issue.
It often requires designers' experience and
multiple tests to determine. If the number of
hidden layer neurons is n2, the number of input
layer neurons is n1, the number of output layer
neurons is m, choose the best n2 can refer to the
following formula:
21
nnma=++
,
Where a is the constant between
[
]
1,10
;
221
lognn=
However, the quantity is not fixed and needs to
be constantly adjusted by the actual training test. In
Table 3, the training errors when selecting different
hidden layers are listed. Therefore, the number of
hidden layer neurons is set as 9 in this study. Ensure
the training accuracy and improve the computing
speed.
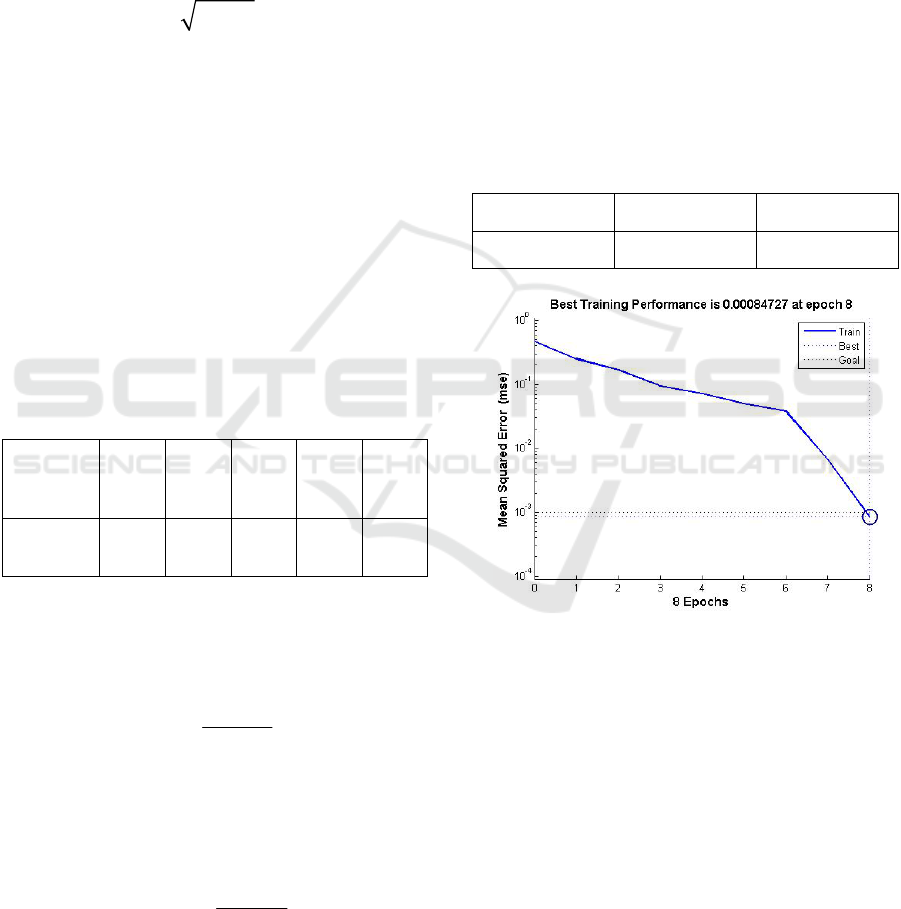
Table 3: Implicit layer test error.
hidden layer
neurons
number
5 6 7 8 9
training
errors
0.00350 0.00928 0.00300 0.00916 0.00122
• Choose transfer function. The transfer function
of hidden layer neurons adopts S-type tangent
function:
()
2
1
1
x
fx
e
α
−
=−
+
Output layer neurons transfer function using S-
type logarithmic function:
()
1
1
x
fx
e
α
−
=
+
• The output layer should reflect the final five
security risk assessment levels. In order to
ensure the accuracy of the training results, we
classify the levels as level 1 (1 0 0 0 0), level 2
(0 1 0 0 0), level 3 (0 0 1 0 0), level 4 (0 0 0 1 0),
level 5 (0 0 0 0 1). Five neurons are set in the
output layer to quantify the above five levels.
After modeling, the 310 groups of data are
divided into training group and test group. The data
are normalized by MATLAB (Ge and Sun 2007) and
creating the complete network object by using the
newff function in the toolbox. The training function
trainlm uses Levenberg-Marquardt algorithm to train
the network, after which you can set the training
parameters in Table 4. Seen from Figure 2, after
eight training, the network performance to meet the
requirements, which is related to the network
structure and learning rate.
Table 4: Training parameters.
training times training goal learning rate
1000 0.001 0.1
Figure 2: Training results.
4.2 Combination of Rough Sets and
Neural Network Methods
Two variables were set for experiment, namely
whether using the improved BP neural network and
whether using the rough set theory was for data
preprocessing. Then four experimental methods
were formed and the four experimental methods
were compared. The results are shown in Table5.
From the research results, we can know that
using the rough set to reduce the attributes of the
initial data can remove the redundant attributes and
reduce the number of training sample attributes.
Then the neural network structure is more concise
and the operation time is reduced. The improved BP
Air Traffic Safety Risk Assessment based on Rough Set and BP Neural Network
867
neural network is obviously superior to the BP
neural network before in terms of time and accuracy.
Combining rough set attribute reduction with neural
network modeling can simplify the model structure
and improve the operation efficiency and accuracy.
It is a scientific and effective method to deal with
such problems.
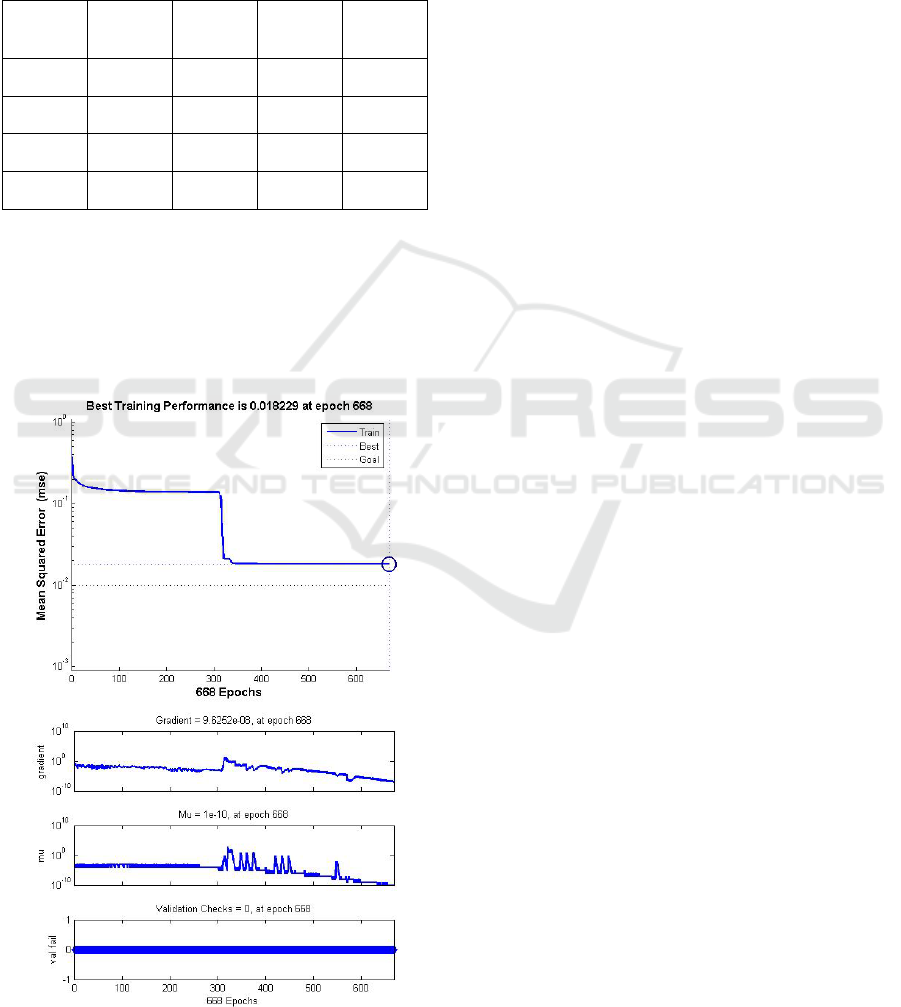
Table 5: Comparison of experimental methods.
Reduction Improved
Training
time
Number of
iterations
Training
error
No Yes 80 1670 0.068
No No 87 2000 0.14
Yes Yes 24 668 0.018
Yes No 41 1000 0.049
4.3 BP Neural Network Test
The neural network training of the data can be seen
from Figure 3. After 668 trainings, the network
performance has reached the requirements. It is
related to the network structure and the learning rate.
Figure 3: Neural network training performance.
Next, we test the trained network and select 5
sets of data as the test input data. The test code is
()
,YsimnetPtest= . The test data is shown in Table
6. According to the European norm theory, the error
of the test result is very small. It can be determined
that the network meets the requirements of air traffic
safety assessment after training.
5 CONCLUSION
Based on the indicator system of security risk
assessment of air traffic control, use the rough set
theory to reduce the influencing factors. It can
reduce the input attributes from 24 to 13, remove the
redundant attributes and simplify the complexity of
the network structure. Improve network training
rate, and get training results more quickly and
accurately. Design a complete BP neural network,
build a learning model, and excavate the potential
relationship within the data. It can be seen from the
test samples that the constructed network can meet
the requirements of air traffic control security risk
assessment, and provide the forecast risk assessment
level objectively and accurately. It is in favour of the
practical work of the ATC.
REFERENCES
Al Basman, M.& Hu, J. 2012, Approaches for stochastic
safety analysis arising in ATM application. Decision
and Control. IEEE, 2012:514-519.
Bruin, T D, Verbert, K.& Babuška, R. 2017, Railway
Track Circuit Fault Diagnosis Using Recurrent Neural
Networks. IEEE Transactions on Neural Networks &
Learning Systems, 2017, 28(3):523.
Cruck, E.& Lygeros, J. 2015, Hybrid modeling for the
evaluation of risk perception by air-traffic controllers.
Control Conference. IEEE, 2015:1278-1283.
Du H, Li H.& Yuan L. 2010, Risk assessment model for
air traffic control based on fuzzy-ANP method. China
Safety Science Journal, 2010, 20(12):79-85. (in
Chinese)
Ge Z.& Sun Z. 2007, Neural Network Theory and
Realization of MATLAB R2007 . Publishing House of
Electronics Industry, 2007
Guo J, Li Y.& Yang C. 2016, Classfication for general
aviation air traffic management operation security
based on gray analytic hierarchy process method.
Safety and Environmental Engineering, 2016,
23(2):162-166. (in Chinese)
Liao Y, Guo J.& Yang C. 2015, Probability assessment of
ATM safety based on bayes analysis. China Science
Paper, 2015(19):2271-2275. (in Chinese)
SE-CLOUD 2018 - Special Session on Software Engineering for Service and Cloud Computing
868
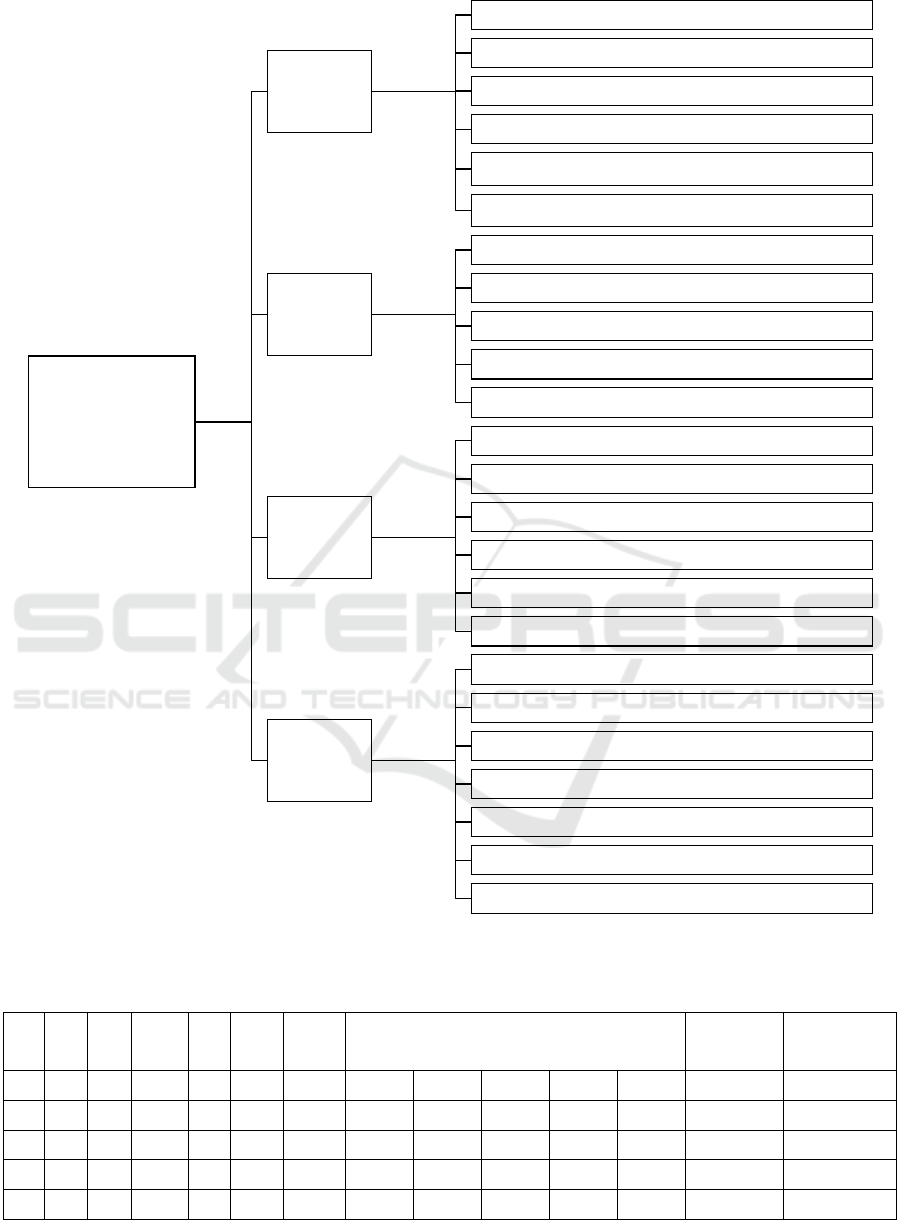
Air traffic safety risk assessment
index system
human factors
equipment factors
environment
factors
management
factors
Controller technical level is not up to standard
Controller psycho logical quality is not up to stand ard
Emergen cy response capacity is not enough
Controller misuses key instructions
Controller or department head safety awareness and sens e of responsibility is not
enough
cooperation of stations or departments is poor
Communication equipment is not working properly
Navigation device is n ot working properly
Monitoring equipment is not working p roperly
ATC system backup and emergency response capacity is not enough
Technical standards oversight
The number and layout of the con trol seats are not reasonable
Seat monitoring means imperfect
Scene monitoring and guidance system is not working properly
Military activities affected
Weath er cond itions and weather d isasters
Impact of airspace restrictions
Management standards oversight
Poo r management practices
Department conflict has hig h frequency and intens ity
Personnel do not agree with organizational g oals
Organizational structure is not reaso nable
Safety education and training sys tem is no t p erfect
Control procedures are not reasonable
Figure 4: Air traffic safety risk assessment index system.
Table 6: Test data.
U X1 X2 X3 ··· X20 X23 output value
expected
value
assessment
level
U1 1 1 3 ··· 3 1 0.11621 0.01528 0.82108 0.08179 0.00001 0 0 1 0 0 3
U2 3 1 3 ··· 1 1 0.01702 0.89169 0.11587 0.00964 0.00051 0 1 0 0 0 2
U3 3 3 1 ··· 3 1 0.04513 0.00079 0.99243 0.00050 0.00242 0 0 1 0 0 3
U4 1 2 2 ··· 2 3 0.17850 0.80827 0.00123 0.01184 0.00706 0 1 0 0 0 2
U5 2 1 2 ··· 2 1 0.88620 0.00984 0.16700 0.00888 0.00096 1 0 0 0 0 1
Air Traffic Safety Risk Assessment based on Rough Set and BP Neural Network
869

Liu W, Wang P.& Sun D. 2010, Forecasting model of
road traffic accident based on improved BP neural
network. Computer Systems and Applications, 2010,
19(10):177-181.
Lu W. 2017, Talking about the concept of safety
management system and popularization in civil
aviation. China High Tech Enterprises, 2017(8):234-
235. (in Chinese)
Luo F, Jia G.& Chen G. 2009, Design and optimization of
index system for the ATC safety risk management.
China Safety Science Journal, 2009, 19(8):115-120.
(in Chinese)
Ma L.& Chang Y. 2017, Highway construction investment
risk evaluation using BP neural network model.
International Conference on Industrial Technology
and Management. IEEE, 2017:154-158.
Shyur, H J. 2008, A quantitative model for aviation safety
risk assessment. Computers & Industrial Engineering,
2008, 54(1):34-44.
Silva, T V D, Monteiro, R V A.& Moura, F A M. et al.
2017, Performance Analysis of Neural Network
Training Algorithms and Support Vector Machine for
Power Generation Forecast of Photovoltaic Panel.
IEEE Latin America Transactions, 2017, 15(6):1091-
1100.
Wang X. 2013, Several rough models and the combination
of rough set and neural network research. University of
Electronic Science and Technology of China, 2013. (in
Chinese)
Wang G, Hu J.& Zhang Q, et al. 2011, Granular
computing based data mining in the views of rough set
and fuzzy set. IEEE International Conference on
Granular Computing. IEEE, 2011:67-67.
Zhang X, Han S.& Yang C. 2016, An fuzzy synthetic
evaluation model for safety risk in air traffic control
based on matter element analysis . Journal of
transport information and Safety. 2016, 34(4):50-56.
(in Chinese)
Zellweger, A G.& Donohue, G L. 2015, Accident Risk
Assessment for Advanced Air Traffic Management.
Minerva Chirurgica, 2015, 14(4):214-5.
SE-CLOUD 2018 - Special Session on Software Engineering for Service and Cloud Computing
870
