RUNAMIC: Dynamic Generation of Personalized Running Routes
Krishna Kumar Thirukokaranam Chandrasekar
1
, Redouane Arroubai
1
, Gerwin Dox
1
, Samnang Nop
1
,
Pieter Stroobant
1
, Jeroen Stragier
2
, Kristof De Mey
3
and Steven Verstockt
1
1
Department of Electronics and Information Systems, Ghent University, Belgium
2
Department of Movement and Sports Sciences & Imec-MICT, Ghent University, Belgium
3
Department of Movement and Sports Sciences, Ghent University, Belgium
Keywords:
Dynamic Routing, Points of Interest (POI) Collection, POI Mapping, Route Poisoning, Personalization,
Feedback, Crowdsourcing.
Abstract:
In this paper, we present a novel mobile running application, Runamic. Runamic allows to generate dynamic
routes, starting from any point in the city, whilst taking user preferences into account. A user can choose how
long he would like to run alongside his preferred points of interest, such as waterways, parks and/or tourist
hotspots. Based on these preferences, the characteristics of the road network/environment and feedback on
previous runs, a route is generated. The suggested routes are smooth, avoiding too many turns and overlapping
route segments. The generated routes can be changed dynamically. After the run, the user has the ability to
rate the generated route, which will influence future route generation. In most cases, the graph and R-tree
based algorithm generates nice smooth routes, leading to very positive user feedback on the dynamic routing
aspect.
1 INTRODUCTION
Recreational running and walking are amongst the
most popular sports in the world. Both activities have
a very low entry-level as anyone can literally go out-
side and just start running or walking. Apart from
these, there are other sport activities such as cycling,
skateboarding, roller skating etc. that are very simi-
lar. People engage themselves in these kinds of sports
activities for variety of reasons, ranging from health
and fitness to fun, entertainment and relaxation. A
wide range of research studies across the years (Ul-
rich, 1979; Mitchell, 2013; Triguero-Mas et al., 2015;
Olafsdottir et al., 2017) portrays the effect of the role
played by the environment, while performing outdoor
activities. Thus, taking time for oneself and exploring
the outdoor whilst not being restricted to a redundant,
not so comfortable environment forms the vital part
of all the above activities. This motivates the need for
personalized routing.
To facilitate navigation and log the running perfor-
mance, a variety of applications and devices are avai-
lable. Routes can be planned in different ways and
using a variety of already existing tools & applicati-
ons. Based on their Route Planning ability, these ap-
plications could be broadly classified into two catego-
ries namely Database based Route Planning and Au-
tomized Route Planning. Of course, instead of using
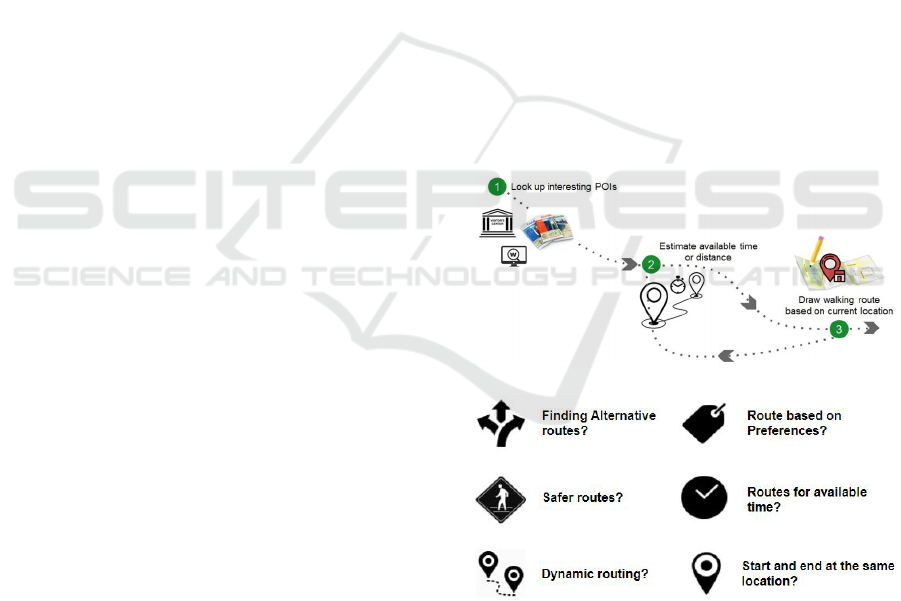
(a)
(b)
Figure 1: (a.) Traditional route planning methodology (b.)
List of problems in traditional route planning applications.
one of these digital tools, users can also consult the
route books or leaflets that are offered by tourist offi-
ces (Figure 1a).
The above mentioned traditional route planners
are useful and definitely facilitate recreational run-
ning and walking, but they all have several problems
98
Chandrasekar, K., Arroubai, R., Dox, G., Nop, S., Stroobant, P., Stragier, J., Mey, K. and Verstockt, S.
RUNAMIC: Dynamic Generation of Personalized Running Routes.
DOI: 10.5220/0006889600980105
In Proceedings of the 6th International Congress on Sport Sciences Research and Technology Support (icSPORTS 2018), pages 98-105
ISBN: 978-989-758-325-4
Copyright © 2018 by SCITEPRESS – Science and Technology Publications, Lda. All rights reserved
limiting the user experience. As shown in Figure 1b,
the user is always limited to a couple of predefined
routes passing by a preselected set of points of inte-
rest (POI). If they want to change these routes (e.g.,
shorten or extend their length), they need to estimate
the time and distance of the new route segments them-
selves. Routes might have been created months or
even years ago which would not be suitable for run-
ning or walking anymore. Furthermore, you have the
lack of themed routes. Users don’t always want to
pass by neighborhoods or parts of the city that look
bland. They would like to have some variation in their
routes so they can be excited and motivated to start a
new run or hike. For example, not many people would
prefer a route near a busy motorway when compared
to a route around a more pleasant neighborhood with
enthralling landscapes (Ulrich, 1979). Thus, it would
be better if people are presented with a list of diffe-
rent themes, allowing to generate a route according
to their preferences. Lastly, the path and route con-
ditions also play a vital role with regards to overall
running experience. Better experiences not only re-
sult in more fun, but have also proven to be a form of
motivation that paves way for an improved interaction
and involvement (Mitchell, 2013).
Manually planning a route takes a lot of time and
may prove to be difficult as the user may not be fa-
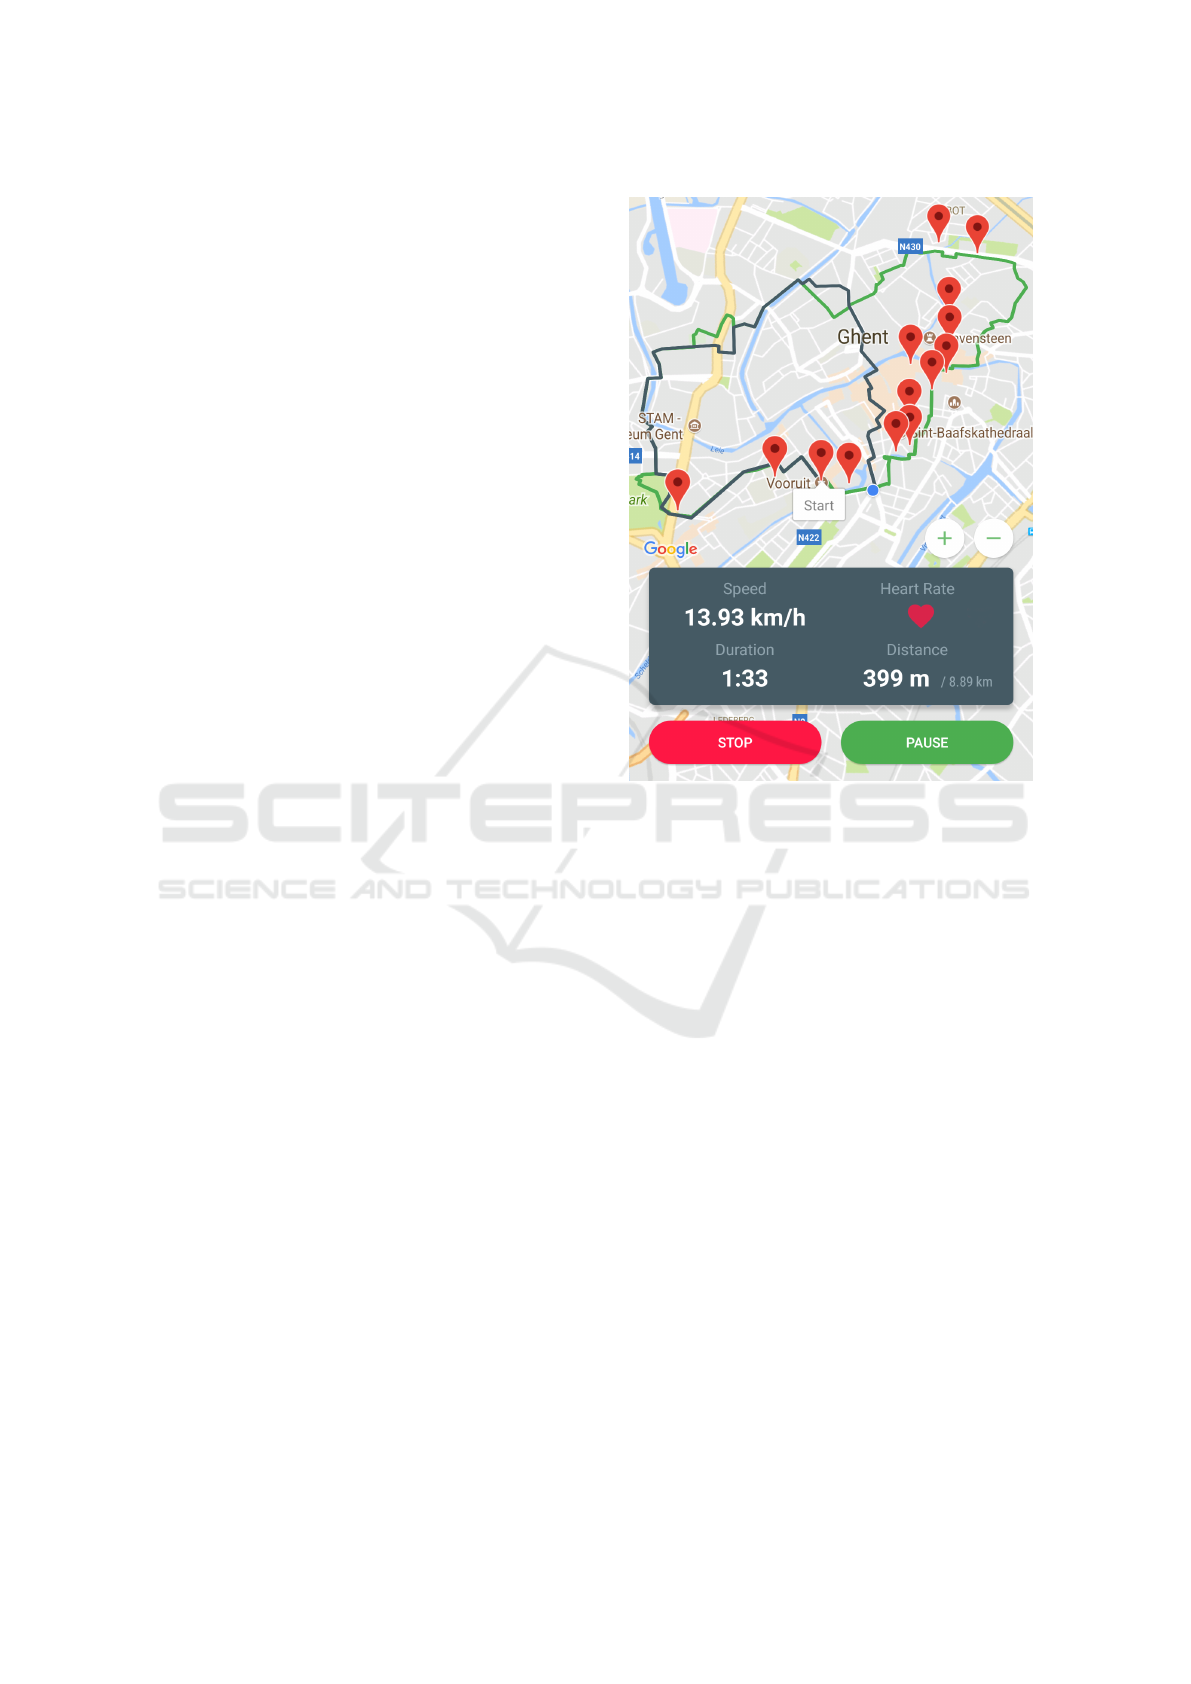
miliar with the region. In this paper we present the
Runamic application, shown in Figure 2, that automa-
tes this tedious process and offers dynamic rerouting
abilities. The remainder of this paper is organized as
follows. The following Section 2 compares the exis-
ting related work in our context of usage. Section 3
presents the different types of data that are used as in-
put for the route generation algorithm. Next, Section
4 presents the routing algorithm and discusses the op-
timizations that were investigated to improve its per-
formance. Subsequently, Section 5 discusses our one-
step process to add new types of (dynamic) POIs and
section 6 focuses on the Android app. Finally, user
engagement and evaluation is covered in section 7 and
section 8 concludes this paper and points out directi-
ons for future work.
2 RELATED WORK
A user can, for example, create a route using a
route plotting application and share this route with
the user base like in (RouteYou, 2017) or the user
can also choose between various databases of predefi-
ned/shared routes such as in (Contours, 2017) for wal-
king or (RunKeeper, 2017; Runtastic, 2017; MapMy-
Run, 2017) for running. Another possibility is to use
Figure 2: Runamic: A Dynamic Route Generation Appli-
cation. The figure shows an active running screen of the
application. The green line segment in the figure denotes
the currently followed running route while the blue one de-
notes a shorter route, requested dynamically during the run.
a smartphone or a GPS tracker to log the runners loca-
tion and upload the route to a database (Gavin Mau-
rice, 2011). Such database based route planning ap-
plications work on high quality existing routes, but
they are inflexible and not personalized. Availability
of these routes may differ strongly between urbanized
and rural areas.
A more intelligent method of planning one’s route
would be a logical choice for the problems discussed
above. Existing automized route planning solutions
have some flexibility, but this is typically limited to
some predefined user profiles (Stroobant, 2016). The
user can draw a route by adding route markers on the
map, which are then connected by a shortest path al-
gorithm that can be configured to prefer or avoid cer-
tain types of roads (PlotARoute, 2017). These types
of methods are not very user friendly for dynamic
changes, since this scheme requires moving/adding
markers while running. Google Maps is also a simi-
lar type of application that gives a simple algorithm-
based point to point route generation, where the user
provides his start position and destination. It is dyn-
amic, yet customisation is still limited to only trans-
RUNAMIC: Dynamic Generation of Personalized Running Routes
99

Figure 3: General workflow of Runamic.
portation modes. Finally, there are applications like
route suggestions in (RouteYou, 2017) and (Route-
Loops, 2017) that generate routes based on the theme
or the preference of the user profile. The route plan-
ning is completely automatic, yet it is not dynamic.
Apart from these existing applications, there are
a number of theoretical solutions such as (Hochmair
and Fu, 2009; Hrncir et al., 2014; Su et al., 2010;
Turverey et al., 2010), that find the shortest path be-
tween two nodes based on user-specified preferences
or properties. Works like (Hrncir et al., 2015; Song
et al., 2014) addresses the multi-criteria aspect of bi-
cycle routing by looking for a set of Pareto optimal
routes. (Storandt, 2012) focuses on the problem of
finding Pareto optimal routes by prioritizing one of
the many routing criteria. This application, on the ot-
her hand uses a weighted combination of criteria to
search for optimal paths between two nodes.
3 RUNAMIC DATA
3.1 Map Data
The first part of the workflow, shown in Figure 3, is
collecting data of the road network and processing
this data so that it can be used within the route gene-
ration algorithm. Open map data of Open Street Map
(OSM, 2018) is utilized to obtain the required nodes
and edges structure of the road network such that an
appropriate city graph could be generated. For acqui-
ring the OSM data of a specific region (e.g., the city
of Ghent), we use the OSM - Osmosis tool (OSM-
OSMOSIS, 2018). This tool serves as an access point
for OSM map data and allows to generate custom se-
lected parts of the OSM-map based on the coordinates
of the bounding box of the preferred region. The re-
sult of this query is the OSM-map data (nodes, ways,
relations and tags) for the selected region that gets
stored in a temporary XML-file. This XML file con-
tains the following elements: Nodes represent locati-
ons or points on the map. Ways represent a polyline
referencing the nodes that exist on the polyline. Tags
describe specific features of map elements (highways,
parks etc). Relations represent relationships that can’t
be described by nodes and ways.
On acquiring the data, pre-processing of the data
is started by filtering out all the roads which are not
suitable for pedestrians. We use the OSM tags as-
sociated with the “highway” tag to filter out all the
unnecessary data. This is done with the help of the
sub tags such as “motorway”, which corresponds to
extremely busy roads that are not suited for pedestri-
ans. Further optimizations, such as using the activity
loggings/heatmaps of a large database of recreational
activities (e.g. RouteYou) are currently under deve-
lopment. The result is saved in a new XML-file which
is then migrated to our PostgreSQL-database. In this
migration step the nodes and the ways are added to
two separate tables as nodes and edges in our data-
base. Since roads can intersect other roads at non-end
nodes, they are transformed by splitting them at inter-
sections before they are added to the database. As a
last step, we also remove intermediary node informa-
tion and only keep the start and ending node of the
segments.
3.2 Points of Interest (POIs)
To solve the lack of information required to generate
themed routes or touristic routes, POIs were added to
the database. Some of the common interest points,
like waterways or green region points, can be acqui-
red from the OSM tags. However, the OSM data
does not have tags for all possible points of interest
in the city. Thus, to enrich the “interest points” data,
a new platform was developed which allow stakehol-
ders to upload their own set of custom POI points in
the provided json structure. For example, the tourist
administration of the city could upload all tourist at-
tractions points as themed sets for specific types of
attractions. The upload to the POI database is also
a simple one step process. Furthermore, additional
tools were also developed for automatically genera-
ting these POI-data from popular existing open data
formats, as further discussed in Section 5.
icSPORTS 2018 - 6th International Congress on Sport Sciences Research and Technology Support
100

Without road burn With road burn.
Figure 4: Comparison of 100 generated routes with and without road burn.
3.3 Mapping POIs to Edges
The POIs are uploaded to the server in the form of
JSON and represented as nodes in the database. Since
nodes cannot refer to ways (roads) directly, these
POIs are stored as locations without any association
to nearby roads. To connect these two elements, we
need to match each of the POI nodes to the closest
way. We realize this by using an R-tree data structure
(Guttman, 1984) by which imaginary bounding boxes
are built around the ways. These boxes form the base
of the R-tree structure. This is used to speed up the
search for the road that is closest to the POI.
4 ROUTE GENERATION
The actual creation of randomized cycles has been im-
plemented as a server application, in order to be able
to deal with increasing map sizes, to report on the
usage, and to improve the running time of the algo-
rithm.
4.1 Basic Generation
The cycle generation algorithm is based on several re-
cent papers (Stroobant, 2016; Stroobant et al., 2018),
which specify how cycles can be generated by first
generating a path from the origin to a random point
at a distance (the “rod”), and then generating a new
path that connects the origin alongside a detour with
the rod (“closing” the rod). This algorithm works in
essence, but a few issues appeared not long after im-
plementation, which are described in the subsequent
subsections.
4.2 Feeding Extra Costs to Prevent
Going Back the Same Way
(Poisoning)
In order to create a detour that isn’t identical to the rod
itself, we mark the rod and the space around it with an
extra cost. The paper (Stroobant, 2016) computes the
distances using a graph search, saving all edges in a
certain radius. This is memory expensive. Instead, the
server uses a linear approximation between the nodes
at 12% and 37% of the rod, since they convey the ge-
neral position and direction of the rod the most accu-
rately. In the second step of the algorithm, only a part
of the rod is reused, and statistically this part is ex-
actly half as long as the original rod. Therefore, the 2
selected nodes are the first and third quartile of the ex-
pected useful sub rod. Additionally, instead of using
a linear function for poisoning, corresponding to
L
perceived
L
actual
= 1 + max
0,
D
max
− D
D
max
· α
we use an exponential decay function for poisoning:
L
perceived
L
actual
= exp
1 −
D
D
max
· α
Originally this change was made to create larger cy-
cles, but this choice also turned out to be the cheaper
option when increasing the coverage.
4.3 Increasing the Coverage
We enhanced Dijkstra’s algorithm (Cormen, 2001)
with Pareto fronts: instead of saving a best cost for
every node in the graph, a vector of Pareto optimal
solutions is stored for every node. This allows us to
use multidimensional cost functions and to find the
RUNAMIC: Dynamic Generation of Personalized Running Routes
101
shortest path from start to end for every linear combi-
nation of the input. This is done because sometimes
the usage of an algorithm only yields routes that are
slightly too large or too small, and adding a second
dimension yields an increased amount of routes with
a higher variance, and thus a higher probability of ge-
nerating a cycle that satisfies our constraints.
As the cost function, we use two randomly cho-
sen instantiations of the hyper parameters, which are
a small distance apart, namely 8% of the total route
length. Larger differences than that will slow down
the execution too much.
4.4 Routing through POI’s
When we try to route through POI’s, a first attempt
would be to reduce the cost of the road that contains
the POI. However, if this road is short, then reducing
the already low cost of going through that road would
not influence the cycle generation. A first attempt to
fix this is to set the cost to a negative value. Unfor-
tunately, in this case the routing algorithm will stop
working, especially when a negative cost cycle is cre-
ated. Alternatively, we could reduce the cost of all
routes close to the POI as well, but this would en-
courage the routing algorithm to route close to the
POI but potentially miss it, which might not be what
we want. So, an alternative technique is proposed:
whenever a POI is hit, a potential cost is saved in the
cost structure, and every subsequent road hit will be
cheapened and the potential cost reduced. This for-
ces the algorithm to route through the POI’s without
introducing negative cycles. In practice, we use a po-
tential with an exponential decay. This has the added
advantage that we can simply approximate the cost
factor using the potential function itself.
4.5 Randomisation
Since we don’t want to navigate the user(s) by the
same routes over and over, we decided to add a rand-
omisation aspect to our routing methodology. At this
point, it is possible to create a random cycle, and if
we look at the randomness from the perspective of the
route itself, we see that most routes only have a small
part in common, and that they are quite distributed.
However, if we look at the randomness from the per-
spective of the distinct roads, we observe that some
roads are included quite often in the routes, while ot-
her roads are never included at all. To address this
issue, we introduce two features:
• The cost of traversing a road in Dijkstra’s algo-
rithm is multiplied with a random number bet-
ween 0.1 and 0.9. This change allows the algo-
rithm to create shortcuts through small alleys;
• Every route creates road burn, i.e., a small cost
that is added to the route segments to avoid repe-
titive usage of a central road.
As shown in Figure 4, this change improved the
seeming randomness of the cycle generation by a
large amount.
5 POI GENERATION AND
UPLOAD
In order to facilitate the generation of POIs and to
easily upload POI datasets to the RUNAMIC server,
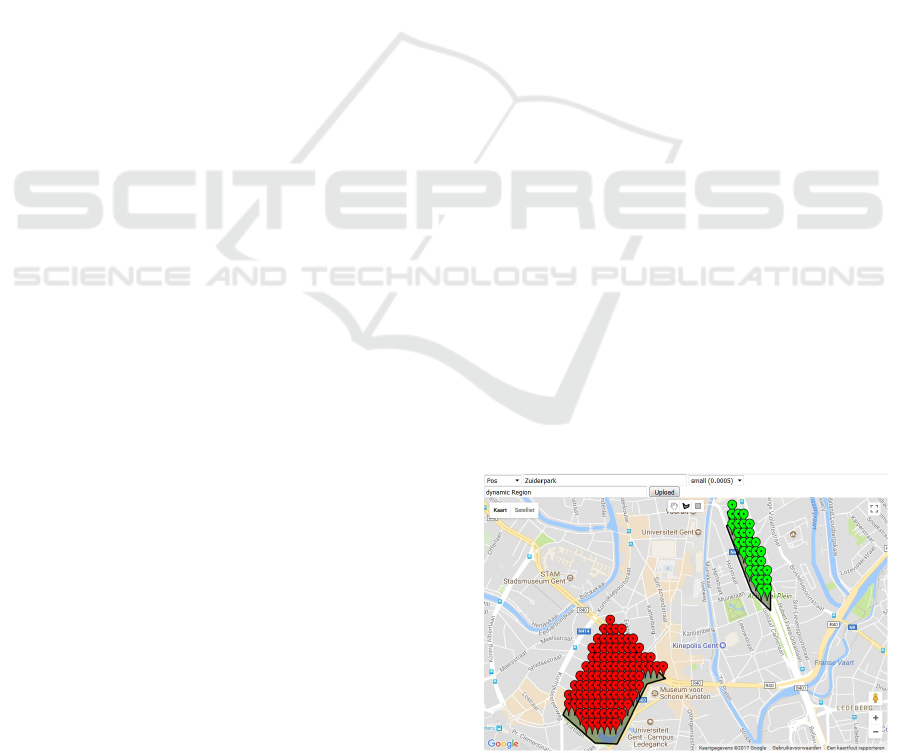
three POI management tools were developed. The
first tool, shown in Figure 5, allows stakeholders to
draw dynamic POI regions (e.g. regions that can only
be run during the day because of safety reasons). Both
positive and negative POI regions can be created and
additional metadata can be added to define the valid-
ness information of the particular polygon or rectan-
gular region.
Subsequently, this tool automatically creates the
POI data (in JSON format) that can be uploaded to our
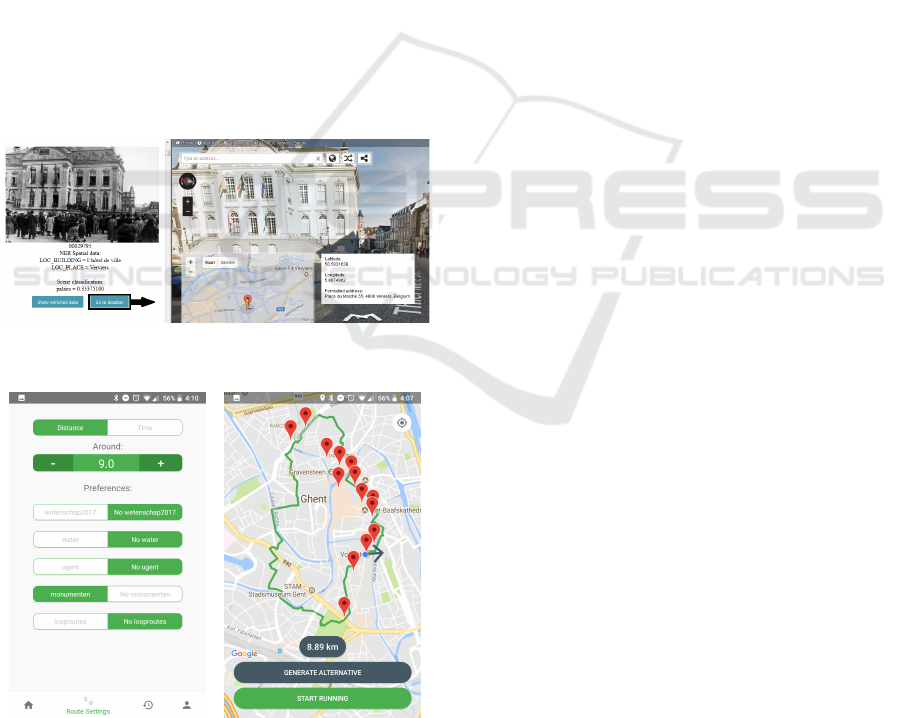
server. The second tool extracts location entities from
text data with a geographic entity recognition (GER)
algorithm and transforms the location data into POI
coordinates using a geocoder. Figure 6 shows some
results of evaluating this tool on a collection of histo-
ric pictures from the CegeSoma dataset. As seen, this
tool allows us to easily map non-spatial data when it
contains sufficient location information in its textual
descriptions. Finally, some scripts were also develo-
ped to automatically generate RUNAMIC POI data-
sets from some popular open data formats (e.g. csv,
kml and geoJSON).
Figure 5: Tool for drawing dynamic POI regions.
icSPORTS 2018 - 6th International Congress on Sport Sciences Research and Technology Support
102
6 ANDROID APPLICATION
To test out and visualize route generation, an Android
application was developed (shown in Figure 7). The
application has been published to the Google Play
Store for user testing and provides all the tools to go
running/walking. Apart from the normal routing ca-
pabilities, the app also allows users to link their heart
rate monitors for a wholesome interaction. The gene-
ral flow of the app is as follows: first there is a main
screen where the map gets rendered. Then there is a
route settings tab where the user specifies his prefe-
rences (Figure 7a) and POIs for the route generation
(Figure 7b). Previous runs are stored in the applica-
tion and get shown in the history tab. Finally, a profile
tab is present, where the user can see all his statistics
(speed,distance,average heart rate) and can change the
settings of the application.
6.1 Route Preferences
The route preferences in the route settings tab consist
of two main elements. The first element is the dis-
tance/time the user would like to run. The user can
Figure 6: Geographic entity recognition (GER) tool to ex-
tract locations from textual metadata of images.
(a) Preference screen (b) Routing screen
Figure 7: (a.) The preferences screen used for obtaining
user preferences. (b.) The main routing screen where the
generated route along with the nearest preferred POI points
are displayed.
choose the preferred time or distance. For the time
parameter, a level system (beginner, intermediate, ex-
pert) which determines the average speed is used. In a
later stage this parameter would be determined based
on the user base, but for now they are default parame-
ters. The second element allows to make a selection
among the available POI themes. When the applica-
tion boots up it requests all the possible POI themes
from the server. The user then chooses which ones he
would like to add to generate his personalized request.
6.2 Route Generation
When the user has chosen the variables for his route,
he can go back to the home screen and generate a
route. The application sends a request to the server
containing the current location and the preferences of
the user. The server then generates a route and sends
it to the application. The body of the response con-
tains all the nodes for the route, directions and the
nearby/used POI nodes. The application renders the
route on the map, and allows the user to generate an
alternative tour. Finally, if the user likes the route he
can start running. While running, the app saves sta-
tistics and provides audio instructions. When the user
finishes, he gets the option to give the route a rating.
The application sends this rating to the server and the
weight of the edges get updated for future route gene-
rations.
6.3 Dynamic Routing
In the application the user has the option to change his
route while running. If a user changes his route, the
application dynamically adapts the planned tour. For
example, if the user takes another turn than instructed,
a new route will be requested continuing from his cur-
rent position but returning to the original end point.
Other actuators for dynamic routing are:
• Heart Rate: When the heart rate of the user rea-
ches a lower level than the minimum threshold, a
longer route gets generated. When the heart rate
of the user reaches a higher level than the maxi-
mum threshold, a shorter route gets generated.
• Average Speed: Similar to the heart rate the route
can be manipulated based on the average speed of
the user.
• Buttons: In the application, the user can also touch
the plus or minus button to increase or decrease
the length of the route dynamically whilst run-
ning.
RUNAMIC: Dynamic Generation of Personalized Running Routes
103
7 EVALUATION
The first version of the application server was tested
using a web-application that was used by the city of
Ghent to navigate to various Ghent University loca-
tions, during the 200 years of Ghent University cele-
brations. Following the enormous support to the ini-
tiative, the android application was formally released
and was made available for download in the Android
Play Store from the 17th of October in order to per-
form a first hand evaluation on user engagement and
performance. The app was limited to the region of
Ghent for feedback and development purposes, but
can easily be expanded to any area. The app had
an extremely welcoming opening with approximately
1000 unique users logging in and using the app in the
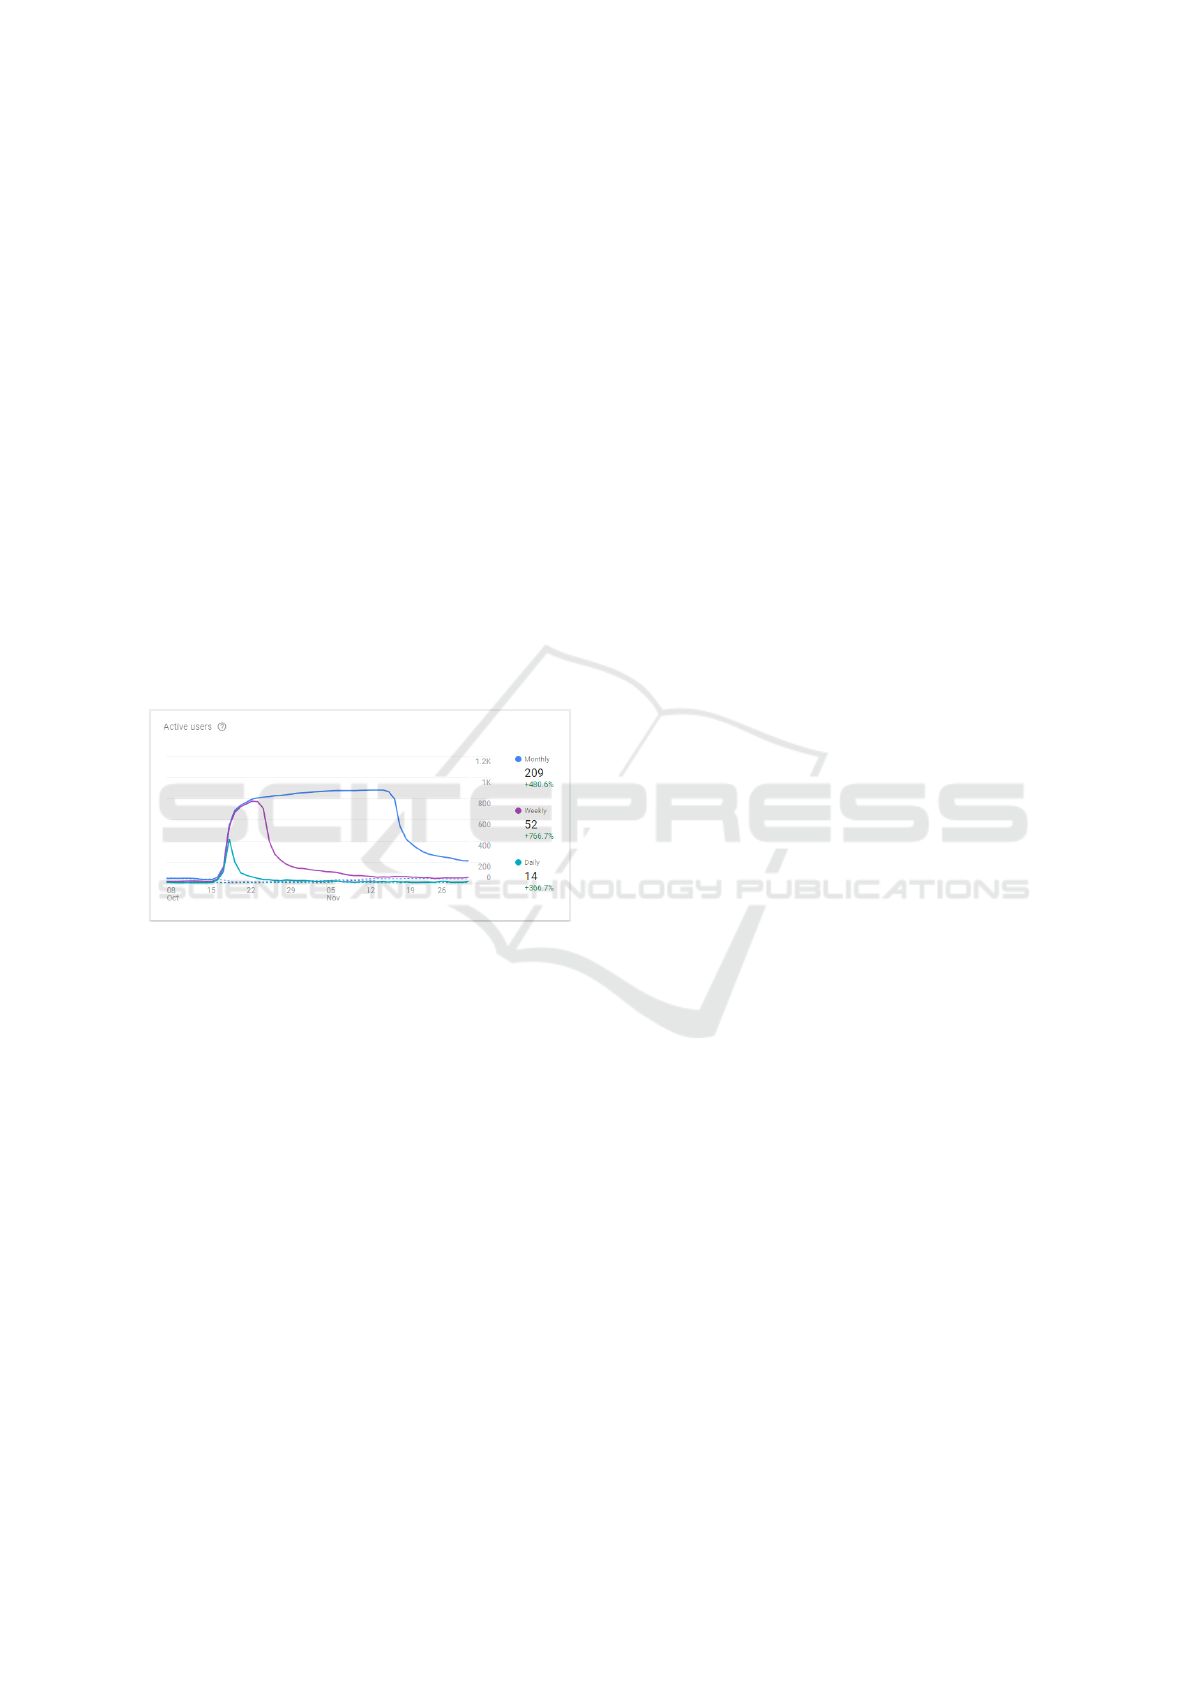
first two months (as can be seen in Figure 8). This in
turn proves the necessity for a more personalized rou-
ting application in performing day to day running and
walking activities. There were people of different age
groups and the feedbacks obtained from them were
greatly positive.
Figure 8: Active Users graph for the first evaluation period.
Between the first two months, there was on an
average 105% increase in the utilization of running
activity of the app. User feedback was crucial in ra-
ting unclassified roads, which makes the application
constantly better. The tool for making POIs was also
an advent of feedbacks. There is a lot more feedback
coming in and evaluations are instrumental for the fu-
ture prospects of the application. A more comprehen-
sive user study has also been planned with the current
set of users to obtain a more introspective review of
the application from the end users.
8 CONCLUSION AND FUTURE
WORK
In this paper we have introduced a mobile application
which allows generation of dynamic routes starting
from any point in the city based on user preferences.
The application has been rolled out for public usage
and its functionalities have been limited to the city of
Ghent for evaluation, testing and developmental rea-
sons. Currently the application contains a collection
of POI datasets covering a variety of themes ranging
from nature (parks, water) to tourism (monumenten)
and special POI themes. In most cases, the graph and
R-tree based algorithm generates nice smooth routes,
leading to very positive user feedback on the dynamic
routing aspect.
Currently, the application supports only one city -
Ghent. In the future it would be expanded to multiple
cities and eventually the whole country. Another wor-
king point would be adding a theme for safety (nega-
tive and positive points of interest) and more interes-
ting points in general. Also, currently the functiona-
lities have been limited to walking and running tasks
but could also be extended to other activities invol-
ving similar routing requirements.
REFERENCES
Contours (2017). Walking in scotland, england, wales, avai-
lable at: https://www.contours.co.uk/.
Cormen, Thomas H.; Leiserson Charles E.; Rivest Ronald
L.; Stein, C. (2001). Section 24.3: Dijkstra’s algo-
rithm. Introduction to Algorithms (Second ed.). MIT
Press and McGrawHill., page pp. 595601.
Gavin Maurice, Ghosh Bidisha; Pakrashi Vikram; Bar-
ton John O’Flynn; Brendan Lawson, A. (2011).
A cycle route planner mobile-app for dublin city.
Irish Transport Research Network Annual Conference
(ITRN2011).
Guttman, A. (1984). A dynamic index structure for spatial
searching. Proceedings of the 1984 ACM SIGMOD in-
ternational conference on Management of data, pages
47–57.
Hochmair, H. H. and Fu, Z. J. (2009). Web based bicycle
trip planning for broward county, florida.
Hrncir, J., Song, Q., Zilecky, P., Nemet, M., and Jakob, M.
(2014). Bicycle route planning with route choice pre-
ferences. ECAI 2014, pages 1149 – 1154.
Hrncir, J., Zilecky, P., Song, Q., and Jakob, M. (2015).
Speedups for Multi-Criteria Urban Bicycle Routing.
In Italiano, G. F. and Schmidt, M., editors, 15th
Workshop on Algorithmic Approaches for Transpor-
tation Modelling, Optimization, and Systems (ATMOS
2015), volume 48 of OpenAccess Series in Informatics
(OASIcs), pages 16–28, Dagstuhl, Germany. Schloss
Dagstuhl–Leibniz-Zentrum fuer Informatik.
MapMyRun (2017). Plan each stride and learn from every
route, available at: https://www.mapmyrun.com.
Mitchell, R. (2013). Is physical activity in natural environ-
ments better for mental health than physical activity
in other environments? Social Science & Medicine,
91:130 – 134.
Olafsdottir, G., Cloke, P., and Vgele, C. (2017). Place,
green exercise and stress: An exploration of lived
icSPORTS 2018 - 6th International Congress on Sport Sciences Research and Technology Support
104

experience and restorative effects. Health & Place,
46:358 – 365.
OSM (2018). Open street map: Open source community
maintaining map data all over the world, available at:
https://www.openstreetmap.org/.
OSM-OSMOSIS (2018). A command line java ap-
plication for processing osm data, available at:
http://wiki.openstreetmap.org/wiki/osmosis.
PlotARoute (2017). Free route planners for outdoor purs-
uits, available at: https://www.plotaroute.com/.
RouteLoops (2017). Start travelling in different cities, avai-
lable at: https://www.routeloops.com/.
RouteYou (2017). Enjoy the nicest routes, available at:
https://www.routeyou.com/.
RunKeeper (2017). Find the best running routes on run-
keeper, available at: https://runkeeper.com/index.
Runtastic (2017). Running, cycling and fitness gps tracker,
available at: https://www.runtastic.com/.
Song, Q., Zilecky, P., Jakob, M., and Hrncir, J. (2014). Ex-
ploring pareto routes in multi-criteria urban bicycle
routing. In 17th International IEEE Conference on In-
telligent Transportation Systems (ITSC), pages 1781–
1787.
Storandt, S. (2012). Route planning for bicycles-exact con-
strained shortest paths made practical via contraction
hierarchy. In ICAPS, volume 4, page 46.
Stroobant, P. (2016). Automatic generation of minimal-
overlapping constrained bicycle routes. Master’s the-
sis, Ghent University.
Stroobant, P., Audenaert, P., Colle, D., and Pickavet, M.
(2018). Generating constrained length personalized
bicycle tours. 4OR.
Su, J. G., Winters, M., Nunes, M., and Brauer, M. (2010).
Designing a route planner to facilitate and promote cy-
cling in metro vancouver, canada. Transportation Re-
search Part A: Policy and Practice, 44(7):495 – 505.
Triguero-Mas, M., Dadvand, P., Cirach, M., Martnez, D.,
Medina, A., Mompart, A., Basagaa, X., Grauleviien,
R., and Nieuwenhuijsen, M. J. (2015). Natural out-
door environments and mental and physical health:
Relationships and mechanisms. Environment Interna-
tional, 77:35 – 41.
Turverey, R. J., Cheng, D. D., Blair, O. N., Roth, J. T.,
Lamp, G. M., and Cogill, R. (2010). Charlottesville
bike route planner. In 2010 IEEE Systems and Infor-
mation Engineering Design Symposium, pages 68–72.
Ulrich, R. S. (1979). Visual landscapes and psychological
wellbeing. Landscape Research, 4(1):17–23.
RUNAMIC: Dynamic Generation of Personalized Running Routes
105
