
Exploring Urban Mobility from Taxi Trajectories: A Case Study of
Nanjing, China
Yihong Yuan and Maël Le Noc
Department of Geography, Texas State University, San Marcos, TX, U.S.A.
Keywords: Taxi Trajectories, Time Series Analysis, Urban Dynamics, Big Geodata.
Abstract: Identifying urban mobility patterns is a crucial research topic in geographic information science,
transportation planning, and behavior modeling. Understanding the dynamics of daily mobility patterns is
essential for the management and planning of urban facilities and services. Previous studies have utilized taxi
trajectories collected from the Global Positioning System (GPS) to model various types of urban patterns,
such as identifying urban functional regions and hot spots. However, there is limited research on how the
results of these studies can be used to inform real-world problems in urban planning. This research examines
the development of sub-centers in Nanjing, China based on Taxi GPS trajectories. The results indicate a clear
separation between the urban center and the sub-centers. In addition, we also clustered the time series of taxi
pick-up locations to model dynamic urban movement and identify outlier patterns. The results demonstrate
the importance of considering human mobility patterns in identifying urban functional regions, which
provides valuable input for urban planners and policy makers.
1 INTRODUCTION
In recent decades, modeling human mobility patterns
has become an important research topic in various
fields such as computational physics, urban planning,
Intelligent Transport Systems (ITS), and Geographic
Information Science (GIS). The growing availability
of location-aware devices, such as the Global
Positioning System (GPS) receivers and smart phones
has provided new challenges and opportunities for
planners and policy makers to analyze, model, and
predict human mobility patterns (Chen et al., 2015).
Commonly used datasets include (but are not limited
to) georeferenced mobile phone data (Ahas, 2005;
Calabrese et al., 2013), location-based social media
check-ins (Cao et al., 2015; Lee et al., 2016),
Bluetooth tracking data (Delafontaine et al., 2012),
and floating car GPS locations (Ge et al., 2017, Jiang
et al., 2009). Among these datasets, GPS-enabled
floating cars are particularly effective at capturing
intra-urban mobility patterns across street networks
due to their high spatial precision and sampling
resolution (Jiang and Zhang, 2018; Yang et al., 2018;
Hu et al., 2018; Ge et al., 2017). In practice, floating
cars are often observed as taxis or shared rides in
many cities, where each floating car periodically
records its coordinates via a GPS receiver and stores
the information in a central server (Liu et al., 2012).
Previous studies have used taxi GPS data to
analyze human mobility patterns from both the
individual and urban perspectives (Atmaji and Sig,
2016; Castro et al., 2013; Chen et al., 2017; Cui et al.,
2016; Fanhas and Saptawati, 2016). On the one hand,
many individual-oriented studies focused on the
morphology and internal characteristics of taxi
trajectories and its implication for refining traditional
mobility models, such as modifying the power law
distribution under a given spatio-temporal context
(Jiang et al., 2009). These studies provided
quantitative support to better understand urban
dynamics and to help maintain sustainable mobility in
urban systems. For example, Santi et al., (2014)
quantified the benefit of ridesharing by translating
spatio-temporal sharing problems into a graph-
theoretic framework.
On the other hand, studies also investigated how
taxi trajectories revealed the characteristics of urban
functional regions and the interactions between urban
areas (Mazimpaka and Timpf, 2015; Tang et al.,
2015; Hu et al., 2014). For example, Liu et al., (2016)
used taxi GPS data to analyze the spatial interaction
patterns between parcels, as well as the real-time land
use patterns reflected by the interaction.
Yuan Y. and Le Noc M.
Exploring Urban Mobility from Taxi Trajectories: A Case Study of Nanjing, China.
DOI: 10.5220/0006891203020307
In Proceedings of the 7th International Conference on Data Science, Technology and Applications (DATA 2018), pages 302-307
ISBN: 978-989-758-318-6
Copyright
c
2018 by SCITEPRESS – Science and Technology Publications, Lda. All rights reserved
Although recent studies have provided valuable
input to advance the theories and methods in
modeling urban mobility patterns from taxi
trajectories, few studies have directly connected their
empirical results to real-world planning problems and
challenges that cities face, nor have they used the
results to validate a planning policy that has actually
been implemented. As such, this study is conducted
from a problem-driven instead of a data-driven
perspective. It is motivated by the 1991-2010
development and planning agenda published by the
local government of Nanjing, China (Nanjing City
Council, 1995), where the city reviewed challenges of
over-crowded central business areas (CBD) and the
associated imbalance in urban resources. The city
proposed to rapidly grow several suburbs of Nanjing
as functional sub-centers for local residents. This
research utilizes one-week taxi GPS data from 2010
to address the following research questions:
Spatially, are there established functional sub-
centers in Nanjing as proposed in the development
plan? If so, how does this multi-center urban
structure affect the distance and direction
distribution of taxi trips in Nanjing?
Temporally, how should the mobility dynamics of
urban functional regions be modeled? Are there
any regions with outlier time series?
2 RESEARCH RESIGN
2.1 Data
The dataset utilized in this research is obtained from
Nanjing City, China. Nanjing is the capital of Jiangsu
province, situated in the Yangtze River Delta Region
in China. With an administrative area of 6,600 km
2
and a total population of over 8 million, Nanjing is
the second largest city in eastern China and is well
known for being a major cultural, economic, tourist,
and transit center.
The dataset used in this research contains
approximately 135 million GPS locations of 7,194
taxis between June 4, 2010 and June 10, 2010. In
addition to GPS coordinates, the dataset also includes
a unique identifier (ID) for each taxi, a unique ID for
each record, the timestamp for when the location was
logged, driving speed, driving direction, and the
current status of the taxi, where 0 indicates that the
taxi is free to pick up passengers and 1 indicates that
the taxi is currently occupied. The sampling
resolution is between 15 to 30 seconds. On average,
there are 4,666 records per day per taxi. Table 1
provides a sample record of our dataset.
Table 1: A sample taxi record.
Record ID
10000000
Taxi ID
13451852779
Longitude
118.779696
Latitude
32.025413
Speed (km/h)
25
Direction
(degree)
50
Status
1
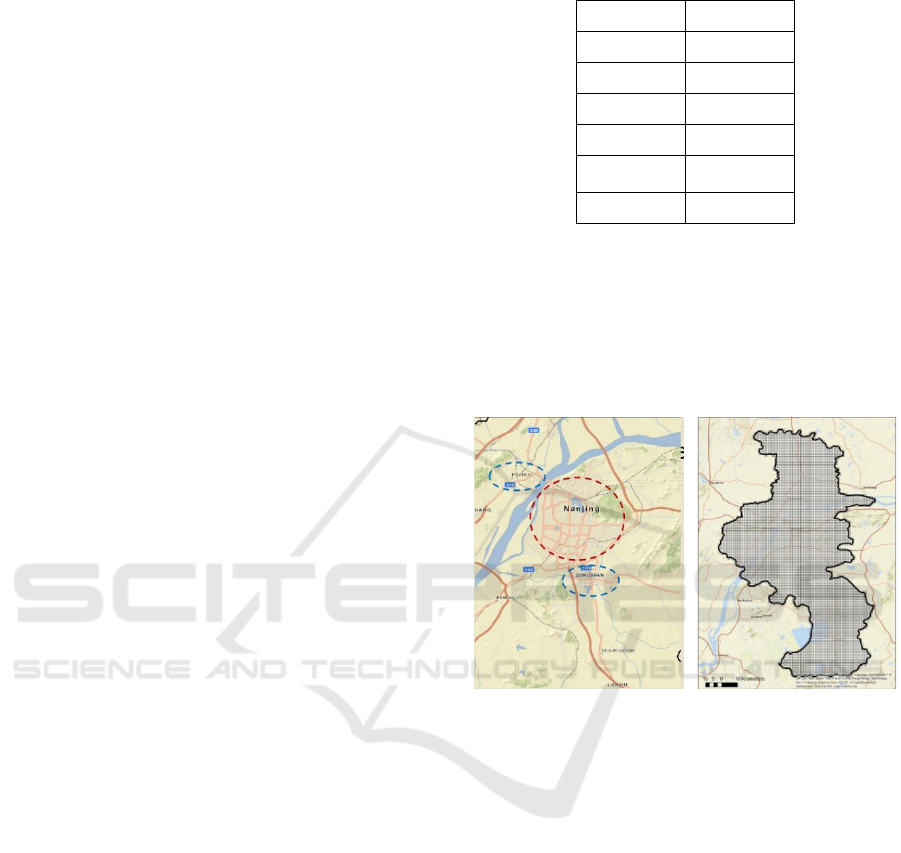
Figure 1a shows the administrative boundary of
our study area. To facilitate the analysis, we divided
the study area into 1km*1km grid cells. Figure 1b
shows the approximate main urban center in Nanjing
(in red) and two close-by sub-centers (in blue): Pukou
district in the northwest and Dongshan district in the
south.
(a) (b)
Figure 1: Study area. (a) 1km*1km grid cells; (b) Urban
center and sub-centers.
2.2 Methodology
2.2.1 Preprocessing Data and Calculating
Spatial Indicators
Previous studies have used the number of taxi trips to
represent the activeness of an urban area (Ferreira et
al., 2013). In this study, we identify the pick-up and
drop-off points of each trip based on the “occupied”
status field in the original data. Over 1.3 million trips
were extracted. For each trip, we calculate the travel
distance between the pick-up and the drop-off points,
as well the travel direction as defined in Figure 2.
Note that in this study we are interested in how the
origination of taxi trips helps explain the delineation
of sub-centers in Nanjing, so we only consider the
pick-up points in each grid cell.
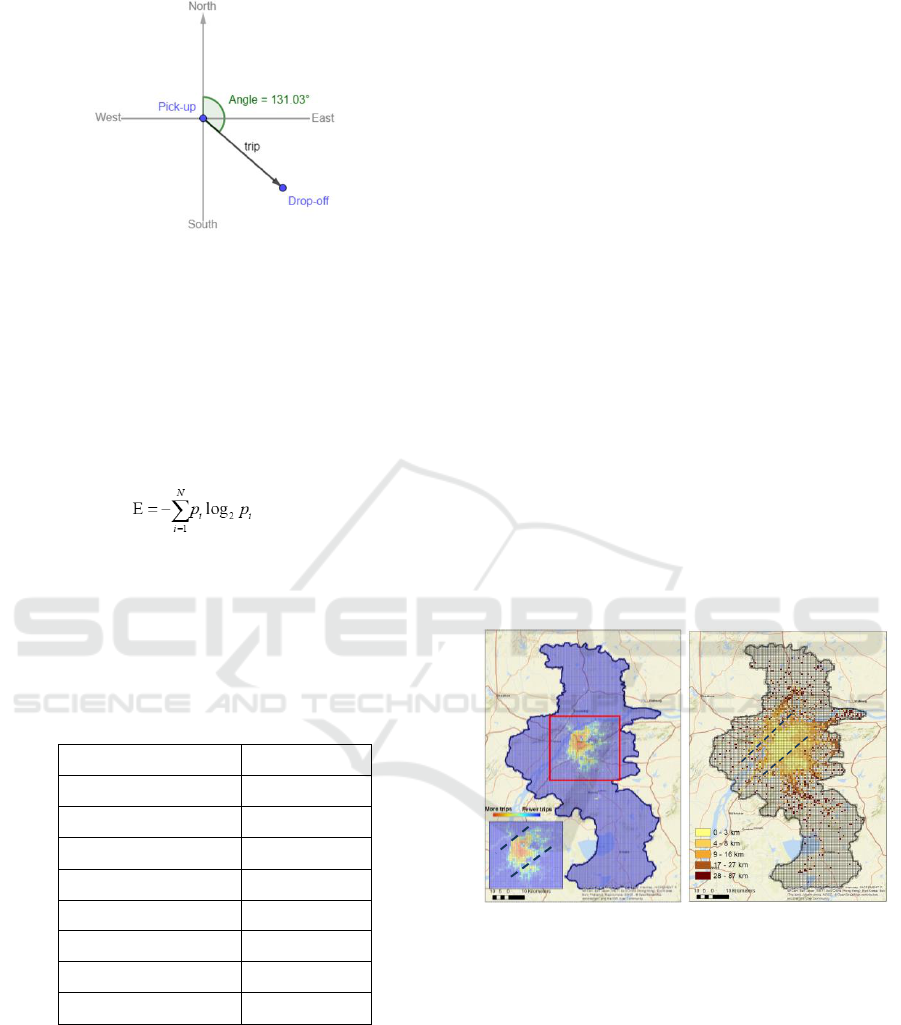
Figure 2: Calculate travel direction.
The number of pick-ups and the median travel
distance represent the magnitude and the scale of
mobility originated from different urban areas. In
addition, we are also interested in how travel direction
provides informative input for the urban structure in
Nanjing. A direction entropy indicator is defined to
present the randomness of travel directions. The
formula is derived as follows:
(1)
Where p
i
refers to the percentage of trips going to a
given direction, and N stands for the total number of
directions (Table 2). For simplicity, we divided the
space into eight directions. The direction entropy is
considered an indicator for the consistency of travel
directions.
Table 2: Define eight travel directions.
Direction
Angle
North-Northeast
[0,45)
Northeast-East
[45,90)
East-Southeast
[90;135)
Southeast-South
[135;183)
South-Southwest
[180;225)
Southwest-West
[225;270)
West-Northwest
[270;315)
Northwest-North
[315;360)
2.2.2 Modeling Temporal Patterns
In addition to the spatial heterogeneity of human
mobility, previous studies also explored urban
functional regions based on temporal variations of
activities. The second analysis of this study explores
how the number of pick-ups varies at different times
of the day. We aggregate the number of trips for each
grid cell by hour and use a dynamic time warping
(DTW) algorithm to measure the similarity of hourly
mobility patterns between grid cells. DTW has
proven to be robust to distortion in time series (Yuan
and Raubal, 2012, Zhang et al., 2008), so it allows us
to group similar patterns and identify outlier patterns.
3 PRELIMINARY RESULTS
3.1 Exploring Urban Sub-Centers
Figure 3a shows the density distribution of taxi pick-
ups. As expected, most trips originate from the urban
center; however, the Dongshan sub-center also
demonstrates a cluster of pick-up points. The other
sub-center, Pukou, has substantially lower densities
of pick-up points. Figure 3b shows the distribution of
median trip length by grid cell. As can be seen, the
results map shows three delineated areas, and there is
a clear division between sub-centers and the city
center, where taxi trips get longer for places farther
away from the city center or a sub-center. This
demonstrates an evident separation of urban
functional regions, where residents can take a short
trip (i.e., 0-3km) for their daily needs inside each
center or sub-center.
(a) (b)
Figure 3: Spatial distribution of taxi trips (the dashed lines
delineate the urban center and the sub-centers). (a) Density
of pick-ups; (b) Median travel distance.
To verify this finding, we also calculated the
direction entropy for each grid cell. As discussed in
Section 2.2.1, direction entropy represents the
randomness of movement direction. A lower entropy
for a given cell indicates that trips from this cell
follow a more unified moving direction. Similar to
Figure 3b, Figure 4 also demonstrates a clear division
between the urban center and sub-centers, where trips
originate from the central area are likely to go to
different directions (i.e., with a high direction
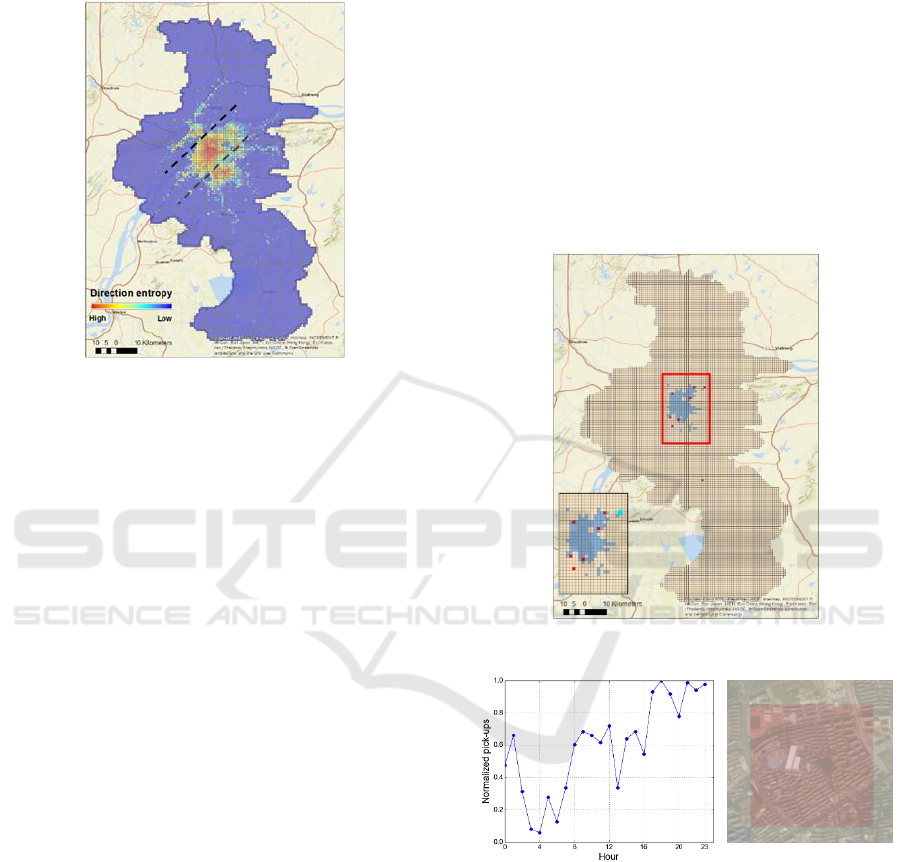
entropy), but trips that start from the border of urban
centers follow a more unified direction, as they are
mostly going into the urban center/sub-center.
Figure 4: The distribution of direction entropy.
3.2 Temporal Variations of Urban
Trips
As discussed in Section 2.2.2, we aggregate the
number of pick-ups by hour for each grid cell, so each
cell is associated with a 24-hour time series showing
the temporal pattern of taxi pick-ups. To ensure data
quality, here we only consider cells that average more
than ten pick-ups per hour. For each cell, the hourly
pick-ups values are divided by the maximum of the
24 hourly values. This standardizes the magnitude of
data and helps with investigating the internal structure
of each time series (Yuan and Raubal, 2012). Based
on the DTW algorithm described in Section 2.2.2, we
construct the distance matrix for the relative time
series associated with each grid cell. The output is a
distance matrix D, in which D
ij
represents the DTW
distance between cell i and j. Based on the DTW
matrix, we conducted a hierarchical clustering
analysis to identify outlier time series. There are
several methods to set the number of clusters in
hierarchical clustering. As an example analysis, here
we adopt the criteria discussed in Mardia et al., (1979),
where numCluster = max(2; sqrt(n/2)), n is the
number of cells. Here outliers are defined as clusters
with fewer than 3 cells.
Figure 5 shows the clustering results, where red
indicates outliers and blue are regular cells with more
than 10 pick-ups per hour. Figure 6a shows the time
series of pick-ups from an example outlier cell
(highlighted in the inset map of Figure 5). As can be
seen, the number of taxi pick-ups increases during
night hours. The background imagery in Figure 6b
shows that this cell covers a residental neiborghood,
and the increasing night hour pick-ups are not
consistent with common sense, where more residents
should arrive instead of depart home during night
hours. The result demonstrates that more detailed
activity patterns need to be investigated in follow-up
studies. For example, it is possible that many
residents in this area work during night hours, or there
may be recereational events that attract people to go
out at night. This example demonstrates the
effectiveness of our methods in capturing fine-scale
activity patterns that may not be reflected by basic
land use satelite imagery.
Figure 5: Outlier cells.
(a)
(b)
Figure 6: An example outlier cell. (a) 24-hour time series of
pick-ups; (b) Satellite imagery.
4 CONCLUSIONS
This study examined the urban mobility patterns in
Nanjing, China based on taxi GPS trajectories. We
analyzed the distribution of pick-up locations, travel
distance, and travel direction. All three indicators
demonstrate a clear division between the city center

of Nanjing and the sub-centers. The result can be used
to support and examine the development agenda of
Nanjing City Council, where city officials proposed
to further grow sub-centers to release the pressure
from the central business area. In addition, we also
explored the temporal dynamics of different urban
regions based on a DTW algorithm. The extracted
outliers demonstrated the importance of
incorporating human mobility and activity data to
refine small-area land use classification. Further
research can focus on incorporating more indicators
from the taxi trajectories to improve the accuracy of
the analysis. It is also important to cross-validate the
results with other public data, such as census and
urban demographic data. Also, further research may
involve extending the study period to analyze
seasonal time series patterns when the data becomes
available. The methodology discussed in this paper
can be applied to other cities to identify urban
functional regions and provide useful input for policy
makers.
REFERENCES
Ahas, R. 2005. Mobile phones and geography: Social
Positioning Method. Power over Time-Space:
Inaugural Nordic Geographers Meeting. Lund,
Sweden.
Atmaji, F. T. D. & Sig, K. Y. 2016. Mining the GPS big
data to optimize the taxi dispatching management. 2016
4th International Conference on Information and
Communication Technology (ICoICT).
Calabrese, F., Diao, M., Di Lorenzo, G., Ferreira, J. & Ratti,
C. 2013. Understanding individual mobility patterns
from urban sensing data: A mobile phone trace
example. Transportation Research Part C-Emerging
Technologies, 26, 301-313.
Cao, G., Wang, S., Hwang, M., Padmanabhan, A., Zhang,
Z. & Soltani, K. 2015. A scalable framework for
spatiotemporal analysis of location-based social media
data. Computers, Environment and Urban Systems, 51,
70-82.
Castro, P. S., Zhang, D. Q., Chen, C., Li, S. J. & Pan, G.
2013. From Taxi GPS Traces to Social and Community
Dynamics: A Survey. ACM Computing Surveys, 46.
Chen, B. Y., Yuan, H., Li, Q., Shaw, S.-L., Lam, W. H. K.
& Chen, X. 2015. Spatiotemporal data model for
network time geographic analysis in the era of big data.
International Journal of Geographical Information
Science, 1-31.
Chen, Z. L., Gong, X. & Xie, Z. 2017. An analysis of
movement patterns between zones using taxi GPS data.
Transactions in GIS, 21, 1341-1363.
Cui, J. X., Liu, F., Janssens, D., An, S., Wets, G. & Cools,
M. 2016. Detecting urban road network accessibility
problems using taxi GPS data. Journal of Transport
Geography, 51, 147-157.
Delafontaine, M., Versichele, M., Neutens, T. & Van De
Weghe, N. 2012. Analysing spatiotemporal sequences
in Bluetooth tracking data. Applied Geography, 34,
659-668.
Fanhas, R. S. & Saptawati, G. a. P. 2016. Discovering
Frequent Origin-Destination Flow from Taxi GPS Data.
Proceedings of 2016 International Conference on Data
and Software Engineering (ICoDSE).
Ferreira, N., Poco, J., Vo, H. T., Freire, J. & Silva, C. T.
2013. Visual Exploration of Big Spatio-Temporal
Urban Data: A Study of New York City Taxi Trips. Ieee
Transactions on Visualization and Computer Graphics,
19, 2149-2158.
Ge, W., Shao, D., Xue, M., Zhu, H. & Cheng, J. 2017.
Urban Taxi Ridership Analysis in the Emerging
Metropolis: Case Study in Shanghai. Transportation
Research Procedia, 25, 4916-4927.
Hu, X. W., An, S. & Wang, J. 2014. Exploring Urban Taxi
Drivers' Activity Distribution Based on GPS Data.
Mathematical Problems in Engineering, 708482.
Hu, X. W., An, S. & Wang, J. 2018. Taxi Driver's Operation
Behavior and Passengers' Demand Analysis Based on
GPS Data. Journal of Advanced Transportation,
6197549.
Jiang, B., Yin, J. J. & Zhao, S. J. 2009. Characterizing the
human mobility pattern in a large street network.
Physical Review E, 80, 021136-1 - 021136-11.
Jiang, W. W. & Zhang, L. 2018. The Impact of the
Transportation Network Companies on the Taxi
Industry: Evidence from Beijing's GPS Taxi Trajectory
Data. IEEE Access, 6, 12438-12450.
Lee, J. H., Davis, A. W., Yoon, S. Y. & Goulias, K. G.
2016. Activity space estimation with longitudinal
observations of social media data. Transportation, 43,
955-977.
Liu, X., Kang, C. G., Gong, L. & Liu, Y. 2016.
Incorporating spatial interaction patterns in classifying
and understanding urban land use. International
Journal of Geographical Information Science, 30, 334-
350.
Liu, Y., Kang, C. G., Gao, S., Xiao, Y. & Tian, Y. 2012.
Understanding intra-urban trip patterns from taxi
trajectory data. Journal of Geographical Systems, 14,
463-483.
Mardia, K. V., Kent, J. T. & Bibby, J. M. 1979. Multivariate
analysis, London & New York, Academic Press.
Mazimpaka, J. D. & Timpf, S. 2015. Exploring the
Potential of Combining Taxi GPS and Flickr Data for
Discovering Functional Regions. AGILE 2015:
Geographic Information Science as an Enabler of
Smarter Cities and Communities, 3-18.
Nanjing City Council. 1995. The development agenga of
Nanjing: 1991-2010 [Online]. Available:
http://www.njghj.gov.cn [Accessed].
Santi, P., Resta, G., Szell, M., Sobolevsky, S., Strogatz, S.
H. & Ratti, C. 2014. Quantifying the benefits of vehicle
pooling with shareability networks. Proceedings of the

National Academy of Sciences of the United States of
America, 111, 13290-13294.
Tang, J. J., Liu, F., Wang, Y. H. & Wang, H. 2015.
Uncovering urban human mobility from large scale taxi
GPS data. Physica A-Statistical Mechanics and Its
Applications, 438, 140-153.
Yang, Z., Franz, M. L., Zhu, S. J., Mahmoudi, J., Nasri, A.
& Zhang, L. 2018. Analysis of Washington, DC taxi
demand using GPS and land-use data. Journal of
Transport Geography, 66, 35-44.
Yuan, Y. & Raubal, M. Extracting dynamic urban mobility
patterns from mobile phone data. Geographic
Information Science - 7th International Conference,
2012 Columbus, USA. Lecture Notes in Computer
Science, Springer, 354-367.
Zhang, B., Yan, K., Jiang, S. & Wei;, D. 2008. Walking
Stability Analysis by Age Based on Dynamic Time
Warping. IEEE International Conference on Computer
and Information Technology.
