
Testing of Power Abilities in High Level Soccer Players: Quantitive
and Qualitive Assessment Methods
Anna Zakharova, Anastasia Berdnikova and Kamiliia Mekhdieva
Institute of Physical Education, Sport and Youth Policy, Ural Federal University named after the first President of Russia
B.N. Yeltsin, 19 Mira Street, Yekaterinburg, Russia
Keywords: Power Abilities, Wingate-test, Performance Analysis for Vertical Jumps, High Level Soccer Players.
Abstract: The aim of the study was to evaluate power in high level soccer players by means of Wingate cycling test
and performance analysis for vertical jumps. Thirty-two male professional soccer players (mean age
25.29±5.4 years, height 180.22±6.63 cm, weight 73.8±7.07 kg) underwent Wingate test and jump tests with
the use of force plate with ongoing analysis of four types of jumps (countermovement jumps, squat jumps,
single leg jumps on the right and left legs, CMJs with arms swing). We found: (i) high-level soccer players’
norms are PP>13 W/kg, AP
30
/kg>11W/kg; (ii) 34.5% of studied athletes demonstrated high level of power;
AP
30
/kg>11W/kg showed only 13.79%; 10.34% showed significant power decrement by 30
th
second of
Wingate-test (∆Р
15
/kg–Р
30
/kg>4W/kg); (iii) countermovement jump height was 35.94±4.2 cm, height of the
jump with additional arms swing was 44.72±5.04 cm; (iv) motor disbalance of antagonist muscle work of
lower extremities; (v) parameter of average power in Wingate test correlated with height (r=.476, P<0.01),
flying time (r=.463, P<0.01), maximum force for take-off (r=.393, P<0.05) in countermovement jump with
arms swing. Anaerobic Wingate test and performance analysis for vertical jumps allow estimation of
athletes’ fitness weak aspects and undertaking appropriate timely amendments to trainings.
1 INTRODUCTION
Strength, speed and power are human physical
abilities which are extremely important in sport:
• Strength determines the level of success in
majority kinds of sport;
• Speed and strength are interdependent abilities
that together provide fast movements herewith
motor effectiveness depends upon speed-
strength intercommunion.
• Power is the ability to apply force in as short
time as possible, as in accelerating, throwing,
shooting, etc.
Power abilities are more challenging for athlete
and more demanding in team sports than strength
alone. We mean them challenging because of (1)
neural factors limiting the ability of explosive push-
offs; (2) great number of movement patterns to
demonstrate these abilities and (3) athlete capacity to
utilize their strength in tests and what is more
important in professional sport activity. This
capacity is gained through motor skills learning at
early stages of training and called movement culture.
We mean power abilities demanding because of
vast of sprints and jumps during the sport game
performance.
Strength and power assessment in sport is
provided by a number of methods: tests without
measuring equipment (Cissik, 2012), direct (by
dynа- and tenzometry) and indirect methods
(through accelerations) to get main (instantaneous
and average force), integral (force impulse) and
differential (force gradient) strength parameters
(Guba and Presniakov, 2017). Since power abilities
have complex manifestation the task of the coach is
to assess the values and determine deficiencies in
athlete.
The purpose of the research was to evaluate
power in high level soccer players by means of two
methods: cycling Wingate test and performance
analysis for different vertical jumps on
tenzoplatform.
Zakharova, A., Berdnikova, A. and Mekhdieva, K.
Testing of Power Abilities in High Level Soccer Players: Quantitive and Qualitive Assessment Methods.
DOI: 10.5220/0006900101110118
In Proceedings of the 6th International Congress on Sport Sciences Research and Technology Support (icSPORTS 2018), pages 111-118
ISBN: 978-989-758-325-4
Copyright © 2018 by SCITEPRESS – Science and Technology Publications, Lda. All rights reserved
111

2 ORGANIZATION AND
METHODS
Subjects. Thirty-two healthy male high-level soccer
players (mean age 25.29±5.4 years, height
180.22±6.63 cm, weight 73.8±7.07 kg) participated
in the study. Recruited subjects were members of
professional soccer teams “Ural-2” and “Sinara”
(Sverdlovsk region, Russia).
“Ural-2” is a reserve of team of FC “Ural”
(Yekaterinburg, Russia). The core team “Ural”
participates in the National championship and holds
6th place in the Russian Football Premier-League.
Members of “Ural-2” are young soccer players
aged 19-23. In the current season 2017/2018 they
hold of Russian championship among Professional
Football League teams.
Soccer team “Sinara” is a regular participant of
Russian Futsal Championship and holds a large
number of cups and titles. It was the winner of
UEFA Cup (2008), Russian Cup (2007), Eremenko
Cup (2015), National championship (2009-2010). In
the current season 2017/2018 “Sinara” is on the 3th-
5th place of Russian Futsal championship. Players of
“Sinara” are frequently invited in the National team
for participation in international competitions. In
2018 UEFA Cup two players of “Sinara” won
bronze medals as part of the National team.
The participants of the study had more than 10
years of sport experience in soccer. All tested
athletes were free of neurological, cardiovascular or
any other chronic disease, and were admitted to
perform the tests by team doctor. The investigation
conforms to the principles of the Declaration of
Helsinki of the World Medical Association. Subjects
involved in the study had been provided with
comprehensive information on the procedures,
methods, benefits and possible risks before their
written consent was obtained. The study protocol
was approved by the Ural Federal University Ethics
Committee (#03-2018).
All undertaken tests were conducted in the
research laboratory “Sports and health technologies”
of the Institute of Physical education, sports and
youth policy, Ural Federal University
(Yekaterinburg, Russia).
2.1 Anthropometric Measurements
Evaluation of anthropometric parameters, body
composition, height, lean muscle mass (absolute and
relative values), body fat component and BMI are
commonly used in professional sport practice and
research. Monitoring of anthropometric parametres
during the competition season permits to amend
nutrition of soccer player saving optimal fat and
muscle ratio. It is well-known that there is a range of
specific criteria of anthropometric parameters for
each playing position in soccer, as well as in futsal
players.
Weight and segment body composition were
measured with the use of the MC-980MA Plus Multi
Frequency Segmental Body Composition Monitor
(TANITA, Japan) based on the advanced Bioelectric
Impedance Analysis (BIA) technology. The
following parameters were registered: body mass
(kg), body mass index (BMI, kg/m
2
), muscle mass –
absolute and relative values (kg; %), absolute and
relative fat mass (kg; %), fat free mass (kg), bone
mass (kg), separately lean mass of the trunk, upper
and lower extremities (kg). Special attention was
paid to weight asymmetry.
2.2 Cycling Wingate Test
Cycling Wingate test was conducted with the use of
the ergometer BIKE MED (TechnoGym, Italy) and
Cardio Memory software V 1.0 SP3. Power and
speed abilities were estimated during leg cycling
Wingate anaerobic test by means of the device
producer protocol provided.
Before the test athletes were familiarized with
the technique of the test and given comprehensive
instructions on the procedure. The position of cycle
seat was adjusted in accordance with the height and
lower limbs length. Foots were fixed in the pedals
with straps. Data about the age, gender and weight
of the tested player were entered into cycle computer
manually. Based on these variables, device
automatically calculated power resistance for each
athlete. Before the test all subjects had sufficient for
power testing warming up. Each test started from the
30 sec pre-test warming-up pedaling with required
cadence 50 rpm. After the command “Go” athlete
started pedaling as fast as possible keeping the
efforts up to the end of the test. The test duration
was 30 seconds.
During Wingate test instantaneous force
parameters were fixed automatically by Cardio
Memory software. For further evaluation of power
preparedness of soccer players following parameters
were selected: peak power (PP, W), relative PP (PP,
W/kg), power at 15 (P
15
, W) and 30 sec (P
30
, W),
average power (AP
30
, W), their relative values
(P
15
/kg, W/kg, P
30
/kg, W/kg, AP
30
/kg, W/kg),
fatigue index (%) and maximum attained cadence
(rpm). Post-test analysis also included time of PP
attained.
icSPORTS 2018 - 6th International Congress on Sport Sciences Research and Technology Support
112
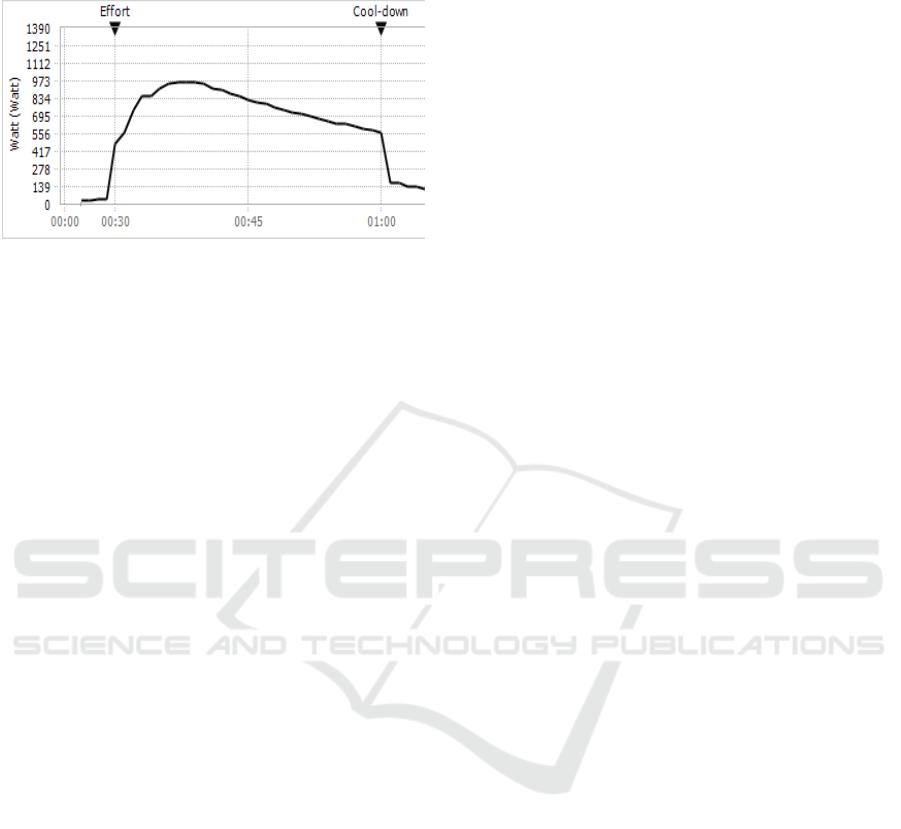
Results of Wingate-test are distributed by the
cycle software as digital and graphical data (Fig. 1).
Figure 1: Example of Wingate-test graph.
2.3 Performance Analysis for Vertical
Jumps
Performance analysis for vertical jumps is a widely
used test in power and sprint sports (Ntai, 2017; Van
Hooren, 2017; Zakharova et al., 2017; Lara, 2006;
Pyansin and Pyanzina, 2016). Application of this test
in soccer could have also good benefits as efficiency
of shots and bounces in attempts for headings in
most cases is based on power abilities of lower
extremities of soccer players.
The main objectives of this part of study were to
obtain descriptive data on maximal power output of
the lower extremities with the use of a force
platform through detailed analysis of four types of
jumps.
The athletes were given the task to make triple
jumps with short rest time between jumps:
• counter movement jumps (CMJs) bending
hands on hips,
• squat jumps (SJs) bending hands on hips,
• single leg jumps on the right and left legs
bending hands on hips,
• CMJs with arms swing.
One minute of rest was allowed between the
consecutive trials of jumps.
Before the test studied soccer players were
familiarized with required jumping technique of
each type of jump. To meet technical requirements
of the CMJ, athletes were instructed to perform an
unconstrained maximal vertical jump from a
standing position on the force plate keeping arms on
hips. Each jump was performed by a
countermovement of acceleration below the center
of gravity attained by flexing the knees. No specific
instructions were given regarding the depth of the
countermovement. The trunk should be kept as
vertical as possible.
While carrying-out SJ subjects started from the
static semi-squat position with knees flexed at about
90 degrees, hands on hips keeping trunk as vertical
as possible. It was required to perform the jump
without any countermovement to have just the
concentric action of the agonist muscles involved at
the movement.
Vertical double and single leg jumps are the
essential part of game situations in soccer. Fights for
overhead ball, vaults and over-jumps are common
elements in football as well as in futsal.
In an attempt to carry out a shooting move a
player may be both in supporting position, as well as
in the bounce. These skills imply one leg vigorous
pushing off and swing of kicking foot. These playing
actions are rather complicated from biomechanical
point of view. The direction of the movement varies
and it may be upwards, forward- aside, backwards-
aside, etc. These movements require recruitment of a
significant number of muscles and muscle groups.
Application of such a simple test as single-leg
vertical jump provides with data on
symmetry/asymmetry (motor balance or disbalance)
of lower extremities muscles and power of thigh
extensors.
We decided to include CMJ with the arms swing
as in most game situations in soccer the attempts to
kick the ball with a head are coupled with jumps
with arms swing. Thus this type of jump may be
considered as more specific for soccer players’
practice.
All studied athletes were instructed to perform
the jumps with the maximum effort. For each jump
it was important to jump at the highest possible
speed and to attain the highest point as possible, as
the best attempt of the jump was further analyzed.
Vertical jumps were `performed on a force plate
TJ4002 (Marafon-Electro, Russia) which was
mounted and calibrated according to manufacturer’s
specifications. The signal was sampled at a rate of
2000 Hz. Original custom-designed software for
ongoing analysis was used for acquisition and
processing of the vertical component of the ground
reaction force.
Based on the collected data, the following
variables were measured and analyzed:
• flying time (t, s);
• jump height (Jh, cm), calculated using TJ4002
software;
• maximum force for take-off (F, N);
• motor asymmetry.
Testing of Power Abilities in High Level Soccer Players: Quantitive and Qualitive Assessment Methods
113
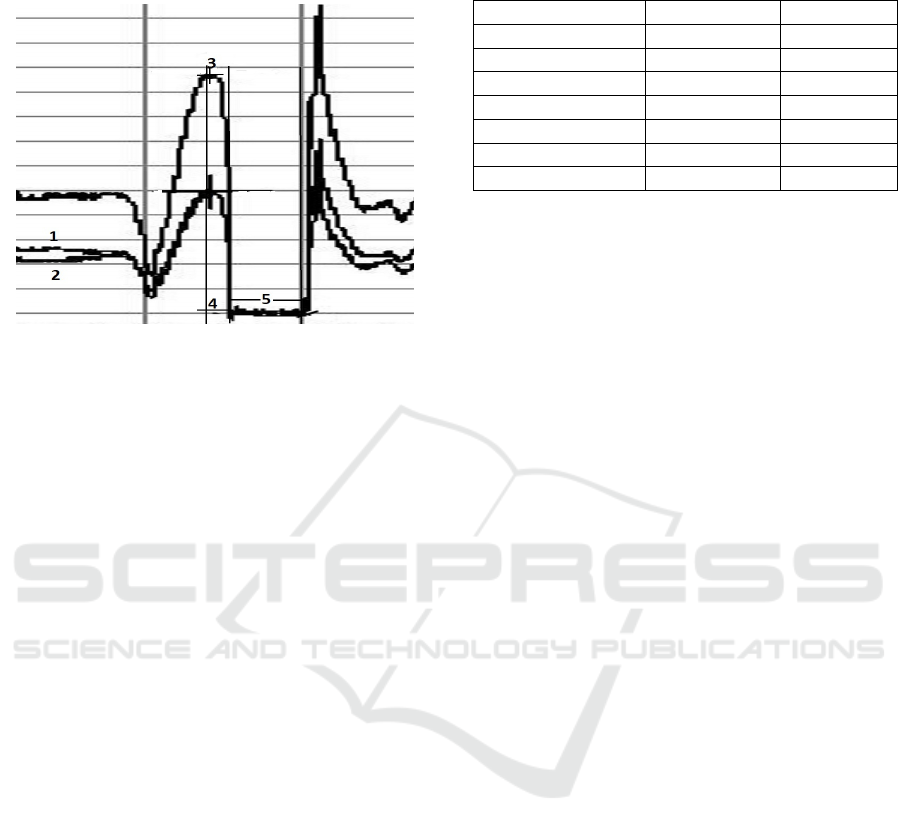
Fig. 2 shows an example of countermovement
jump of tested athletes.
Figure 2: Example of CMJ force curve: 1 – force of right
leg, 2 – force of left leg, 3 – F
max
, 4 – push off time, 2 –
flying time.
2.4 Statistical Analysis
Statistical analysis was performed with the use of
statistic software package “SPSS Statistics 17.0”
(IBM). We used descriptive analysis of the obtained
data in order to estimate anthropometric profile and
power abilities of athletes. Mean value (M), standard
deviation (SD), minimum and maximal values of the
measured parameters were calculated. Normality of
distribution was assessed by the Shapiro-Wilk test
and results showed that all variables had normal
distribution.
To reveal the possible interrelations between
indices obtained from Wingate cycling and force
plate tests Pearson correlations were calculated. The
level of significance was set at P < 0.05.
3 RESULTS AND DISCUSSIONS
The detailed descriptive data on body composition
and anthropometric measurements of soccer players
(Table 1) show that generally studied athletes have
well-balanced body composition for trained soccer
players. They have low absolute and relative fat
content and high index of lean mass. High value of
lean mass in studied athletes is undoubtedly an
advantage and may serve as a proof of appropriate
sports selection as well as proper training and
nutrition.
Table 1: Anthropometric and body composition data of
soccer players.
Parameters M±SD (min-max)
Height, cm 180.22±6.63 169-194
Body mass, kg 73.8±7.01 62.4-90
BMI, kg/m
2
22.69±1.43 20.4-26.3
Muscle mass, kg 63.4±5.4 53.6-73.4
Muscle mass, % 86.88±3.4 77.8-91.5
Fat mass, kg 7.45±3.4 2.6-18.2
Fat mass, % 9.17±3.29 2.4-14.9
Wingate test revealed that 34.5 % of athletes
(33.3 % of futsal players and 35.3 % of soccer
players) demonstrated high level of power (PP/kg
≥13 W/kg). Insufficient level (PP/kg < 11.5 W/kg)
was revealed in 25 % of futsal players and 5.88 % of
soccer players who had short performance time
during the season.
Time of reaching PP (t
pp
, s) was chosen as an
important criterion of power abilities evaluation.
Optimal results for soccer players are considered as
reaching PP within 3
rd
-4
th
second of the test
(Zakharova and Berdnikova, 2016). We found that
t
pp
≤ 4 s showed 75 % of futsal players and 23.53 %
of soccer players. Notably, only 13.79 % of tested
athletes with high results of PP (16.67 % of futsal
players and 11.76 % of soccer players) showed
prompt reaching peak values of power.
The obtained ratio of indices of power abilities
may be explained by different duration of
competitions in futsal and soccer, as well as
peculiarities of training approaches. In terms of
differences of pitches sizes and quantity of players
the main features of futsal are fast and short dashes
and motions, whereas higher variety of ball velocity
and speed of players are more typical in soccer.
High level of strength endurance is normally
characterized by low values of fatigue (≤ 35 %) with
sufficient (high or intermediate) level of power
abilities of athletes. Our research revealed that only
13.79 % of studied athletes had high level of
strength endurance (25 % of futsal players and 5.88
% of soccer players).
Additionally we were interested in parameter of
speed of power decrement by 15
th
and 30
th
seconds
of the test (P
15
/kg, P
30
/kg). Optimal (desirable for
high-level soccer players) power decrement by 15
th
second was registered in 37.93 % of athletes with
sufficient values of PP (33.3 % of futsal players and
41.18 % of soccer players). Noteworthy, 10.34 % of
athletes showed significant power decrement by 30
th
second (P
30
/kg) of Wingate-test (∆Р
15
/kg – Р
30
/kg >
4W/kg). These serves as a proof of insufficient level
of strength endurance in studied subjects.
icSPORTS 2018 - 6th International Congress on Sport Sciences Research and Technology Support
114
The fact that high values of average relative
strength AP
30
/kg (> 11W/kg) showed only 13.79 %
of studied players, also pointed at insufficient level
of strength endurance in subjects.
Table 2: Cycling Wingate-test parameters of high-level
soccer players.
Parameters M±SD (min-max)
PP, W 931.62±89.9 (800-1222)
PP/kg, W/kg 12.63±0.99 (10.8-14.9)
AP
30
, W 728.52±63.13 (608-839)
AP
30
/kg, W/kg 9.88±0.78 (7.75-11.19)
Fatigue, % 42.6±8.4 (23-56)
t
pp
, s 5.24±2.21 (2-9)
P
15
, W
736.8±79.24 (572-884)
P
15
/kg, W/kg
10±1.01 97.15-11.62)
P
30
, W
527.2±60.2 (375-619)
P
30
/kg, W/kg
7.2±0.8 (4.7-8.8)
PP – peak power; AP – average power; t
pp
, - time of PP
attainment.
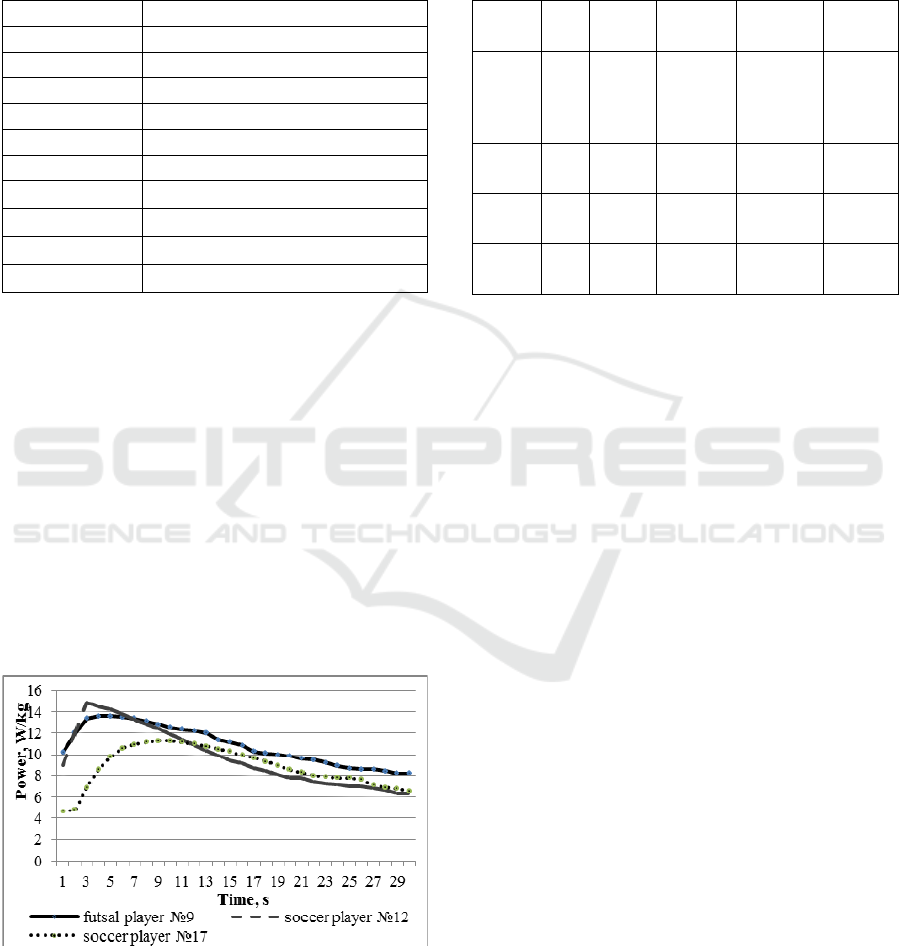
Figure 3 illustrates examples of Wingate-test
individual results of three players. We ranged them
as excellent, permissible and insufficient patterns
(Table 3). Athlete #9 showed fast reaching PP (t
pp
=
4 s) with minor gradual power decrement by 15
th
and
30
th
seconds of the test. Player #12 showed
insufficient strength endurance with high values of
PP (graph demonstrates PP reaching by the third
second of the test with significant power decrease by
5.53 W/kg at 15
th
second and by 8.61 W/kg at 30
th
second). As one can see, athlete #17 had low level of
power abilities: low values of PP/kg = 11.27 W/kg
reached only by 9
th
second of Wingate-test.
Figure 3: Graphs of individual results of Wingate-test.
Although age of recruited for the research
players varied within a wide range (25.29 ± 5.4
years), no interrelations between the level of power
abilities and age/sport experience of athletes were
found. Young players (aged 19) along with more
experienced elder athletes (30-36 years) showed
high level of strength and power preparedness.
Table 3: Individual results of Wingate-test of soccer
players.
t
pp
, s
PP/kg,
W/kg
PP
15
/kg,
W/kg
PP
30
/kg,
W/kg
Fatigue,
%
High
level
players
norm
≤ 4 > 13
<PP/kg-
2
<PP
15
/kg-
4
≤ 35
Player
# 9
4 13.6 11.13 8.22 37
Player
# 12
3 14.91 9.38 6.3 56
Player
# 17
9 11.27 10.28 6.55 39
PP – peak power; t
pp
, - time of PP attainment.
Data obtained from the performance analysis for
vertical jumps provided with important information
on parameters of prompt manifestation of power, as
they are more typical for competitive soccer activity.
To estimate speed and power preparedness of
athletes the following indices were chosen: jump
height (cm), double leg maximum force for take-off
(N), single leg (right and left) maximum force for
take-off (N), as well as parameter of relative strength
(N/kg) and push off time (s) (Table 4).
Results of CMJ are probably conditioned by a
range of factors: hip extensors strength, development
of intermuscular coordination – consecutive
coordinated agonists and antagonists muscles
engaging (Gissis, 2006; Pupo, 2012).
The recorded mean data on CMJ height in
studied players (35.94 ± 4.2 cm) are significantly
lower than described in previous studies of elite
soccer players (37.8 ± 5.9 cm in Slovak elite soccer
players (Pivovarniček, 2015); 39.4 ± 0.4 cm in
Icelandic elite soccer players (Arnason, 2004);
40.94±4.93 cm in soccer players from Spanish 2
nd
and 3
rd
division of championships (Los Arcos,
2017). Values of CMJ height higher than 40 cm
were demonstrated only by 23.3 % of studied
players (33.3 % of futsal players and 16.67 % of
soccer players).
Parameter of relative strength (RS) in jumps
characterizes strength abilities of athletes. We
registered mean values of RS in studied group as
18±1.68 (15-21.36) N/kg in CMJs and 17.52±2.4
(9.24-21.6) N/kg in SJs.
Testing of Power Abilities in High Level Soccer Players: Quantitive and Qualitive Assessment Methods
115
Table 4: Maximal anaerobic power of the lower extremities of high-level soccer players (M±SD (min-max)).
Parameters CMJ SJ Single leg jump right Single leg jump left
CMJ with arms
swing
Height jump, cm
35.94±4.2
(29-46)
36.65±4.62
(30-45)
20.5±3.4
(15-28)
20.8±3.7
(15-29)
44.72±5.04
(37-58)
Push off time, s
0.16±0.09
(0.09-0.26)
0.12±0.06
(0.07-0.25)
- - -
Maximum force
for take-off, N
1325±139.8
(1075.2-1650)
1274.9±214.68
(644.4-1696.8)
1097.4±116.4
(932.4-1419.6)
1082.16±115.2
(894-1412.4)
1290.48±119.52
(1065.6-1574.4)
Flying time, s
0.54±0.03
(0.49-0.61)
0.54±0.03
(0.49-0.60)
0.40 ±0.03
(0.34-0.48)
0.41±0.04
(0.35-0.49)
0.60±0.03
(0.55-0.69)
Relative strength,
N/kg
18±1.68
(15-21.36)
17.52±2.4
(9.24-21.6)
- - -
Squat jump results are mainly obtained due to
central nervous impulsation to working muscles
during concentric work, which allows development
of maximal strength of lower extremities. The
obtained mean values of SJ height (36.25±4.62 cm)
are comparable with the exciting data of elite
athletes (Arnason, 2004; Pivovarniček, 2015; Los
Arcos, 2017). High level of maximal force
development (SJh > 38 cm) was observed in 40 % of
studied athletes (58.33% of futsal players and
27.78% of soccer players).
We were also interested in calculated index of
∆CMJh-SJh,. This parameter characterizes the
ability to use muscle extension to generate elastic
energy when eccentric phase converts to concentric
phase. Normally, the value of ∆CMJh-SJh is about
2-4 cm. We registered, that the SJ height in 63.3 %
(66.67 % of futsal players and 61.11 % of soccer
players) was higher than in CMJ (mean value
∆CMJh-SJh was -0.71 cm). Although high level of
maximum power and high strength abilities of
athletes were registered during Wingate test, testing
on a force plate revealed motor disbalance of
antagonist muscle work. We found a disruption of
antagonist muscles work due to disorders of speed-
power neuromuscular coordination.
Probably, the described above results refer to
breakdown of soccer trainings at earlier stages of
soccer career, i.e. disorders of basic motion skills
and capabilities built up, as well as insufficiency of
speed-power trainings at the level of elite sport
(Kraemer, 2004; Mujika, 2009; Loturco, 2015;
Silva, 2016).
Balance of muscular strength of lower
extremities is the integral requirement in any sport
and in team sports especially. The asymmetry of
muscles development of increased risk of injuries
and negatively affects the level of high-speed and
power readiness of athletes (Lawson, 2005; Newton,
2006; Lawson, 2006; Impellizzeri, 2007; McElveen,
2010). 25 % players (20 % futsal – and 28.57 % of
soccer players) have muscles development
asymmetry of the right and left legs (i.e. difference
in jump height on the right and left leg is more than
15 %). The difference of right and left single legs
jumps height varied in rather wide range from 0 to
37.5 % among the studied soccer players. Additional
polling of football players and the analysis of the
obtained data has allowed to reveal that imbalance is
connected with shooting or long passing leg role
rather than preference for a leg.
The received results of single leg jump height
were high (20.5 – 20.8 cm) in comparison with the
data obtained in the research by McElveen et al.
(2010) in athletes of the 2nd division in soccer and
basketball (15.2 – 15.7 cm). Results of SLJ higher
than 20 cm were shown by 70.83% of the tested
athletes (90% futsal and 57.14% soccer players).
The jump of CMJ with arms swing is more
specific to soccer than vertical jumps with hands on
hips. The movement of arms during jumps in soccer
happens automatically since these motor skills are
formatted at the level of steady skill. To find out
integrated power abilities of high level soccer
players the vertical jump test protocol was modified.
Jumping with arms swings athletes have improved
results in ASJ jump height in comparison with CMJ
by 23.83 ± 11.82 (2.4–50) %. Average ASJ height
was 44.72 ± 5.04 (37-58) cm, at the same time ASJ
h values higher than 45 cm were shown by 41.38 %
of athletes (66.67 % of futsal – and 35.29 % of
soccer players).
Data from correlative analysis showed that there
were significant interrelations between parameters
measured during cycling Wingate-test and variables
of performance analysis for vertical jumps (Table 5).
icSPORTS 2018 - 6th International Congress on Sport Sciences Research and Technology Support
116
Table 5: Correlations of indices from jump tests with
parameters obtained from Wingate-test.
P
max
P
max
/kg P
15
P
30
AP
CMJ h .210 .195 .212 .253 .301
CMJ t .226 .345 .104 .115 .196
CMJ
MF
.201 -.421
*
.322 -.186 .327
CMJ Fr .193 -.312 .217 -.207 .247
CMJ Fl .205 -.440
*
.395
*
-.110 .413
*
SJ h .270 .144 .349 .222 .360
SJ t .228 .127 .336 .233 .346
SJ MF .596
**
.060 .382
*
-.104 .058
SJ Fr .515
**
-.072 .320 -.185 .111
SJ Fl .565
**
.000 .529
**
.022 .343
RLJ h .148 .136 .014 -.018 .240
RLJ t .144 .139 .035 .013 .286
RLJ
MF
.428
*
-.141 .289 -.174 .410
*
LLJ h .232 .017 .035 -.121 .072
LLJ t .246 .050 .029 -.117 .046
LLJ
MF
.248 -.298 .481
*
.045 .471
*
ASJ h .411
*
.102 .463
*
.178 .476
**
ASJ t .397
*
.100 .453
*
.180 .463
*
ASJ
MF
.085 -.116 .352 .189 .393
*
ASJ Fr .075 -.017 .248 .175 .183
ASJ Fl .125 -.202 .341 .078 .452
*
CMJ – countermovement jump, h – jump height, t – flying
time, MF – maximum force for take-off, Fr – right leg
force for take-off, Fl – left leg force for take-off, SJ –
squat jump, RLJ – single leg jump (right leg), LLJ – single
leg jump (left leg), ASJ – countermovement jump with
arms swing
* P < 0.05; ** P < 0.01
We found that parameter of AP significantly
correlated with jump height (r=.476, P < 0.01), flying
time (r=.463, P < 0.01), maximum force for take-off
(r=.393, P < 0.05) in countermovement jump with
arms swing. Noteworthy, maximum power
correlated with maximum force for take-off (r= .596,
P < 0.01), force for take-off of right leg (r = .515, P
< 0.01) and left leg (r = .565, P < 0.05) in squat
jump.
4 CONCLUSIONS
1. Both methods – anaerobic Wingate test and
performance analysis for vertical jumps ̶ are
informative power and strength measuring
instruments. Wingate test provides the information
on power and strength endurance during 30 s while
performance analysis for vertical jumps – on power
and muscle work in sole movement. The obtained
data from both tests complement the results, giving
an expanded view of the various components of
speed-strength training athletes. Thus, it is possible
to detect the weak aspects of the athletes’ fitness and
to make appropriate adjustments in the training
process, which is particularly important in high
performance sport.
2. Following Wingate test parameters may be
assumed as sufficient for high level soccer players:
fast achievement (at 3-4 seconds) of high PP values
(more than 13 W/kg) and a gradual slight decrease in
power by 15
th
(up to PP/kg-2) and 30
th
seconds (up
to PP
15
/kg-4), characterized by a high level of
strength endurance with a fatigue rate of less than
35 %.
3. In whole studied high level soccer players
demonstrated a high level of power abilities
(strength + power). Excellent indicators of the
maximum force in squat jumps and maximum power
in Wingate test were demonstrated, but only a small
part of athletes (13.79 %) were able to transfer good
strength into power with maximum speed (t
pp
≤ 4 s
at high values of Peak Power). The components
requiring priority attention for further training of
football players are revealed: inconsistency of
antagonist muscles functioning (it was noted in 2/3
tested football players) and insufficient level of
strength endurance in ¾ athletes.
According to the results of the research it was
revealed that high level players in futsal is
characterized by a higher level of speed, power and
strength endurance training than soccer players,
which is directly related to the requirements for
athletes in competitive activities. In futsal there is a
predominance of anaerobic mechanisms of energy
supply, while for soccer the mixed (aerobic-
anaerobic) capacity is inherent. Along with the
evaluation of power abilities should be compulsory
in both sports.
ACKNOWLEDGEMENTS
The work was supported by Act 211 Government of
the Russian Federation, contract # 02.A03.21.0006.
Testing of Power Abilities in High Level Soccer Players: Quantitive and Qualitive Assessment Methods
117

REFERENCES
Arnason, A., Sigurdsson, S.B., Gudmundsson, A.,
Holme, I., Engebretsen, L., & Bahr, R. (2004).
Physical fitness, injuries, and team performance in
soccer. Medicine & Science in Sports &
Exercise, 36(2), 278-285.
Cissik, J., (2012). Strength and conditioning: a concise
introduction. New York: Routledge.
Gissis, I., Papadopoulos, C., Kalapotharakos, V.I.,
Sotiropoulos, A., Komsis, G., & Manolopoulos, E.
(2006). Strength and speed characteristics of elite,
subelite, and recreational young soccer
players. Research in sports Medicine, 14(3), 205-214.
Guba, V. & Presnyakov, V. (2017). Mathematical
processing methods of sports studies results. Litres.
Impellizzeri, F.M., Rampinini, E., Maffiuletti, N., &
Marcora, S.M. (2007). A vertical jump force test for
assessing bilateral strength asymmetry in athletes.
Medicine & Science in Sports & Exercise, 39(11),
2044-2050.
Joyce, D., Lewindon, D. (2014). High-performance
training for sports. Human Kinetics, 392 pp.
Kraemer, W.J., French D.N., Paxton N.J., Hakkinen K.,
Volek J.S., Sebastianelli W.J., Putukian M., Newton
R.U., Rubin M.R., Gomez A.L., Vescovi J.D.,
Ratamess N.A., Fleck S.J., Lynch J.M., Knuttgen H.G.
(2004). Changes in exercise performance and
hormonal concentrations over a big ten soccer season
in starters and nonstarters. J Strength Cond Res, 18,
121-128.
Lara, A. Abián, J. Alegre, L.M., Jiménez, L., Aguado, X.
(2006). Jump tests on a force platform for applicants to
a sports science degree. Journal of Human Movement
Studies, 50(2), 133-147.
Los Arcos, A., Mendiguchia, J., & Yanci, J. (2017).
Specificity of jumping, acceleration and quick change
of direction motor abilities in soccer players.
Kinesiology, 49(1), 22-27.
Loturco, I., Pereira, L.A., Kobal, R., Zanetti, V., Gil, S.,
Kitamura, K., Abad, C.C., Nakamura, F.Y. (2015).
Half-squat or jump squat training under optimum
power load conditions to counteract power and speed
decrements in Brazilian elite soccer players during the
preseason. J Sports Sci, 33, 1283-1292.
Lawson, B.R. (2005). Bilateral asymmetries in max effort
single-leg vertical jumps. Biomedical sciences
instrumentation, 41, 317-322.
Lawson, B.R., Stephens II, T. M., DeVoe, D. E., & Reiser
II, R. F. (2006). Lower-extremity bilateral differences
during step-close and no-step countermovement jumps
with concern for gender. Journal of strength and
conditioning research, 20(3), 608.
McElveen, M.T., Riemann, B.L., & Davies, G.J. (2010).
Bilateral comparison of propulsion mechanics during
single-leg vertical jumping. The Journal of Strength &
Conditioning Research, 24(2), 375-381.
Mujika, I., Santisteban, J., Impellizzeri, F.M., Castagna, C.
(2009). Fitness determinants of success in men's and
women's football. J Sports Sci, 27,107-114
Newton, R.U., Gerber, A., Nimphius, S., & Shim, J.K.
(2006). Determination of functional strength
imbalance of the lower extremities. Journal of
Strength and Conditioning Research, 20(4), 971.
Ntai, A., Zahou, F., Paradisis, G., Smirniotou, A.,
Tsolakis, C. (2017). Anthropmetric parameters and leg
power performance in fencing. Age, sex and discipline
related differences. Science and Sports, 32(3), 135-
143.
Pivovarnicek, P., Pupis, M., & Lacena, M. (2015). A level
of jump abilities of elite Slovak soccer players at
different positions in field. Journal of Physical
Education and Sport, 15(1), 53.
Pupo, J.D., Detanico, D., & Santos, S.G.D. (2012). Kinetic
parameters as determinants of vertical jump
performance. Revista Brasileira de Cineantropometria
& Desempenho Humano, 14(1), 41-51.
Pyanzin, A., Pyanzina, N. (2016). Calculation of the long
jump result based on vertical jump result. Vestnik of
CHGPU named after I.Ya. Yakovlev, 90(2), 161-169.
Silva, J.R., Brito, J., Akenhead, R., Nassis, G.P. (2016).
The transition period in soccer: a window of
opportunity. Sports Med, 46, 305-313
Thomas, J.R., Netson, J.K. (2005). Research methods in
physical activity. 5
th
ed. Champaign (IL): Human
Kinetiks.
Van Hooren, B., Zolotarjova, J. (2017). The Difference
between Countermovement and Squat Jump
Performances: A Review of Underlying Mechanisms
with Practical Applications. Journal of Strength and
Conditioning Research, 31(7), 2011-2020.
Zakharova, A.V. & Berdnikova, A.N. (2016). Monitoring
of Power Abilities in Young Football Players. Human.
Sports Medicine, 16(4), 64-74.
Zakharova, A., Mekhdieva, K., Berdnikova, A. (2017).
Comprehensive Fitness Control in Young Soccer
Players - Comparison of laboratory and field testing
Indicators. icSPORTS 2017: Proceedings of the 5
th
International Congress on Sports Sciences Research
and Technology Support, 25-33. doi:
10.5220/0006495600250032
icSPORTS 2018 - 6th International Congress on Sport Sciences Research and Technology Support
118
