
The Use of Modelling within Prognostic Health Management Systems
for a Fowler Flap System
Graham Hardwick
1
and Isabella Panella
2
1
Chief of Systems - Performance, UTC Aerospace Systems, Stafford Road, Wolverhampton, U.K.
2
APS System Engineering Manager, UTC Aerospace Systems, Stafford Road, Wolverhampton, U.K.
Keywords: Prognostic, Health, Management, Commercial, Aircraft, Secondary, Flight, Control, Systems, Fowler, Flap,
System, Power, Drive, Unit.
Abstract: The aviation industry has been utilising prognostic health management (PHM) to improve scheduled
maintenance, reduce expensive aircraft on ground events (AOG) and improve active safety. PHM systems
utilise legacy and real time aircraft data in conjunction with simulation models to forecast the remaining
useful life (RUL) of components and systems which allow maintenance decisions to be managed. This work
presents an industry based approach to PHM for one of the aircraft line replacement units (LRUs),
specifically, the power drive unit (PDU) within a “generic” commercial aircraft secondary flight control
system. The modelling infrastructure and its importance as a building block for the construction of a
prognostic health management framework are highlighted. Example failure modes of a PDU are provided
and potential benefits of PHM to mitigate these failure modes are examined. Finally simulation results from
a physical model of the system in Simulink have been generated.
1 INTRODUCTION
In the aviation industry, there is an increased
pressure for airlines to reduce costs whilst increasing
their operating performance.
Airline costs are dependent on airline running
costs as well as the need for systems upgrades and
replacement, whilst guaranteeing their integrity
within legacy systems.
As reported by (A. Brüggen and L. Klose,
2010), the significant airline running costs that need
to be addressed can be grouped into three major
areas:
1. Cost of personnel, both ground and airborne
support crews, represented by personnel such
as, for instance, flight crews, pilots, engineers,
administrators, baggage handling ground staff;
2. The costs of marketing, business development,
and sales;
3. The technical costs of operating a fleet,
represented by:
a. Fuel;
b. General maintenance overheads (facilities,
maintenance administration and recording),
maintenance equipment such as spare parts
and oil, aircraft servicing such as de-icing,
electricity and water supply;
c. Traffic servicing, represented by landing,
taxi or parking charges and air traffic
control outlays.
d. Aircraft/capital as in depreciation of aircraft
or leasing costs, and other capital costs,
including outlays for working capital.
Specifically, when looking at the cost of
operating a fleet, AOG and its inability to be in
service represents the major cost for an airliner.
The AOG condition can be due to scheduled or
unscheduled maintenance.
The ability to forecast when LRU’s need to be
replaced or maintained, bundle multiple components
maintenance to minimise the number of AOGs
events, forecasting the probability of failure of a
given LRU to enable the airline to perform the
maintenance activities in their own hanger are
extremely important in the attempt to minimise the
overall fleet costs.
Moreover, current commercial aircraft and their
systems have changed dramatically since their first
introduction and the new civil aircraft market
requires increased cost saving and competitiveness,
whilst virtually every aircraft component that must
Hardwick, G. and Panella, I.
The Use of Modelling within Prognostic Health Management Systems for a Fowler Flap System.
DOI: 10.5220/0006900701510159
In Proceedings of 8th International Conference on Simulation and Modeling Methodologies, Technologies and Applications (SIMULTECH 2018), pages 151-159
ISBN: 978-989-758-323-0
Copyright © 2018 by SCITEPRESS – Science and Technology Publications, Lda. All rights reserved
151
be maintained has advanced during that time,
including flight systems, passenger comfort systems,
engines, and structural materials.
The issues of upgrading existing technologies in
a cost effective manner, of innovating current
technical solutions to ensure more cost effective
practices, the need for improved safety and
collaboration not just at airframe level but within a
collaborative air space and fleet management space,
lead to a revise approach on life-cycle management,
which requires to be more focused on data exchange
and real time information extraction.
2 INTEGRATED VEHICLE
HEALTH MANAGEMENT
A platform capable of achieving an integrated
operational information exchange for fleet
management and an individual platform capable of
addressing the ability to evaluate the RUL of a
systems, support fault detection, up to logistic
management of the fleet with the objective of
guaranteeing total asset availability has been
identified to be the integrated vehicle health
management system (IVHM).
The “health state” refers to the ability to
determine the overall health state of the vehicle. By
using diagnostic and prognostic algorithms, the
vehicle and its systems are monitored to detect and
isolate failures. This requires autonomous data
extraction from multiple heterogeneous systems, an
assessment of the impact that each fault can have on
an individual component and on the overall
platform, and the forecasting capabilities to identify
the timeline for the fault to become critical.
Mitigation involves the real-time assessment of
the impact of the failures on the vehicle and its
current mission. Once the impact is assessed, system
redundancy management reconfigures the vehicle to
maintain a safe operating condition and continue the
mission, if possible. In those cases in which
reconfiguration is not sufficient to continue the
mission, the flight crew may modify the mission
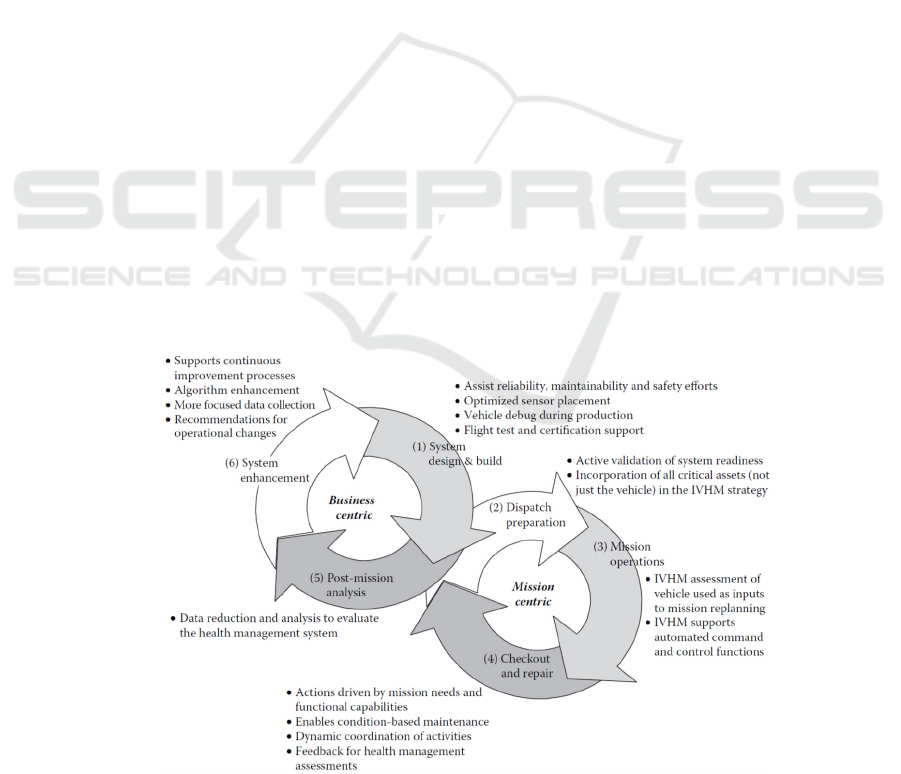
IVHM is seen as a key development in order to
reduce the lifecycle total ownership costs of modern
platforms to improve in-service operation. The
envisaged benefits of IVHM are:
• Ensure the ability to support fleet’s
overhauling management and
monitoring;
• Ease in integrating it to legacy systems
– integrated modular avionics (IMA),
full authority digital engine controls
(FADEC);
• Ease development of new cutting edge
technologies within the individual
subsystems
• Optimisation of network information
flow, by selection of data to transfer to
the networked elements.
Figure 1: Enterprise Wide Approach in IVHM (Spitzer, 2006, figure 22.2, pp 369).
SIMULTECH 2018 - 8th International Conference on Simulation and Modeling Methodologies, Technologies and Applications
152
As described by (Baines, Benedetti, Greenough
and Lightfoot, 2009) IVHM is development of both
diagnostic and prognostic systems that when
implemented enables real-time, continuous
monitoring of vehicle health and predicts the
remaining useful life of a system.
Diagnostic is based on the evaluation of the
root causes of a fault that has occurred based on
historic database and can considered a deterministic
automated root-cause analysis carried out a
posteriori. Prognostic is the process of forecasting
future failure of the LRU or system based on historic
data combine with the real-time system
performance. (Kwok L. Tsui, Nan Chen, Qiang
Zhou, Yizhen Hai, 2015) define prognostics as “the
process of predicting the future reliability of a
product by assessing the extent of deviation or
degradation of the product from its expected normal
operating conditions”.
The set of hardware and software that enables
the support of prognostic infrastructures is also
known as the Prognostic Health Management
infrastructure.
In this work, the modelling and simulation
infrastructure required to develop PHM architecture
is described for the high lift system is described. The
model presented is a generic Fowler flap system and
the generic approach to a prognostic health
management framework detailed, from the fault
database management to the modelling and
simulation. A subset of failure modes of the PDU
failure mode examples are also discussed,
specifically the PDU brake failure and the PDU
filter blockage. PHM development opportunities in
those cases are explored.
3 HIGH LIFT SYSTEMS
UTC Aerospace Systems design, manufacture, and
integrate secondary flight control systems for a
variety of commercial aircraft, from wide body to
single aisle configuration, from business jets to the
A380.
Commercial aircraft utilize secondary flight
control surfaces, such as flaps and slats to modify
the wing profile in order to increase aerodynamic lift
for a given air speed. This allows aircraft landing
speeds/distances to be reduced.
At any given speed, the increase of lift from the
wing can be achieved by increasing:
a) The wing surface area, and/or
b) The lift coefficient
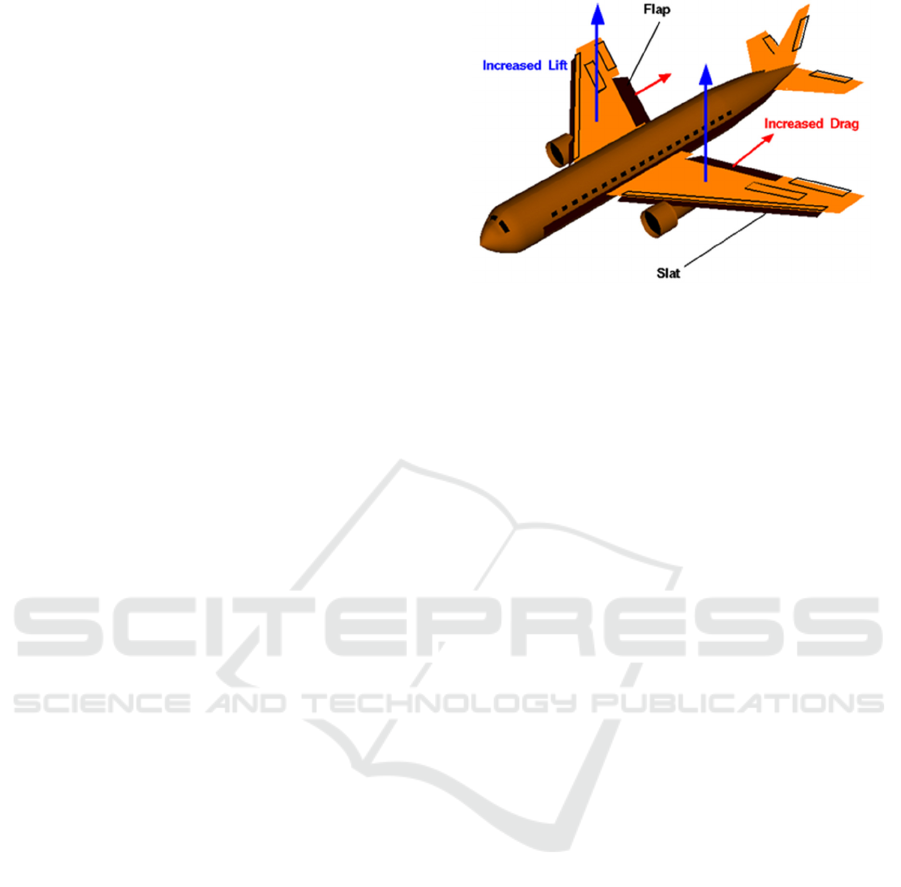
Figure 2: Slat and flap (Slat and Flap, https://
www.grc.nasa.gov/www/k-12/airplane/flap.html).
High-lift systems enable to increase the area of
the wing and to change the shape of the wing
aerofoil to support a change in lift coefficient. There
are two types of high-lift systems: the leading-edge
slats and the trailing edge flap (Figure 2).
Due to the complexity of the system and the
multitudes of mechanical, hydraulic, and electrical
components, which provide an example of complex
multi-physics system, it is essential to follow a
model based design (MBD) approach in its design
lifecycle.
The authors will present the step by step
implementation of the modelling and simulation
infrastructure and describe its adoption to support
the following analysis:
• Generate performance envelopes,
• Support a fault database management
system to support the listing of the
component failure effects / consequences,
• Generate dynamic load cases for a
component, sub-system, system,
• Determine the systems/components ability
to withstand load cases.
4 SIMULATION MODEL
DESCRIPTION
This section provides a description of the functional
architecture of the hydraulically powered Fowler
flap system and associated physical model. The
functional architecture is provided in figure 3 and is
based upon the work presented by (Hardwick and
Panella, 2017).
The Use of Modelling within Prognostic Health Management Systems for a Fowler Flap System
153
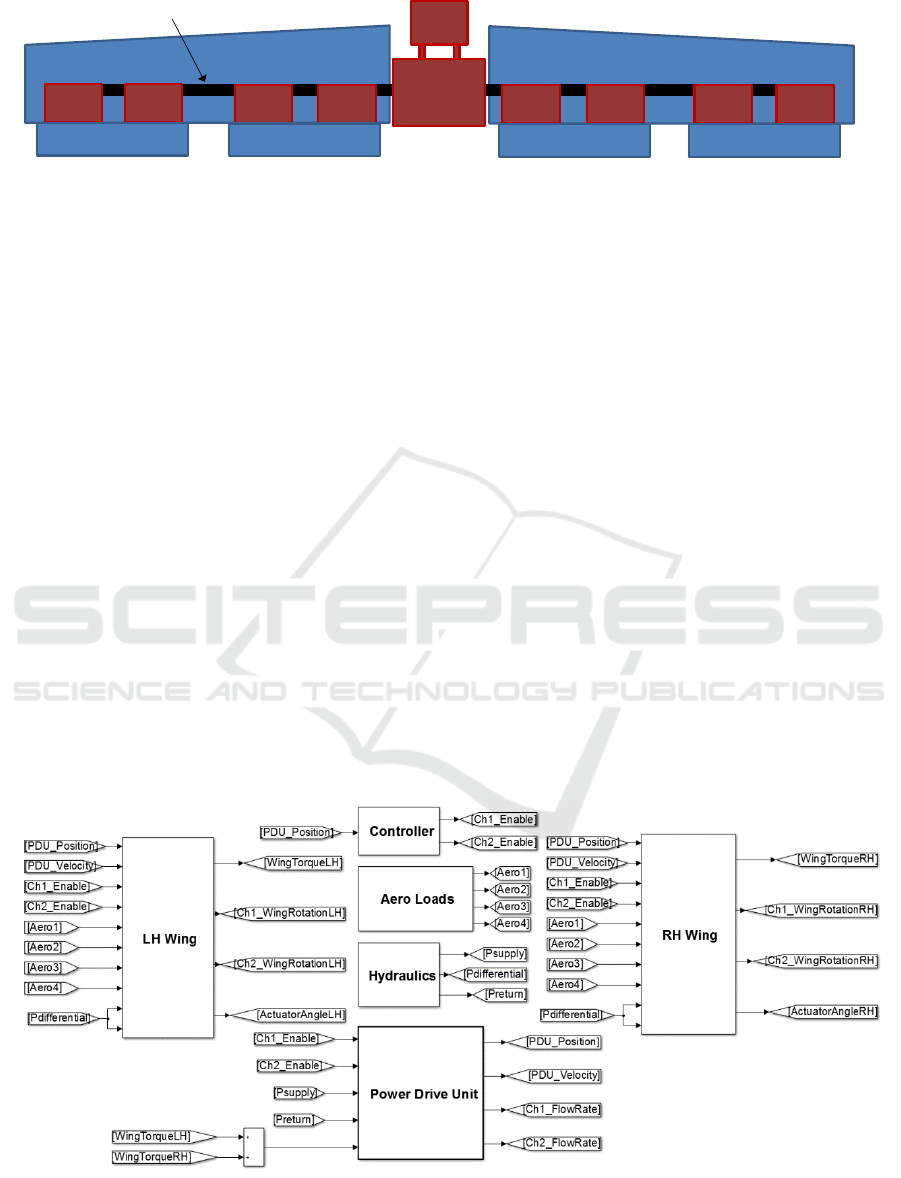
Figure 3 - Generic High-Lift architecture.
The functional architecture describes a generic
medium sized commercial aircraft flap system,
characterized by a single transmission line and
distributed actuators spaced symmetrically with
respect to the aircraft centreline. This architecture
presents only a flap system and does not include the
slat actuators.
The physical layout includes elements of the
functionalities that a high lift system needs to
present which are:
• Four mechanical rotary geared actuators
(RGA) per wing provide the actuation from the
transmission to the flap carriage; The
mechanical advantage from the transmission to
the flap carriage is increased by the use of
gearboxes. This allows the transmission to
drive large aerodynamic loads.
• The actuators are driven by a hydraulic Power
Drive Unit via transmission shafts which is
located on the aircraft centreline. The PDU has
two independant channels for redundancy and
position sensing capability via resolvers; This
communicates with the secondary flight
controller which controls the hydraulic valves
which regulate the flow to the hydraulic
motors. The motors drive a mechanical
gearbox that drives the transmission.
• The secondary flight control system
communicates with the PDU, position sensors
and safety devices which arrest the system
during failure case scenarios. It also interfaces
with the main aircraft flight controller.
• Synchronous movement of both wings is
achieved by using transmission shafts connect
the PDU to the actuators.
The sequence of operation of the system is as
follows. The flight controller provides a new
position command to the secondary flight controller.
The secondary flight controller compares the
position demand to the present PDU position. If the
error is above a set threshold then the controller
opens the hydraulic control valves and releases the
system brakes. The control for this simple example
is based upon position control. When the PDU
position reaches the demanded position the control
valves are closed and all brakes are engaged.
Figure 4: architecture of a generic secondary flight control system in Simulink – (Hardwick and Panella, 2017).
PDU &
Position
Sensing
Actuator 1 Actuator 1Actuator 2 Actuator 2
Actuator 3
Actuator 3
Actuator 4
Actuator 4
Flap Inboard Surface Flap Inboard Surface Flap Outboard SurfaceFlap Outboard Surface
Controller
Transmission
SIMULTECH 2018 - 8th International Conference on Simulation and Modeling Methodologies, Technologies and Applications
154
Based on the functional description of the flap
system, the authors now intend to map the functional
representation into a physical model with the aim to
capture the physical behaviour of a PDU. To
represent this operational scenario, a first order
dynamic modelling of the secondary flight control
system was created. These equations were translated
into a state-space model within the Matlab /
Simulink modelling environment using a variable
step ordinary differential solver (ODE). The model
built captured the non-linear time invariant nature of
the system through its continuous states and the
representation of its non-linear behaviour. The
Simulink model employed in this paper is derived
from the work presented by (Hardwick and Panella,
2017). The following provide a brief summary.
Transmission shaft blocks connect the PDU to
the actuators which include component inertia,
stiffness, and damping. Efficiency of the universal
joints and inline gearboxes are included together
with rotational drag torque.
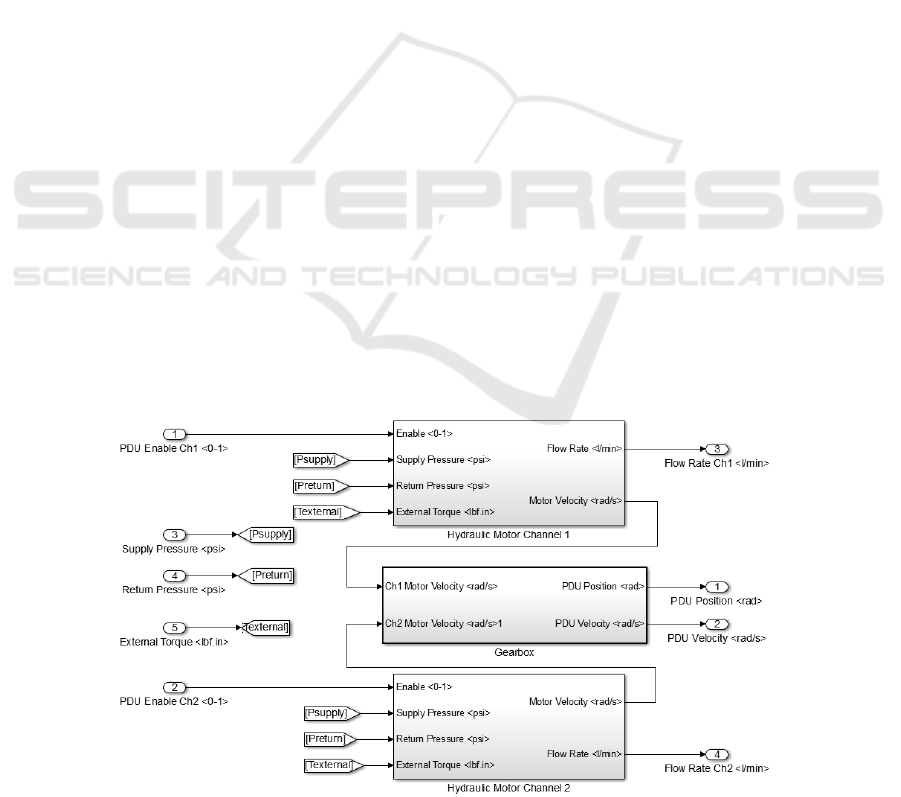
The PDU model incorporates two hydraulic
channels that contain a motor and control valve to
activate the motor. The PDU enable signal controls
both the brake in the PDU and the control valve. The
motors convert the hydraulic power into mechanical.
These both drive a gearbox which has a common
output shaft. The control valve dynamics in the PDU
was modelled using a first order transfer function.
Valve Transfer Function = 1/(1 + T
c
.(s)) (1)
Movement of the control valve determines the
pressure drop across (ΔP) the motor. The pressure
drop is converted to a motor torque (T
m
) by
multiplying by the motor displacement (K
mot
) and
incorporating drag (T
drag_m
) and motor efficiency
(η
mot)
as shown by equation 2:
T
m
= ΔP*K
mo
t
*η
mo
t
- T
dra
g
_
m
(2)
Hydraulic motor acceleration is calculated by
dividing the motor torque by the motor inertia.
Integrating the acceleration provides the angular
velocity of the motor. Both motor speeds are
transferred through a gearbox where the PDU output
shaft position and velocity states are passed to the
wing.
Figure 4 highlights the system architecture
mapped in the Simulink modelling environment.
This contains the following subsystems:
• “Controller” contains the Secondary flight
controller model;
• “Power Drive Unit” contains the power
drive unit mode as described in figure 5;
• “LH and RH Wing” contains the left and
right wing models;
• “Aero Loads and Hydraulics” blocks
represent the aerodynamic loads and
hydraulic system interfaces with the PDU.
The PDU and the controller are connected to the
rest of the model using “GoTo” blocks, described as:
• Ch1/2_Enable – Secondary flight
controller to PDU enable electrical signal.
• PDU_Position – PDU to secondary flight
controller position sensing
• Aero1(N) – Aerodynamic loads between
the interface and wings
• Psupply – Hydraulic supply pressure
between aircraft and PDU.
Figure 5: Power Drive Unit Model – (Hardwick and Panella, 2017).
The Use of Modelling within Prognostic Health Management Systems for a Fowler Flap System
155

A “generic” high lift model has been developed
to protect intellectual property concerns for specific
customer programs. Therefore verification of this
model against physical test data model cannot be
presented. However, model verification has been
performed for customer programs at numerous
stages of the system engineering process for
example at component level and at full system rig
level. Excellent model correlation has been achieved
at both individual component and full system level
over a range of environmental temperatures,
aerodynamic loads across multiple programs.
5 POWER DRIVE UNIT FAILURE
MODES
In this section, the analysis of generic failure modes
for the Fowler flap system PDU is presented.
The rational of selecting the PDU as a case study
for fault analysis and as a LRU for future PHM work
is justified by the fact that any failure presented by
the PDU would present the following challenges:
• PDU repair or replacement with delays in the
aircraft future operations. Increase in AOG
time.
• Availability of spare parts depending on port in
which the aircraft is located. Dispatching of a
LRU to a given location would cause a
significant increase in the AOG time.
If PDU failures could be forecasted, the aircraft
could have been directed to a suitable maintenance
facility and PDU repair/replacement could take
place as part of a scheduled maintenance,
minimising the AOG time.
The first step in the design of a PHM is the
creation of a fault database, which support the
description of the component fault modes.
The fault modes are based on the operational
limits of the components and can be represented by
look up tables capturing the envelope of
performance of the LRU.
In order to understand the significance of the
fault, each fault mode is assigned a weight or
probability of its manifestation. This is evaluated
mathematically through fault tree analysis and
failure mode effects analysis (FMEA).
The probability distribution and the analysis of
the failure mode consequences/impact through a
sensitivity analysis of the failure modes provide the
foundation to create a contingency plan to mitigate
the risk of the fault realising.
Depending on the fault and its impact on the
system, different strategies to manage the health of
the system could be implemented, from design to
maintenance such as:
• Design upgrade;
• Additional redundant systems;
• Further safety monitoring systems to detect
issues if they cannot be mitigated;
• Inclusion of addition maintenance checks such
as a built in test (BIT).
Table 1 provides a subset of the failure modes
that can occur within the PDU and the system level
effects which have been simplified to aid
illustration.
The columns of the table represent the following:
1. Failure number – reference number to
support quick reference to fault case through
the paper.
2. Failure Location – the location of the fault is
referring to the Simulink model presented in
Figure 4.
3. Failure description – Brief description of the
fault.
4. Fault Monitor Triggered– Will an existing
system fault monitor identify the fault and
provide automatic corrective action (where
necessary) and annunciate the fault to the
support functions.
5. Failure Effect – Fault impact on the PDU.
6. System Issue - Fault impact on the System.
Failure numbers 1 and 3 indicate the complete
loss of hydraulic supply pressure and loss of PDU
brake capability. Both of these failures will trigger a
“system fault monitor” within the control system
which would detect the issue. For example failure
number 1: “Blockage of the hydraulic filter inside
the PDU channel 1” will cause the PDU channel 1 to
become stationary. The control system would
diagnose this via the motor velocity sensor
indicating that the motor is stationary while the
control system is commanding movement. If the
motor velocity signal remains zero for a predefined
time then a “channel jam” fault monitor would
trigger. This fault monitor would shut down the
affected channel and annunciate the condition to the
PHM system.
Failure number 3 “Complete loss of the Channel
1 PDU Brake” will prevent the PDU brake to
engage. The system would not arrest and move past
the demanded position as indicated by the PDU
position sensor. The control system would diagnose
this by triggering the uncommanded movement fault
SIMULTECH 2018 - 8th International Conference on Simulation and Modeling Methodologies, Technologies and Applications
156

monitor. This fault monitor will automatically shut
down the system because uncommanded movement
of the system is hazardous to the aircraft. The
control system would also annunciate the condition
to the PHM system.
Failures 1 and 3 are also known as reactionary
failures, which imply that if they occurred, they
would automatically shut down the system/channel.
This would lead to the loss of operation the system
for the remainder of the flight. However, if these
failures could be anticipated via a prognostic system
then the remaining useful life predicted and
maintenance of the PDU could be scheduled at an
appropriate time.
A way to support a PHM implementation is to
add additional sensors dedicated to the monitoring of
the PDU and the development of further algorithms
within the control system.
For example the “Blockage of the hydraulic
filter inside the PDU channel 1” will likely be
preceded prior by “reduction of hydraulic flow due
to partial blockage inside the filter” which is failure
number 2. This failure would produce a reduction in
performance velocity/torque envelope of the PDU.
This would be monitored over time and change in
behaviour communicated to the PHM system which
would estimate remaining useful life and make the
appropriate maintenance decisions.
Similarly “Complete loss of PDU brake due to
wear” which is failure number 4 will likely be
preceded prior by failure number 3 “Partial loss of
PDU brake due to wear”. This failure would indicate
increased stopping distances when the brake is
commanded to engage. This stopping distance can
be tracked over time and communicated to the PHM
system which would determine the degradation rate
and plan appropriate maintenance decisions.
6 PHM APPLICATIONS TO THE
POWER DRIVE UNIT
This section will demonstrate how modelling and
simulation is used within PHM applications. The
example PDU failures as provided in table 1 will be
used as case studies. Firstly the approaches used to
simulate the failures will be provided. Then the
modelling results will be provided along with the
sensors required used to monitor the health condition
will be described and then insights into the
algorithms required will be provided.
6.1 Power Drive Unit Blockage
The first failure simulated will be the progressive
blockage of hydraulic supply line within the PDU
(failure 2 in table 1) which could be due to a
clogging filter. The blockage is parametrised in the
model by multiplying the PDU manifold effective
passage area by a constant. A constant value of one
indicates that the passage area in the model is not
changed and hence no blockage occurs. However, a
value of half indicates that only half the effective
passage area is available and therefore for a given
supply pressure and environmental temperature the
restriction will directly reduce the available flow
rate.
Table 1: Example of Flap System Failure Modes – PDU.
No
Failure
Location
Failure
Description
Fault Monitor
Triggered?
Failure Effect System Issue
1
PDU
channel 1
Blockage of
hydraulic filter
inside PDU
Yes – Channel
jam monitor
detects
PDU channel 1 would
not move
PDU channel 2 would continue
operation and hence system would
continue at half speed operation.
2
PDU
channel 1
Reduction of
hydraulic flow
due to partial
blockage inside
the filter
No
PDU channel 1 would
operate with reduced
performance
PDU channel 1 operates but with
reduced performance. PDU channel
2 would continue operation and
hence system would continue below
full operating performance.
3
PDU
Brake
Complete loss
of PDU brake
due to wear
Yes – System
uncommanded
movement
monitor
detects
PDU channel 1 brake
cannot engage
System would reach the target
position but then over run the
position due to no brake. The
uncommanded movement monitor
would detect and arrest the system
4
PDU
Brake
Partial loss of
PDU brake due
to wear
No
PDU brake will
function will have
reduced capability
System would reach the target
position and stop. Stopping distance
may marginally increase.
The Use of Modelling within Prognostic Health Management Systems for a Fowler Flap System
157
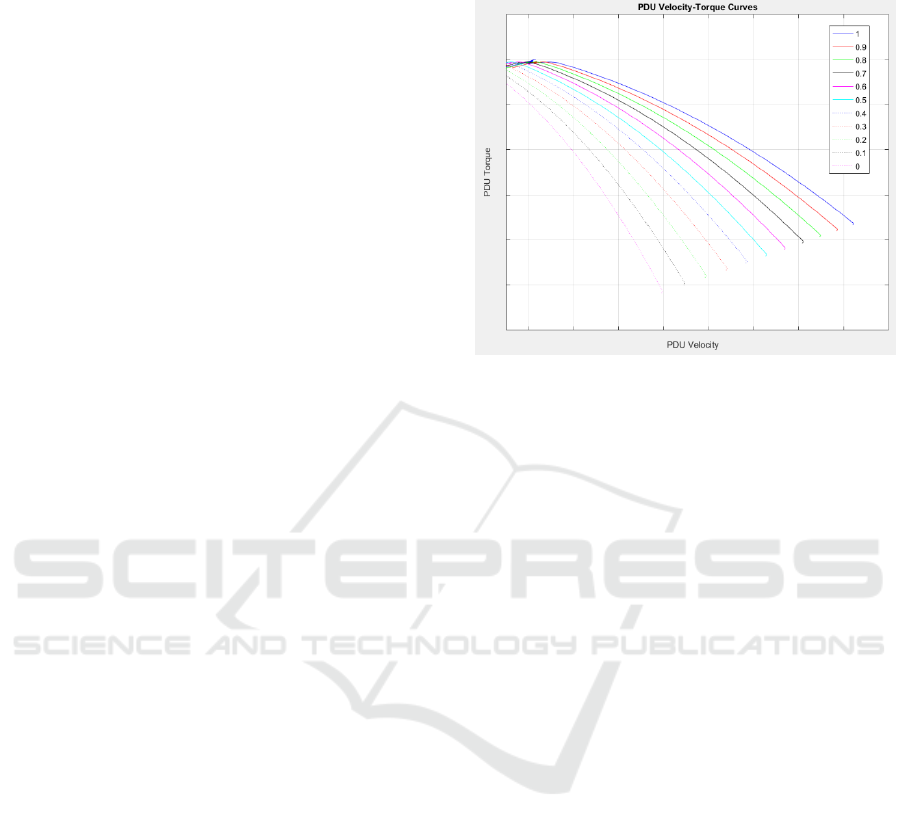
Figure 6 provides the performance envelope of
the power drive unit of output torque vs output
velocity for levels of blockage in the PDU manifold.
As the quantity of blockage increases it can be seen
that the PDU output velocity decreases for a given
output torque. When the PDU has a maximum
blockage (value of zero) the PDU operates only on
one channel and the maximum velocity capability is
halved. It is noted that these curves are valid for a
given fluid temperature and supply pressure
available. If these parameters change then the
performance envelope will be modified.
This failure mode is similar to the oil/filter
blocking on aircraft engines as described by
(Bastard, Lacaille, Coupard and Stouky, 2016).
However, direct sensors of pressure drop are not
available hence simulation can be used to map these
performances into the secondary flight control
system that monitors the following sensors:
• Output rotational velocity
• Output torque
• Hydraulic fluid temperature
The PHM system would contain a real-time
simulation model that would provide the expected
level of performance of the power drive unit. This
model would input the PDU design parameters
temperatures and measured external torques. It
would compare the measured output velocity of the
PDU relative to the expected performance model,
based on test trends mapped against flight cycles.
The difference between the actual and simulated
velocity results would provide health monitoring
information and would assess the RUL of the PDU
status. Forecasting algorithms based on simulated
flight cycles would support decision making on
timelines for the PDU’s maintenance.
PHM in this example will anticipate when
degradation of performance occurs and will
intervene before the PDU channel becomes
completely non-operational, i.e. failure number 1.
This increases availability of the PDU channel and
allow maintenance to occur at suitable time.
6.2 Degradation of PDU Brake
The next case study illustrates how system
modelling can provide input into PHM systems via
the degradation of the PDU brake described by
failure 4 in table 1. The PDU brake arrests the
secondary flight control system when it reaches the
target position. However, as this is a mechanical
brake it may be subject to wear which may start
degrading the performance of the brake but not
produce a complete loss.
Figure 6: PDU output torque vs velocity for different
amounts of PDU blockage.
The model simulates degradation of the brake by
progressively reducing the torque capability from a
scale between 0 = most capable to 1 = least capable.
The slipped distance is the difference between the
final position of the PDU output shaft to the position
when the brake was commanded to engage and can
be sensed using the PDU position sensor.
Figure 7 provides the degradation in slipped
distance with respect to PDU brake capability for
this model and indicates as the brake capability is
reduced the slipped distance increases.
The PHM system could either contain a real-time
simulation model or simulation output results
mapped into a lookup table that would provide the
expected braking distance. It would compare the
measured slipped distance of the PDU relative to the
expected braking performances. The PHM system
difference would monitor the increase slipped
between the actual and simulated output would
assess the RUL of the PDU and provide decisions
regarding the maintenance of the PDU to occur at a
suitable time.
7 CONCLUSIONS
This work highlighted the major costs for a typical
airline where the AOG case is considered a
significant contributor to costs. IVHM and PHM
have been described within the commercial aircraft
business that are platforms that reduce AOG events
by utilising legacy and real time data in conjunction
SIMULTECH 2018 - 8th International Conference on Simulation and Modeling Methodologies, Technologies and Applications
158
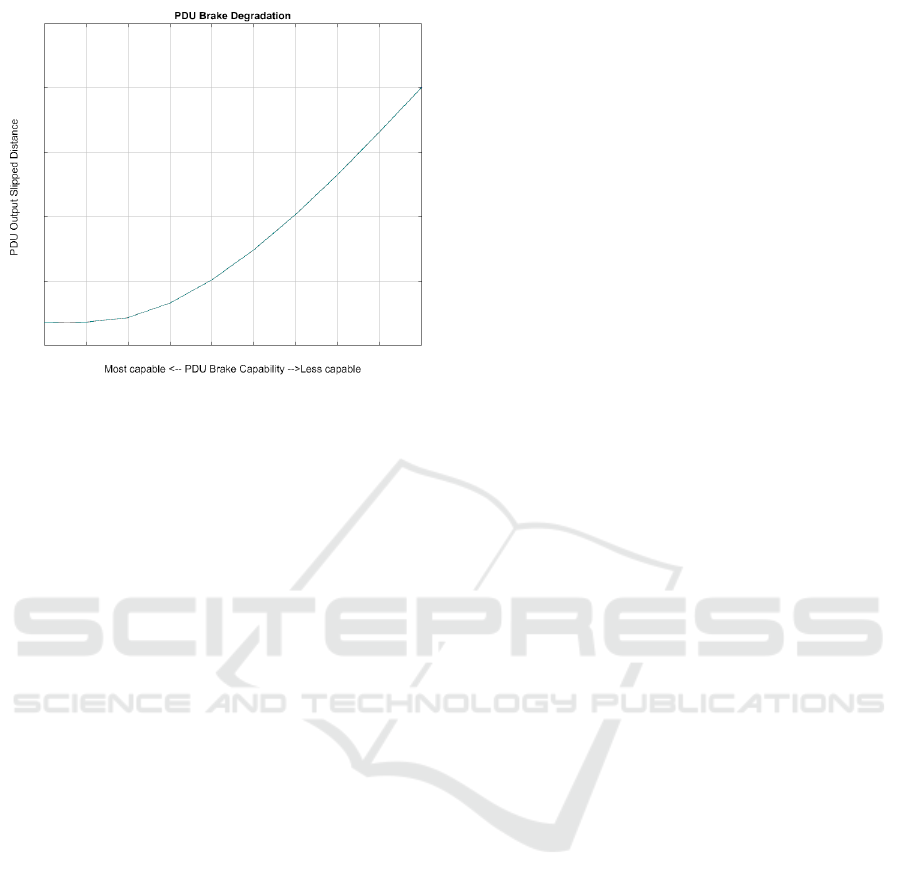
Figure 7: PDU Slipped Distance vs PDU Brake
Capability.
with simulation to predict the health of component
and subsystems. The paper provided an industry
example of how PHM can be applied to a generic
PDU within a secondary flight control system. The
system architecture was presented along with the
physical model within Simulink based upon
previous work presented by (Hardwick and Panella,
2017).
Two example failure modes of the PDU were
provided:
• PDU brake failure
• PDU filter blockage
These failure modes were used as example case
studies to demonstrate how modelling and
simulation can be used to generate data for the fault
monitoring and algorithms within the PHM process.
It is proposed that the simulation models that have
been verified using new product data should be
further developed to by verified utilising aircraft
life-cycle test data. Then PHM algorithms may be
developed using the modelling and simulation tools.
NOMENCLATURE
AOG - Aircraft on Ground
BIT - Built in Test
FADEC- Full Authority Digital Engine Controls
FMEA - Failure Mode Effects Analysis
LRU - Line Replacement Unit
IMA - Integrated Modular Avionics
IVHM - Integrated Vehicle Health Management
System
MBD - Model Based Design
ODE - Ordinary Differential Solver
PDU - Power Drive Unit
PHM - Prognostic Health Management
RGA - Rotary Geared Actuator
RUL - Remaining Useful Life
REFERENCES
Baines, T.S, Benedettini, O, Greenough, R.M. Lightfoot,
H.W. 2009. State-of-the-Art in Integrated Vehicle
Health Management. Advances in Intelligent Systems
and Computing. Proceedings of the Institution of
Mechanical Engineers, Part G: Journal of Aerospace
Engineering, 223(2), 157-170.
A. Brüggen and L. Klose, “Journal of Air Transport
Management How fleet commonality influences low-
cost airline operating performance : Empirical
evidence,” J. Air Transp. Manag., vol. 16, no. 6, pp.
299–303, 2010.
Hardwick, S., Panella, I. 2017. Dynamic Modelling of
Commercial Aircraft Secondary Flight Control
Systems. Simultech 2017 Proceedings of the 7th
International Conference on Simulation and Modeling
Methodologies, Technologies and Applications.
INSTICC, SCITEPRESS.
Kwok L. Tsui, Nan Chen, Qiang Zhou, Yizhen Hai,
WenbinWang. 2014. Prognostics and Health
Management: A Review on Data Driven Approaches.
Mathematical Problems in Engineering, Volume
2015,. Hindawi.
Slat and Flap, https://www.grc.nasa.gov/www/k-
12/airplane/flap.html
C. R. Spitzer, C. R., Avionics: Elements, Software and
Functions. 2006.
Zadeh, Desoer, 1963. “Linear System Theory – The State
Space Approach” McGraw Hill, New York
Bastard, G. Lacaille, J. Coupard, J. Stouky, Y. 2016.
Engine Health Management in Safran Aircraft
Engines. Annual Conference of the Prognostics and
Health Management Society 2016.
The Use of Modelling within Prognostic Health Management Systems for a Fowler Flap System
159
