
An LSTM-based Descriptor for Human Activities Recognition using
IMU Sensors
Sara Ashry
1,2
, Reda Elbasiony
1,3
and Walid Gomaa
1,4
1
Cyber-Physical Systems Lab (CPS), Computer Science and Engineering Department (CSE),
Egypt-Japan University of Science and Technology (E-JUST), Alexandria, Egypt
2
Computers and Systems Department, Electronic Research Institute (ERI), Giza, Egypt
3
Faculty of Engineering, Tanta University, Tanta, Egypt
4
Faculty of Engineering, Alexandria University, Alexandria, Egypt
Keywords:
Human Activity Recognition, Auto Correlation, Median, Entropy, LSTM, Smart Watch, IMU Sensors.
Abstract:
In this article, we present a public human activity dataset called ‘HAD-AW’. It consists of four types of 3D sen-
sory signals: acceleration, angular velocity, rotation displacement, and gravity for 31 activities of daily living
ADL measured by a wearable smart watch. It is created as a benchmark for algorithms comparison. We suc-
cinctly survey some existing datasets and compare them to ‘HAD-AW’. The goal is to make the dataset usable
and extendible by others. We introduce a framework of ADL recognition by making various pre-processing
steps based on statistical and physical features which we call AMED. These features are then classified using
an LSTM recurrent network. The proposed approach is compared to a random-forest algorithm. Finally, our
experiments show that the joint use of all four sensors has achieved the best prediction accuracy reaching
95.3% for all activities. It also achieves savings from 88% to 98% in the training and testing time; compared
to the random forest classifier. To show the effectiveness of the proposed method, it is evaluated on other four
public datasets: CMU-MMAC, USC-HAD, REALDISP, and Gomaa datasets.
1 INTRODUCTION
Researchers are continuously thinking in making ev-
eryday environment intelligent. For this purpose, hu-
man activity modeling and recognition is the basis of
this research trend. Supporting accurate information
on people’s activities and conducts is one of the most
key tasks in a widespread computing application; es-
pecially in the healthcare sector.
Activities of daily living (ADL) are the activi-
ties ordinary people have the ability for doing on a
daily basis like eating, moving, individual hygiene,
and dressing. For recognizing these activities, some
smart homes employ various types of sensors (Bruno
et al., 2012) such as microphones, various types of
cameras, and motion sensors. However, those sen-
sors have many restrictions concerning its fixed na-
ture. For example, if the user wants to leave the place,
he will not be observed from the fixed sensors and
his activities won’t be detectable. The other approach
depends on wearable mobile-sensors which can be
worn on different parts of the human body like wrists,
legs, waist, and chest. Wearable accelerometers are
generally used in this area, because of being small-
sized, cheap, and embedded in a lot of smart-phones,
watches, shoes, sensory gloves, and hand straps.
Seeing that wearable sensors are proper for con-
tinuous monitoring, they open the door to a world
of novel healthcare applications like physical fitness
monitoring, elder care support and etc. These applica-
tions foster recognizing human activities research by
using wearable sensors. That is why; researchers fo-
cus their efforts for prototyping new wearable sensor
systems, building human activity datasets, and devel-
oping machine learning techniques to recognize var-
ious types of human activities. In the current work,
we focus on collecting and creating HAD-AW dataset
for human activity recognition. It is clear how impor-
tant the datasets in facilitating scientific research. We
also introduce the ADL framework by making various
pre-processing steps based on physical and statistical
features which we call AMED.
Regarding wearable sensor datasets, most re-
searchers develop activities recognition models based
on their own datasets. But, some of these datasets
have small size or contain a small number of volun-
494
Ashry, S., Elbasiony, R. and Gomaa, W.
An LSTM-based Descriptor for Human Activities Recognition using IMU Sensors.
DOI: 10.5220/0006902404940501
In Proceedings of the 15th International Conference on Informatics in Control, Automation and Robotics (ICINCO 2018) - Volume 1, pages 494-501
ISBN: 978-989-758-321-6
Copyright © 2018 by SCITEPRESS – Science and Technology Publications, Lda. All rights reserved

Table 1: The selected ADLs and their motion primitives.
ADL Motion Primitives (s)
Eating Eat Sandwich with Hand.
Driving Driving Car.
Individual
Hygiene
Showering, Washing hands.
Sporting
& Hob-
bies
Cycling, Rowing, Running, GYM weight
back, Weight biceps, Weight chest,
Weight shoulders, Weight triceps, Weight
workout, Dancing, Drawing, Reading,
Playing on Piano, Playing on Guitar, Play-
ing on a violin.
Working Writing on paper, Typing on keyboard.
Cooking Cutting components, Flipping.
House
Cleaning
Washing dishes, Sweeping, Wiping,
Shaking the dust, Bed-making.
Others Wearing Clothes, Put off clothes, Praying.
teers or focus on specific activities (e.g. cooking).
Moreover, most of them are not accessible for pub-
lic usage.
In this paper, we describe how we constructed
the ”HAD-AW” dataset (human activity dataset using
Apple watch). We also compare it to a selection of
similar existing datasets. It is created to include many
of the common activities in daily life from a large and
diverse group of subjects. The data is captured by
an accurate inertial sensing device embedded at the
smart watch. We have included 31 activities as shown
in Table 1. The entire dataset are publicly available
in
1
. We aim to enlarge the activities and the num-
ber of subjects in the future, and all updates will be
supported on this website.
The paper is organized as follows. Section 1 is an
introduction. Section 2 presents a survey of related
work. Section 3 presents our collected dataset and
the proposed descriptor that is fed to LSTM network
and comparing the recognition performance with ran-
dom forest algorithm as applied in (Gomaa et al.,
2017). The descriptor is evaluated on other four pub-
lic datasets as shown at the experimentation results in
Section 4. Section 5 concludes the paper.
2 RELATED WORK
2.1 Used Sensors
At designing any sensor-based activity recognition
system, the number of sensors and their locations are
1
The HAD-AW dataset and its description are available
on: https://www.researchgate.net/publication/324136132
HAD-AW Dataset Benchmark For Human Activity
Recognition Using Apple Watch
critical parameters. Regarding sensors locations, dif-
ferent body parts have been chosen from feet to chest.
The selected locations are chosen according to the
relevant activities. For example, ambulation activi-
ties such as walking, running, etc. were detected us-
ing waist sensor. Whereas, non-ambulation activities
such as brushing teeth, eating, etc. can be classified
effectively using a wrist sensor (Bruno et al., 2013).
Most of the related work systems require obtru-
sive sensors on the throat, chest, wrist, thigh, and an-
kle connected via wired links. It restricts the human
movement, but, in healthcare applications involving
elderly people or patients with heart disease, obtru-
sive sensors are not convenient. Furthermore, some
datasets were collected under controlled conditions,
and they classified a small number of activities. These
drawbacks are solved in our approach by using only a
smart Watch at the wrist and building a large dataset
in realistic conditions without any supervision.
2.2 Major Existing Datasets
There is a limited number of the free datasets of hu-
man activities which are publicly available. We men-
tion some of them in this section. Though each one
has its own strengths, they don’t meet our objective
because they concentrate only on few types of activ-
ities. That is why; we have been motivated to col-
lect and create our own dataset. A full comparison of
these datasets and HAD-AW is shown in Table 2.
The problem of USC-HAD dataset that it con-
tains only ambulation activities and the sensor placed
at the hip that restrict the human movement. The
REALDISP dataset (Ba
˜
nos et al., 2012) focused on
evaluating sensor displacement in activity recogni-
tion by drawing scenarios. The first scenario is an
ideal-placement: the sensors are fixed by the re-
searcher. Secondly, self-placement scenario: the vol-
unteer should put sensors himself on body parts. This
dataset drawback is that it only focuses on fitness ac-
tivities by using 9 obtrusive sensors. Regarding the
CMU-MMAC (De la Torre et al., 2008) dataset; al-
though it contains higher population-size and more
plentiful modalities than any other dataset, it focuses
only on cooking activities.
3 PROPOSED DATASET AND
DESCRIPTOR FOR LSTM
3.1 HAD-AW Dataset
To overcome the limitations of the other existing
datasets which is mentioned in section2.2, our dataset
An LSTM-based Descriptor for Human Activities Recognition using IMU Sensors
495
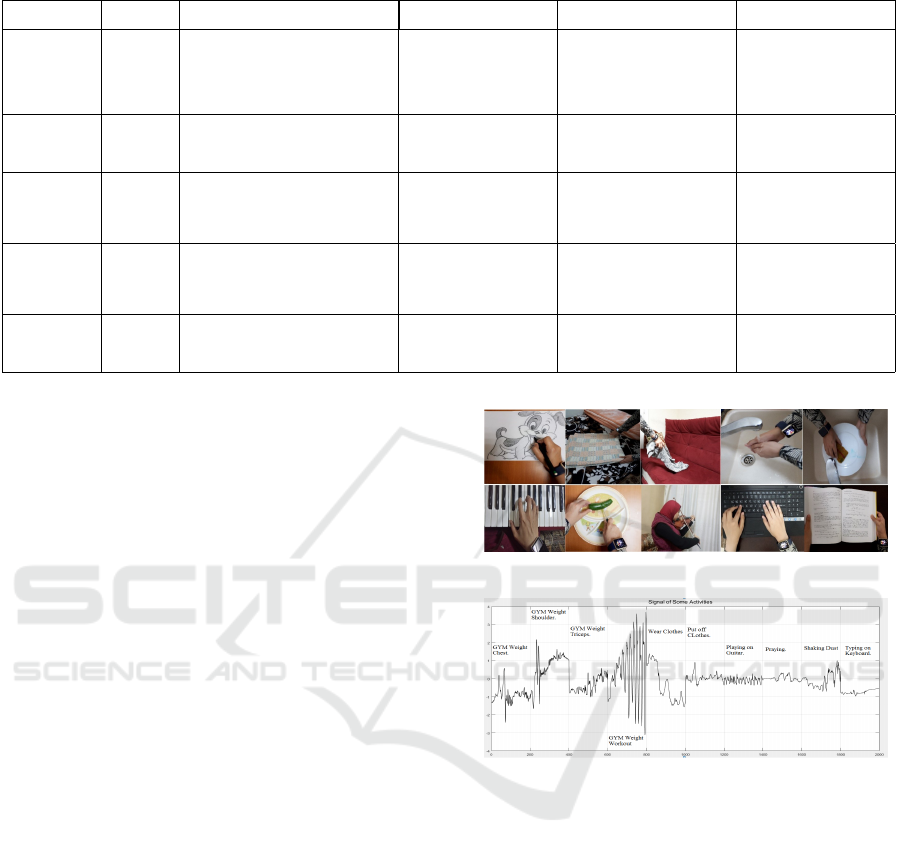
Table 2: Comparison between some of the existing datasets and HAD-AW dataset where F refers to female and M to male.
Dataset
Number of
Subjects
Activities Sensor Locations Sensors Comments
CMU-MMAC
(De la Torre
et al., 2008)
32
Food preparation, Cook five recipes:
Pizza, Sandwich, Brownies, Scrambled
eggs, Salad
Left and right forearm,
arms, calves, thighs, wrists,
abdomen and forehead.
Camera, Microphone, RFID,
3D gyroscopes, 3D accelerom-
eters, 3D magnetometer, Ambi-
ent light, Heat flux sensor, Gal-
vanic skin response, tempera-
ture, Motion Capture.
The dataset focuses on
cooking activities and it
is obtrusive due to many
sensors on human body.
USC-HAD
(Zhang and
Sawchuk,
2012)
14 (7 F, 7
M)
Walk forward, walk left, walk right,
walk up-stairs, walk down-stairs, run
forward, jump, sit on chair, stand, sleep,
elevator up, and elevator down
Front right hip
3D accelerometers, 3D gyro-
scopes
Data taken from one sensor
location but it focused on
ambulation activities.
REALDISP
dataset (Ba
˜
nos
et al., 2012)
12
Walking, Jogging, Running, Jump ,
Trunk twist, Waist/Lateral bends, for-
ward stretching, Arms elevation/ cross-
ing, Cycling, hand claps, Knees bend-
ing, Shoulders rotation and Rowing.
Left and Right calf, Left
and Right thigh, Left and
Right lower/upper arm,
Back
3D acceleration, gyroscope,
magnetic field, and 4D orienta-
tion.
The Dataset focused only
on warm up, fitness and
cool down exercises and
sensors placed on 9 obtru-
sive body parts.
(Gomaa et al.,
2017) dataset
3
Use telephone, Drink from glass, Pour
water, Eat with knife/ fork, Eat with
spoon, Climb/ Descend stairs, Walk,
Get up/Lie down bed, Stand up/ Sit
down chair, Brush teeth, Comb hair
Right wrist only.
3D accelerometers, 3D angular
velocity, 3D rotation, 3D grav-
ity.
Fourteen activities are col-
lected by Apple watch on
right wrist.
HAD-AW
16 (9 F, 7
M).
Thirty-one activities are mentioned in
table 1.
Right wrist only.
3D accelerometers, 3D angular
velocity, 3D rotation, 3D grav-
ity.
Large dataset is collected
by only Apple watch on
right wrist. 31 different ac-
tivities are recorded.
has been carefully designed with the following aims:
Firstly, many subjects with variation in gender, age,
weight, and height are considered in the dataset. Sec-
ondly, the recorded activities match the most com-
mon and basic human activities in their daily lives
as shown in Table 1. It is useful for elder care, and
personal fitness monitoring applications. Finally, the
used smart watch captures most of the human activity
signals accurately and robustly.
3.1.1 Data Collection
Sixteen subjects (9 females and 7 males) are volun-
teered to record activities by wearing an Apple watch
on the right wrist. Each subject repeats the same ac-
tion about ten times on average. So, we have 160
sample for each activity on average. Volunteers ages
range from 20 to 55 years old with weights range from
55 kg to 95 kg. The raw signals contain information
about 3D angular velocity, 3D orientation (roll, pitch,
and yaw), 3D gravity components, and 3D user accel-
eration where the sampling frequency is 50 Hz. Fig-
ure 1 shows snapshots of the data collection process.
Figure 2 shows sample of activities data from the z-
axis of the tri-axial accelerometer. We collected our
dataset using Apple watch series one. It weighs only
about thirty grams and it has a Dual-Core processor,
eight GB internal storage, and 512 MB RAM. The
newest version of it has more storage capacities.
3.2 Descriptor for LSTM
3.2.1 LSTM Recurrent Neural Network
An LSTM layer is a recurrent neural network (RNN)
layer which supports time and data series in the net-
Figure 1: Snapshots of performing different ADL activities.
Figure 2: Sample of activities data from the z-axis of the
tri-axial accelerometer.
work. The layer does extra interactions in the training
stage to help improving gradient flow over sequences.
The greatest advantage of the recurrent neural net-
works is their capability to take the contextual infor-
mation into consideration when mapping between in-
put and output sequences through hidden layer-units.
It can automatically detect general features and cap-
ture the temporal dependencies between the features
sequence (Donahue et al., 2015).
The descriptor features, which works as a classi-
fier for the whole feature sequence. Each LSTM unit
takes the updated network state from the previous unit
as shown in Fig. 3 and Fig. 4. However, LSTM has
a disadvantage of tuning a lot of parameters that need
to be chosen carefully as mentioned in section 4.3.
Equations 1, 2 define the cell state (c) and the out-
put or hidden state (h) at time step t while i, f, g, and
ICINCO 2018 - 15th International Conference on Informatics in Control, Automation and Robotics
496
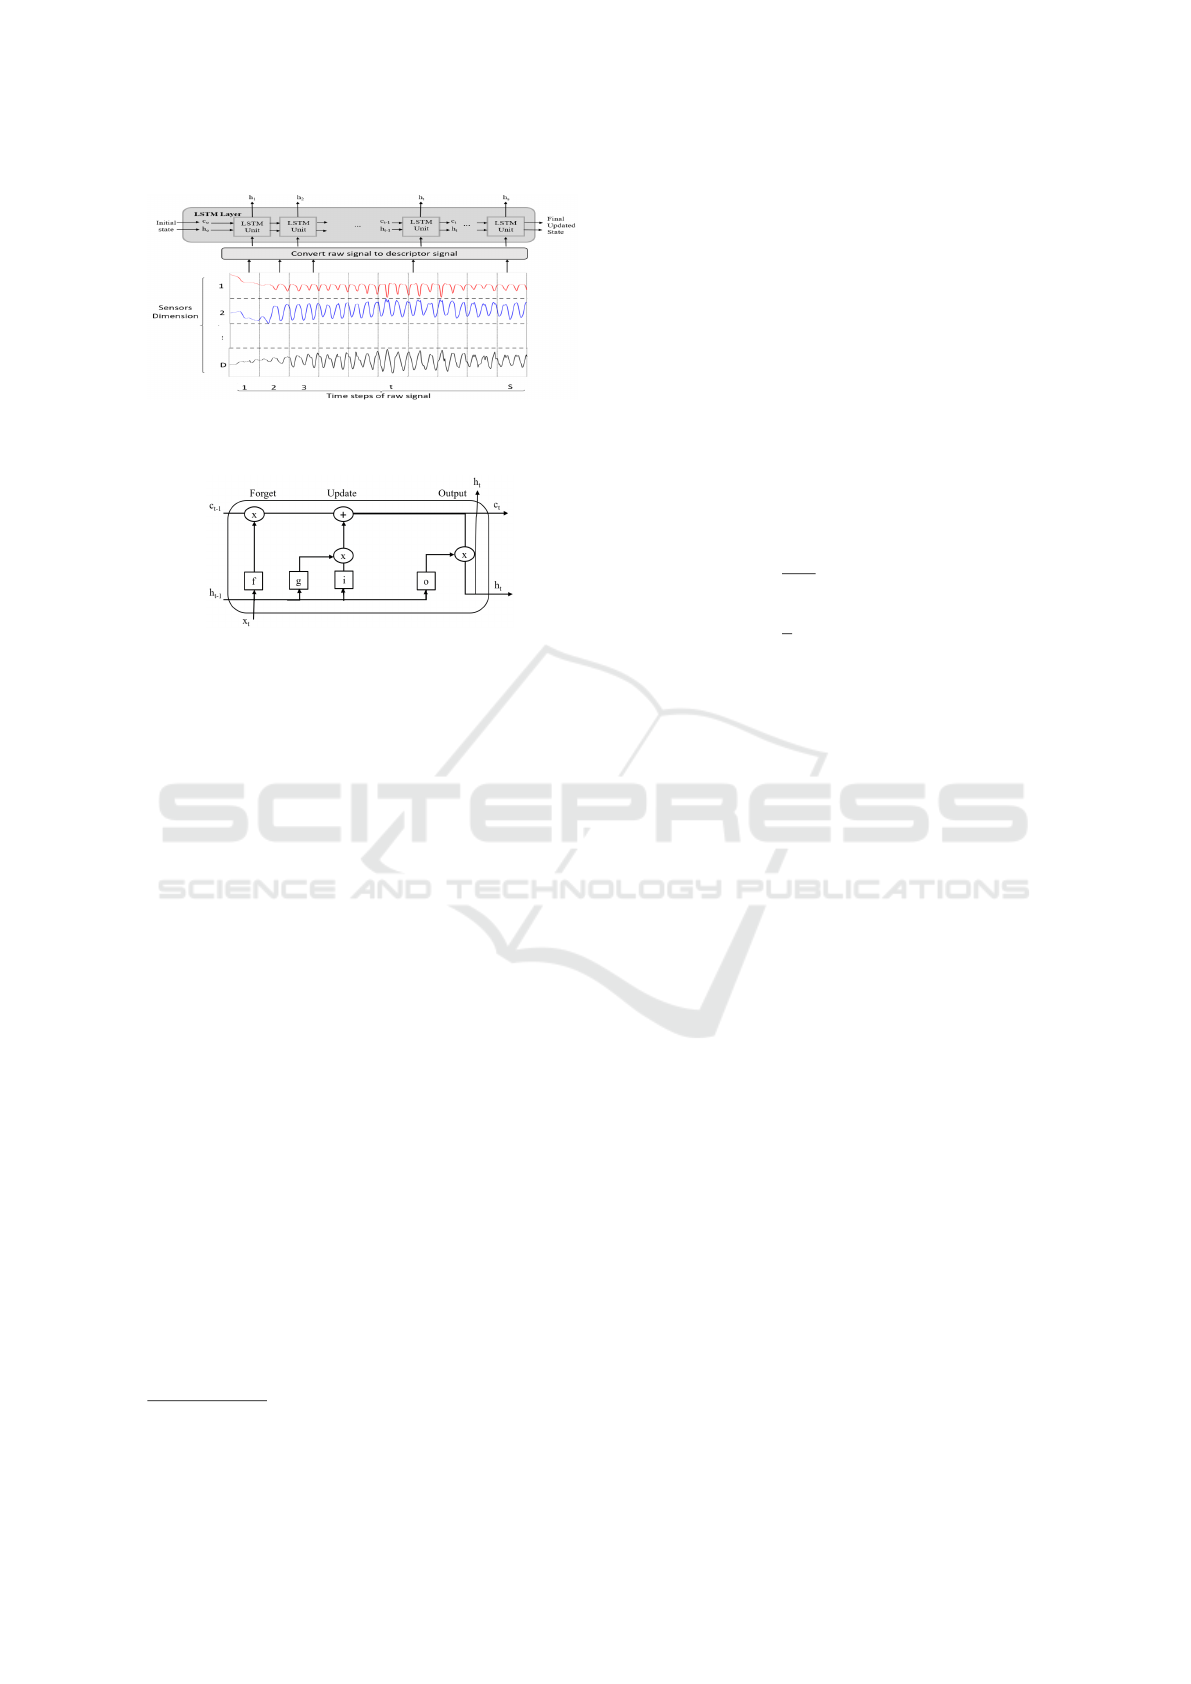
Figure 3: The flow of a time series X with D sensors signals
through an LSTM layer where h symbolizes the hidden state
and c is the cell state.
Figure 4: The LSTM unit where blocks f, i, o are sigmoid
function and block g is tanh function as illustrated in Equa-
tion 3, 4, 5, 6.
o in Equations 3, 4, 5, 6
2
show the input gate, for-
get gate, layer input, and output gate respectively.
refers to the element-wise vectors multiplication and
σ symbolizes the sigmoid function. The learnable pa-
rameters of the LSTM are the input weights (W), the
recurrent weights (R), and the bias (b).
CellState(c
t
) = f
t
c
t
−
1
+ i
t
g
t
(1)
HiddenState(h
t
) = o
t
tanh(c
t
) (2)
InputGate(i
t
) = σ(W
i
X
t
+ R
i
h
t
−
1
+ b
i
) (3)
ForgetGate( f
t
) = σ(W
f
X
t
+ R
f
h
t
−
1
+ b
f
) (4)
Layer Input(g
t
) = tanh(W
g
X
t
+ R
g
h
t
−
1
+ b
g
) (5)
Out putGate(o
t
) = σ(W
o
X
t
+ R
o
h
t
−
1
+ b
o
) (6)
3.2.2 Proposed AMED Descriptor for LSTM
In this paper, we aim at creating a robust and discrim-
inative descriptor to classify human activities with
high accuracy. Although LSTM automatically ex-
tracts some general features, it doesn’t achieve the re-
quired accuracy as will be shown in the experiment
section. In contrast, providing specific engineered
features facilitates the training process and increases
the classification accuracy. It also helps in reducing
the training and testing time. Figure 5 shows the pro-
posed framework at the training phase for learning the
network while the testing phase has the same prepro-
cessing step. I used Matlab for coding.
2
Permission is taken from the MathWorks company for
using the equations and imitating figure 3, 4 for illustration.
First, the system divides each training raw signal
into multiple parts with lengths 10 second for each
part or (500 readings as sampling rate equals 50 HZ).
By drawing the activities signals, we have observed
that 10 sec has enough representation for most of ac-
tivities pattern. Then, the autocorrelation function
with a certain lag is applied to the data as shown in
Equation 7, 8 where h is the function lag and ¯x is
the sample mean. Following that, the median and en-
tropy features are concatenated with the output of the
autocorrelation function to form a complete descrip-
tor. We call the descriptor ‘AMED’ (Autocorrelation
Median Entropy Descriptor). Figure 6 shows the de-
scriptor applied on different activities which produces
discriminative pattern for each activity.
ac f (h) =
γ(h)
γ(0)
(7)
γ(h) =
1
n
n−h
∑
t=1
(x
t+h
− ¯x)(x
t
− ¯x) (8)
The lag parameter is a tuning parameter which is
chosen based on trial and error experiments. When it
equals to 20, the highest accuracy is achieved. With-
out using any descriptor, the normal LSTM deal with
the input signal as raw data with length 500 in our
data. While using the proposed descriptor; which
convert the raw single input data with length 500 to
the AMED signal with length 23; reduces the feature
space by 95.4% for each sensor signal. It doesn’t only
reduce the features space, but significantly minimizes
the execution time, the storage space, and maximizes
the accuracy as illustrated in details in section 4.1.
4 EXPERIMENTS
In this section, we evaluate our proposed algorithm
and HAD-AW dataset via two groups of experiments.
The first group studies the change in classification ac-
curacy which results from changing the number of ac-
tivities, as well as the type and number of the selected
sensory data. It also focus on studying the effect of
using different LSTM descriptors on both the accu-
racy and time of the classification process.
The second group of experiments makes a com-
parison between our proposed algorithm and one of
the recent RF-based approach which has been pro-
posed in (Gomaa et al., 2017) for the same purpose
of recognizing human activities. The two algorithms
are applied on five different datasets.
An LSTM-based Descriptor for Human Activities Recognition using IMU Sensors
497
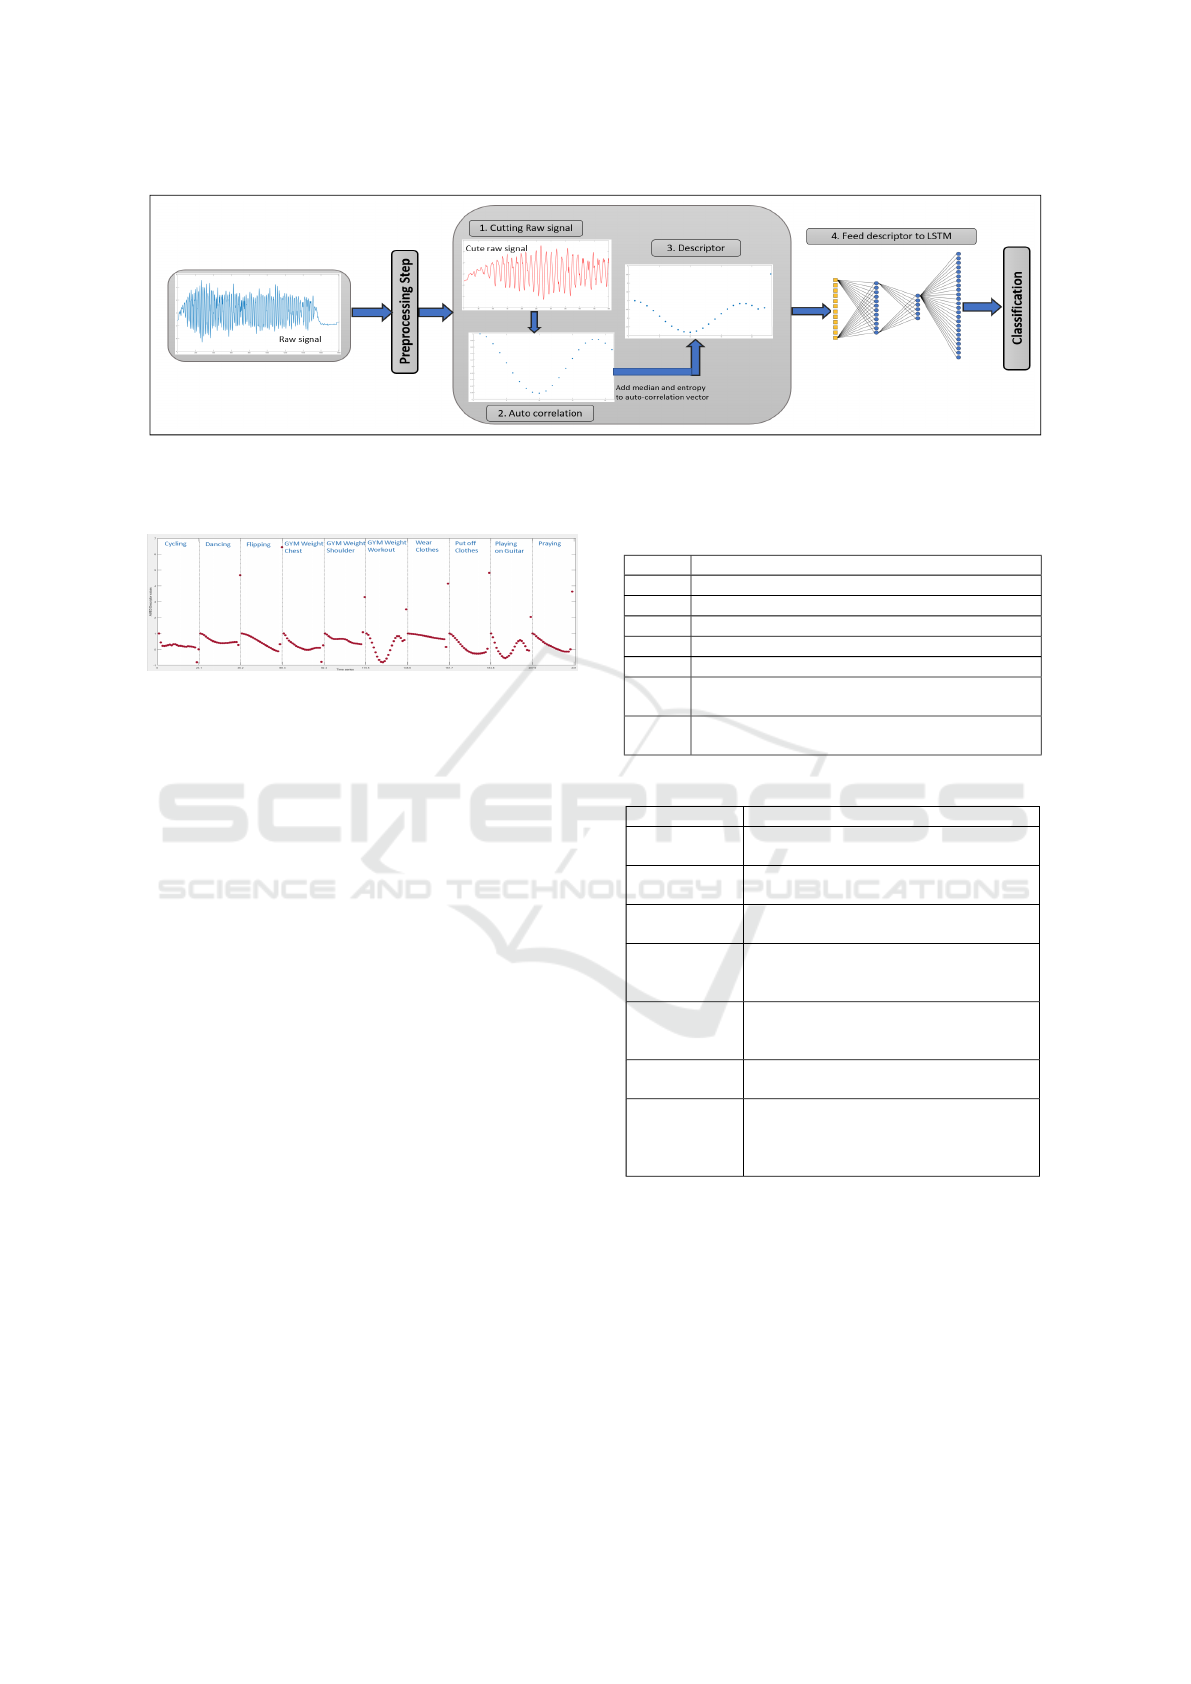
Figure 5: A simple visualization for the proposed framework in the training phase. Note that in the real experiment the input
of the preprocessing step is a matrix with dimension N*M where N is the horizontal length of 1D sensor data and M is the
length of all training samples of the 31 activities, where each sample has vertical length with all 3D sensors signals.
Figure 6: Descriptors signal series of different activities.
4.1 Experiments on HAD-AW Dataset
First, in order to study the effect of changing the num-
ber of activities and relevant sensory data on the accu-
racy, we performed a total of 49 evaluation processes
grouped into a set of 7 main tests, each test contains 7
experiments. In each test, various sensors number are
used as illustrated in Table 3.
Each test contains 7 experiments, where, in each
experiment we try to classify different number of mo-
tion primitives as illustrated in Table 4. This is done
by adding four more activities randomly to each ex-
periment until reaching the last experiment. The last
experiment includes the whole set of activities. Fig-
ure 7 shows the accuracy of the AMED descriptor
of LSTM on seven main tests containing the seven
experiments of different activities counts. Figure 8
shows the accuracy of the selected RF algorithm (Go-
maa et al., 2017) when applying the same experimen-
tal setup described in Tables 3, 4.
Next, we performed other 8 experiments using dif-
ferent input features for LSTM as illustrated in Ta-
ble 5, where all the experiments try to classify all
activities in HAD-AW dataset using all sensory data.
Table 5 shows the resulted accuracy and the total time
of the training and testing.
Table 3: Experiments setup.
Test Sensors type used in Experiment
Test 1
3D Rotation
Test 2
3D Angular Velocity
Test 3
3D Gravity
Test 4
3D Acceleration
Test 5
3D Angular Velocity, 3D Acceleration
Test 6
3D Rotation, 3D Angular Velocity, 3D Acceler-
ation
Test 7
3D Rotation, 3D Angular Velocity, 3D Gravity,
3D Acceleration
Table 4: Motion primitives in each experiment.
Experiments Activities on Each Experiment
Exp. 1
Flipping, drawing, cycling and cutting
components.
Exp. 2
Exp.1 activities plus running, driving,
eat with hand and playing on Guitar.
Exp. 3
All activities on Exp.2 plus GYM
weight back, biceps, chest and shoulder.
Exp. 4
All activities on Exp.3 plus GYM
weight triceps, workout, washing
dishes and bed making.
Exp. 5
All activities on Exp.4 plus wear
clothes, sweeping, typing on keyboard
and washing hands.
Exp. 6
All activities on Exp.5 plus reading,
rowing, writing on paper and wiping.
Exp. 7
All activities on Exp.6 plus dancing,
put off clothes, praying, shaking dust,
showering, playing on piano and play-
ing on a violin.
4.2 A Comparison with Random Forest
using Different Datasets
To evaluate the proposed algorithm, we compared it
with the RF-based algorithm at(Gomaa et al., 2017)
by applying both algorithms to five different datasets
including HAD-AW as illustrated in Table 6.
The experiments setup for testing all activities
of each dataset is as follows: Activities on CMU-
ICINCO 2018 - 15th International Conference on Informatics in Control, Automation and Robotics
498
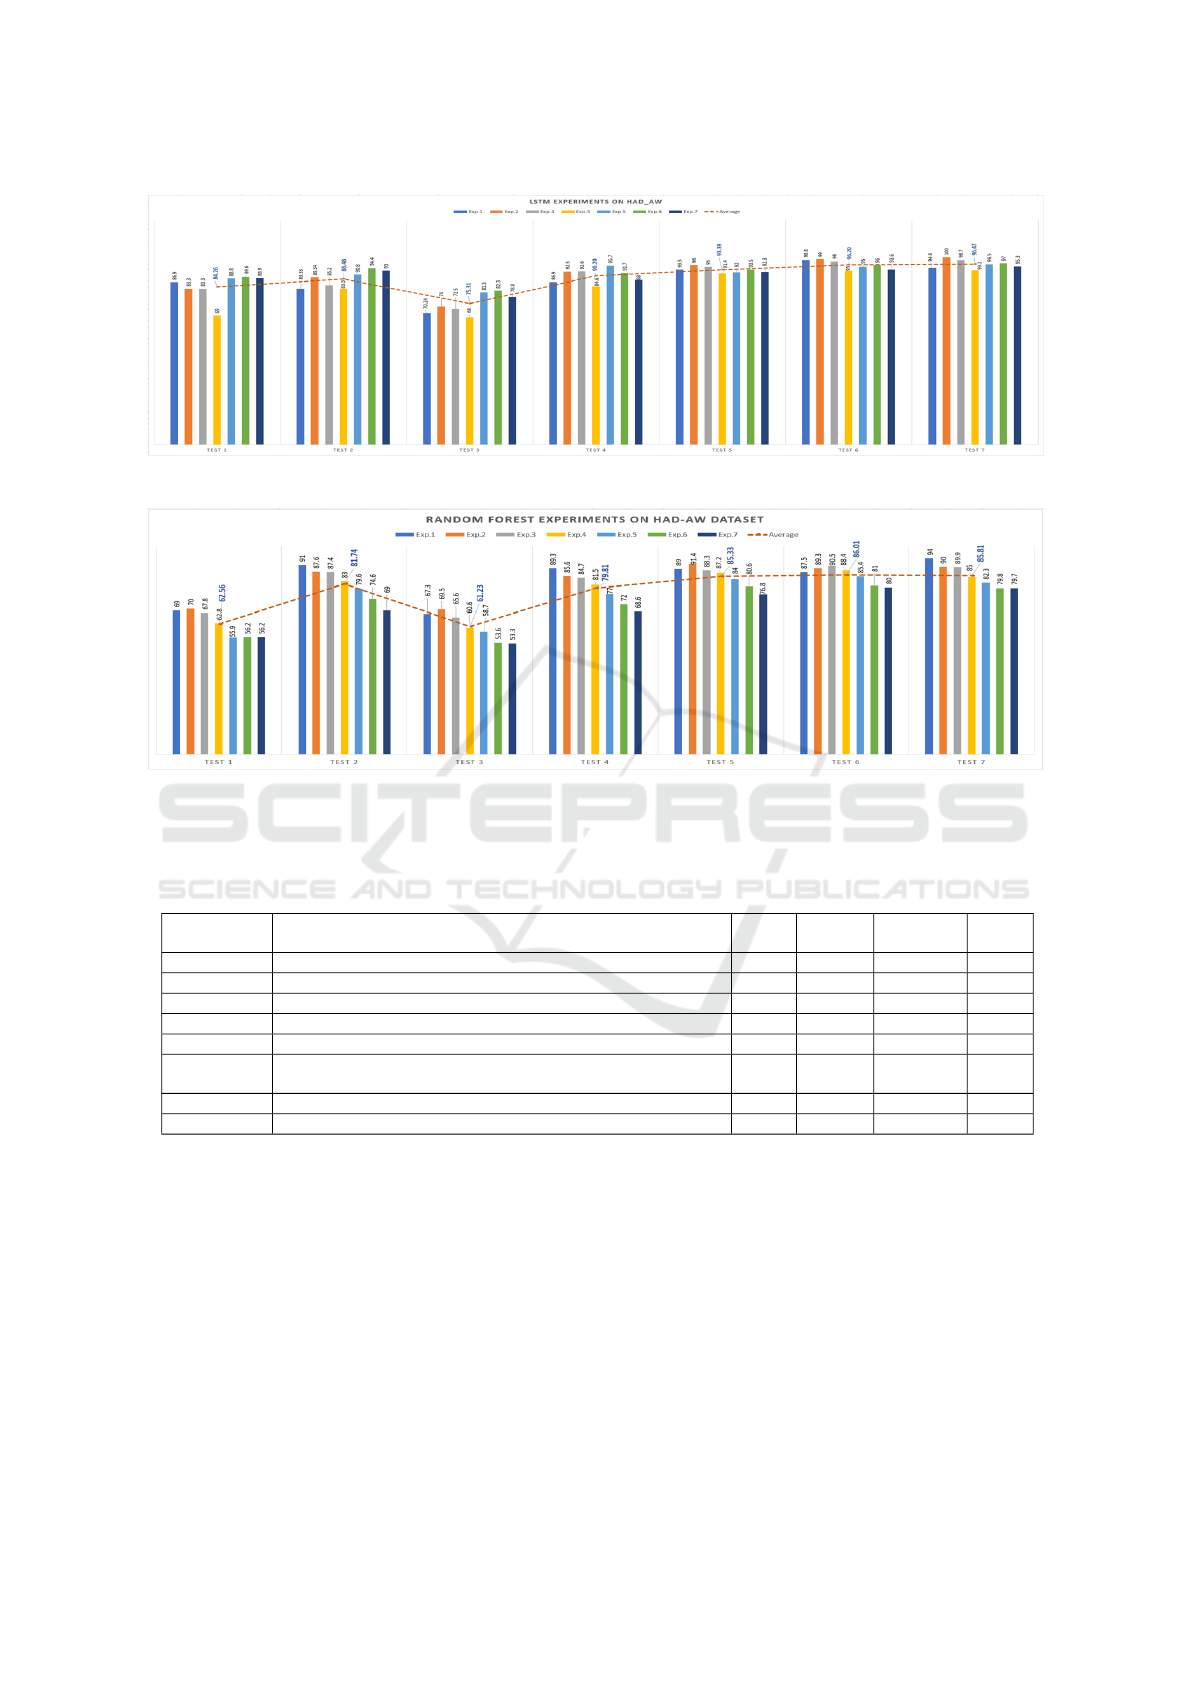
Figure 7: Accuracy of the proposed LSTM descriptor on HAD-AW with different setup categories as shown in tables 3, 4.
Figure 8: Accuracy of the RF-based method used in (Gomaa et al., 2017) on HAD-AW dataset applied on different setup
categories as described in tables 3, 4.
Table 5: A comparison between different Experiments with respect to accuracy and computational time of training and testing.
Experiments include all activities and all sensors where we test the HAD-AW dataset on different LSTM configuration regards
to number of epochs and using various input feature vector for feeding to LSTM.
Experiment Description Input Epochs Accuracy
Time
(sec)
Exp. 1
Raw data.
500 500 55% 780
Exp. 2
Normalized raw data.
500 500 50% 740
Exp. 3
Autocorrelation with lag 20 for normalized data
21 500 65% 200
Exp. 4
Autocorrelation with lag 20 for raw data.
21 500 75% 220
Exp. 5
Autocorrelation with lag 20 concatenated to median at raw data.
22 500 83% 228
Exp. 6
Autocorrelation with lag 20 concatenated with median, and en-
tropy for raw data (AMED Descriptor).
23 150 89% 180
Exp. 7
AMED Descriptor.
23 250 92% 220
Exp. 8
AMED Descriptor.
23 500 95.3% 350
MMAC (De la Torre et al., 2008); which are recorded
by random four subjects; are tested using 3D ac-
celerometer and gyroscope sensors placed on the right
wrist. The USC-HAD dataset (Zhang and Sawchuk,
2012) are tested using 3D accelerometer and gyro-
scope sensors recorded by all subjects. In REALD-
ISP Dataset (Ba
˜
nos et al., 2012), we tested all activi-
ties recorded by all volunteers using 3D accelerom-
eter and gyroscope and we used the data recorded
for the self-placement scenario as illustrated in sec-
tion 2.5. At Gomaa dataset; (Gomaa et al., 2017);
3D accelerometer, 3D rotation and 3D angular veloc-
ity sensors are used in recognition experiments. For
HAD-AW dataset, we used the data recorded by all
subjects and all IMU sensor of Apple watch.
4.3 Discussion
From figures 7 and 8, by calculating the average ac-
curacy for the all experiments of each test, we notice
that test 3 which used 3D gravity only achieved the
lowest average accuracy (75.31%, 61.23% for LSTM
and RF respectively). Tests 1 and 2 achieved rea-
sonable average accuracy 84.26%, 88.48% for LSTM
An LSTM-based Descriptor for Human Activities Recognition using IMU Sensors
499
Table 6: A comparison between RF (Gomaa et al., 2017) and the proposed LSTM-based method using different public
datasets. We use some measuring metrics like accuracy, sensitivity, specificity, precision, and F-measure by getting the
average of all these measurement over all classes.
Dataset Method Accuracy Sensitivity Specificity Precision F-Measure
Time
(Sec)
RF 61.23% 43.71% 66.08% 46.84% 43.77% 20734
CMU-MMAC
LSTM 84.44% 61.50% 90.19% 63.68% 61.57% 479.6
RF 78.5% 70.45% 98.2% 60.5% 65.1% 35460
USC-HAD
LSTM 96.31% 88.32% 85.19% 90.50% 90.8% 600
RF 89.58% 71.21% 84.6% 67.58% 69.34% 474.67
REALDISP Dataset
LSTM 94.5% 88.38% 99.58% 93.16% 90.7% 50
RF 81.64% 82.47% 98.67% 84.6% 83.53% 8515
(Gomaa et al., 2017)
LSTM 93.2% 88.29% 99.52% 91.80% 89.22% 128
RF 79.74% 81.78% 99.25% 81.87% 81.82% 18734
HAD-AW
LSTM 95.3% 92.9% 90.3% 93.7% 93.3% 350
and 62.56%, 81.74% for RF. However, Tests 4 and
5 achieved higher average accuracy 90.29%, 93.39%
for LSTM and 79.81%, 85.33% for RF. Finally tests
6 and 7 achieved the highest average accuracy 96.2%,
96.47% for LSTM and 86%, 85.81% for RF. Thus,
there is an evidence showing that the accuracy of the
classification process is strongly affected by the se-
lected sensory information.
We noticed that using combinations of all sen-
sory signals generally improve the accuracy to reach
95.3% for all activities on experiment 7 of test 7 in
figure 7. However, using both the acceleration and an-
gular velocity only also achieved an acceptable high
accuracy of 92.5% for LSTM over the all activities on
experiment 7 of test 5.
In addition, Table 5 shows the accuracy and the
processing time while trying different features on
LSTM where the experiments include all activities
and all sensory data of the HAD-AW dataset. The
AMED descriptor in experiment 8 achieves the high-
est accuracy of 95.3% and save 55.12% from the ex-
ecution time of using raw data without any prepro-
cessing in experiment 1 and it enhanced the accuracy
between two experiments by 40.3%. Additionally, in
the AMED descriptor, the size of the feature vector
for each sensor signal is only 23 while the raw sig-
nal input length is 500. Thus, it saves the storage
space by 95.4%. This shows the importance of us-
ing effective features rather than using raw data. The
proposed descriptor also save 98.3% of the execu-
tion time of training and testing achieved by the RF
method in (Gomaa et al., 2017) as RF execution time
is 18734 sec for experiment 7 and test 7 at figure 8.
When we have tried to normalize the raw data in
experiment 2, the accuracy is not enhanced as the nor-
malization reduces the band between features value
and make them between the same range which re-
duces the discrimivatiy between them and affects neg-
atively on the accuracy. We have tested different fea-
tures as in experiment 4 and 5, but they didn’t achieve
a high accuracy. AMED descriptor in experiment 6, 7,
8 achieved an accuracy of 89%, 92%, 95.3% for the
epochs number equals to 150, 250, and 500 respec-
tively with the best accuracy at epochs 500. When we
tried to increase the epochs up to 500, the accuracy
value became almost constant.
Table 6 shows some evaluation metrics for testing
the proposed approach of LSTM on different public
datasets compared with the RF-based algorithm pro-
posed in (Gomaa et al., 2017). Obviously, the total
accuracy enhancement for all different datasets ranges
from 5% to 23.3% as shown in Table 6 in addition to
the execution time of training and testing data saved
by around 88% to 98%. This enhancement can be in-
terpreted by taking into consideration that the random
forest computational cost is O(M(m ∗ nlogn)) where
n refers to the number of training instances, m refers
to the dimension of the feature space and M is the size
of the forest. The number of trees is typically on the
order of thousands. Hence, random forest consumes
more execution time. The most challenging step in
the proposed method is tunning the LSTM parameters
such as the number of epochs, batch size, and weights
size. We have empirically; using trial-and-error; cho-
sen the batch size to be 50 and the weights size to be
70. The epochs that achieved the best accuracy on
testing different datasets is chosen to be 500.
The CMU-MMAC dataset is tested by other re-
searchers algorithms. For instance, the performance
of testing IMU data alone of one subject by using
1-NN is 56.8% (Spriggs et al., 2009). Additionally,
the authors in (Zhang and Piccardi, 2015) presented
partial-ranking structural SVM (PR-SSVM) approach
with an accuracy equals to 69.8% on this dataset. Our
proposed method accuracy is 84.44% for recognizing
activities recorded by random four subjects.
Regarding the USC-HAD dataset, the authors
in (Politi et al., 2014) proposed a feature extraction
approach for SVM algorithm which achieved accu-
racy of 93.52%. They compare their proposed method
ICINCO 2018 - 15th International Conference on Informatics in Control, Automation and Robotics
500

of SVM with other three algorithms like MLP algo-
rithm, IBK approach and J48 method that achieved
an accuracy equals to 90.37%, 88.72% and 89.33%
respectively. Our approach outperform all the previ-
ous work with an accuracy reaches 96.3%.
Regarding the REALDISP dataset, authors
in (Banos et al., 2014) tested the activities after
extracting the best features on the decision trees,
K-Nearest Neighbor, Nave Bayes algorithms. The
accuracies were 90%, 96%, and 72% respectively for
the ideal-location setting data. It was 78%, 89%, 65%
for the self-placement data. The difference between
the ideal-location setting and the self placement data
are illustrated in section 2.2. Our approach achieves
94.5% for the the ideal-placement data.
5 CONCLUSION AND FUTURE
WORK
This paper introduced the HAD-AW dataset; which
includes 31 human activities; as a reference source for
human activity recognition research by using a smart
watch. Additionally, we presented a human motion
recognition framework based on tri-axial sensory data
of IMU sensors. The framework exploits a feature re-
duction as a preprocessing step where the raw signals
are parameterized by a combination of some statisti-
cal and physical features.
The experimental results indicated that the recog-
nition accuracy reaches 95.3% for HAD-AW dataset,
96.3% for USC-HAD dataset (Zhang and Sawchuk,
2012), 84.44% for CMU-MMAC dataset (De la
Torre et al., 2008), 94.5% for the REALDISP
dataset (Ba
˜
nos et al., 2012), and 93.2% for the dataset
in (Gomaa et al., 2017). Moreover, it saved the
executing time of training and testing by 88% to
98% compared to the RF-based method for different
datasets. It is worth mentioning that when we used
the proposed approach to test the combination of all
31 activities of HAD-AW dataset and the 14 activities
of (Gomaa et al., 2017) , the total accuracy reaches
90.2% for the whole 45 combined activities.
In the future, We aim to increase the number of
activities and collect new dataset using Myo device
which contains data from IMU sensors, electromyo-
graphic (EMG) sensors and magnetometer. We will
compare the recognition accuracy between both Ap-
ple watch and Myo device by using different algo-
rithms. We also plan to collect another dataset of daily
human activities in a full continuous stream scenarios
and developing approaches for recognizing them.
REFERENCES
Ba
˜
nos, O., Damas, M., Pomares, H., Rojas, I., T
´
oth, M. A.,
and Amft, O. (2012). A benchmark dataset to eval-
uate sensor displacement in activity recognition. In
Proceedings of the 2012 ACM Conference on Ubiqui-
tous Computing, pages 1026–1035. ACM.
Banos, O., Toth, M. A., Damas, M., Pomares, H., and Ro-
jas, I. (2014). Dealing with the effects of sensor dis-
placement in wearable activity recognition. Sensors,
14(6):9995–10023.
Bruno, B., Mastrogiovanni, F., Sgorbissa, A., Vernazza,
T., and Zaccaria, R. (2012). Human motion mod-
elling and recognition: A computational approach. In
Automation Science and Engineering (CASE), 2012
IEEE International Conference on, pages 156–161.
IEEE.
Bruno, B., Mastrogiovanni, F., Sgorbissa, A., Vernazza, T.,
and Zaccaria, R. (2013). Analysis of human behavior
recognition algorithms based on acceleration data. In
Robotics and Automation (ICRA), 2013 IEEE Interna-
tional Conference on, pages 1602–1607. IEEE.
De la Torre, F., Hodgins, J., Bargteil, A., Martin, X., Macey,
J., Collado, A., and Beltran, P. (2008). Guide to the
carnegie mellon university multimodal activity (cmu-
mmac) database. Robotics Institute, page 135.
Donahue, J., Anne Hendricks, L., Guadarrama, S.,
Rohrbach, M., Venugopalan, S., Saenko, K., and Dar-
rell, T. (2015). Long-term recurrent convolutional net-
works for visual recognition and description. In Pro-
ceedings of the IEEE conference on computer vision
and pattern recognition, pages 2625–2634.
Gomaa, W., Elbasiony, R., and Ashry, S. (2017). Adl clas-
sification based on autocorrelation function of iner-
tial signals. In Machine Learning and Applications
(ICMLA), 2017 16th IEEE International Conference
on, pages 833–837. IEEE.
Politi, O., Mporas, I., and Megalooikonomou, V. (2014).
Human motion detection in daily activity tasks using
wearable sensors. In Signal Processing Conference
(EUSIPCO), 2014 Proceedings of the 22nd European,
pages 2315–2319. IEEE.
Spriggs, E. H., De La Torre, F., and Hebert, M. (2009).
Temporal segmentation and activity classification
from first-person sensing. In Computer Vision and
Pattern Recognition Workshops, 2009. CVPR Work-
shops 2009. IEEE Computer Society Conference On,
pages 17–24. IEEE.
Zhang, G. and Piccardi, M. (2015). Structural svm with
partial ranking for activity segmentation and classifi-
cation. IEEE Signal Processing Letters, 22(12):2344–
2348.
Zhang, M. and Sawchuk, A. A. (2012). Usc-had: a daily ac-
tivity dataset for ubiquitous activity recognition using
wearable sensors. In Proceedings of the 2012 ACM
Conference on Ubiquitous Computing, pages 1036–
1043. ACM.
An LSTM-based Descriptor for Human Activities Recognition using IMU Sensors
501
