
Open Source Data Mining Tools Evaluation using OSSpal
Methodology
Any Keila Pereira
1
, Ana Paula Sousa
2,4
, João Ramalho Santos
3,4
and Jorge Bernardino
1,5
1
Polytechnic of Coimbra, Institute of Engineering of Coimbra – ISEC, Rua Pedro Nunes,
Quinta da Nora, 3030-199 Coimbra, Portugal
2
Reproductive Medicine Service - Hospital Center of University of Coimbra, São Jerónimo Building,
2nd Floor, Praceta Professor Mota Pinto 3000-075 Coimbra, Portugal
3
Department of Life Sciences, University of Coimbra, 3000-456 Coimbra, Portugal
4
Center for Neuroscience and Cell Biology, University of Coimbra, 3004-504, Coimbra, Portugal
5
CISUC - Centre of Informatics and Systems of University of Coimbra, DEI, Polo 2,
Pinhal de Marrocos, 3030-290 Coimbra, Portugal
Keywords: Open Source Data Mining Tools, OSSpal methodology, RapidMiner, Knime, Weka.
Abstract: Data Mining is currently one of the best technological developments that offers efficient ways to analyse
massive data sets and get hidden and useful knowledge that can have value to business. The use of Open
Source Data Mining tools has the advantage of not increasing acquisition costs for companies and
organizations. However, one of the main challenges is to choose the best Open Source Data Mining tool that
meet their specific needs. This paper compares three of the top Open Source Data Mining tools: Knime,
RapidMiner, and Weka. For the comparison the OSSpal methodology is used, combining quantitative and
qualitative evaluation measures to identify the best tool.
1 INTRODUCTION
Data mining is the process of analysing data from
different perspectives and summarizing it into useful
information (Rangra and Bansal, 2014). This
powerful technology helps organizations get
important and relevant information to create more
business value.
There are many data mining tools, and the Open
Source ones have increased and started to compete
with the commercial alternatives, as, besides the
quality, they don’t increase acquisition costs. One of
the challenges for companies is to evaluate the
characteristics of each open source data mining tool
and choose the one that meet their specific needs.
The OSSpal methodology has recently emerged
as a successor of the Business Readiness Rating
(OpenBRR). OSSpal methodology combines
quantitative and qualitative measures for evaluating
software in several categories, resulting in a
quantitative value that allows the comparison
between tools (Wasserman et al., 2017).
There are some published works that use these
methodologies to compare Open Source Software
(Marinheiro and Bernardino, 2013; Ferreira et al.,
2017; Ferreira et al., 2018).
Marinheiro and Bernardino (2013) evaluated and
compared five Open Source Business Intelligence
platforms: JasperSoft, Palo, Pentaho, SpagoBI and
Vanilla using OpenBRR methodology.
In Ferreira, Pedrosa and Bernardino (2017), the
authors used OSSpal methodology, to compare four
of the top business intelligence plarforms: BIRT,
Jaspersoft, Pentaho, and SpagoBI.
In Ferreira, Pedrosa and Bernardino (2018), the
authors used OSSpal methodology, to compare three
of the top e-commerce tools: Magento, OpenCart, and
PrestaShop.
However, to the best of our knowledge, this is the
first paper that applies the OSSpal methodology to
Open Source data mining tools.
In this paper, we evaluate three of most popular
Open Source data mining tools: Knime, RapidMiner,
and Weka, determining which tool has the best score.
The present paper is organized as follows. Section
2 describes the three Open Source data mining tools
that will be evaluated. Section 3 presents a description
of the OSSpal methodology and Section 4 presents
672
Pereira, A., Sousa, A., Santos, J. and Bernardino, J.
Open Source Data Mining Tools Evaluation using OSSpal Methodology.
DOI: 10.5220/0006907206720678
In Proceedings of the 13th International Conference on Software Technologies (ICSOFT 2018), pages 672-678
ISBN: 978-989-758-320-9
Copyright © 2018 by SCITEPRESS – Science and Technology Publications, Lda. All rights reserved
the evaluation of the tools with the application of
OSSpal methodology. Finally, Section 5 presents the
conclusions and future work.
2 OPEN SOURCE DATA MINING
TOOLS
The number of Open Source data mining tools has
increased over the last years, and this growth it is not
only in quantity but also in quality (Borges, Marques
and Bernardino, 2013).
According to the top 10 open source data mining
tools (SHRAVAN I.V, 2017) and the top 15 Best Free
Data Mining Tools (Software Testing Help, 2017) the
top 3 of Free and Open Source Data Mining tools are
RapidMiner, Weka and Orange, and in the fourth
place was Knime. Because of the large increase in
Knime users compared to other tools over the last
years, we think it is relevant to study this tool, and we
selected RapidMiner, Weka and Knime to apply the
OSSpal methodology.
In the next sections, we describe the main
characteristics of Knime, RapidMiner, and Weka.
The main advantages and limitations are also
explained.
2.1 Knime
Knime (Konstanz Information Miner) is an Open
Source data analytics, reporting and integration
platform tool based on the Eclipse platform, used in
areas like Customer Relationship Management
(CRM), customer data analysis, business intelligence,
and financial data analysis (Chauhan and Gautam,
2015).
Knime is a effectively designed data mining tool
that runs inside IBM’s Eclipse development
environment. It is a modular data exploration
platform that enables users to visually create data
flows, selectively execute some or all analysis steps,
and later investigate the results through interactive
views on data and models.
The Knime base version already incorporates over
100 processing nodes for data I/O, pre-processing and
cleansing, modelling, analysis and data mining as
well as various interactive views, such as scatter
plots, parallel coordinates and others.
The main advantages of Knime are:
Easy to use plug-in;
Easy to try out because it requires no
installation;
Ability to interface with programs that allow
for the visualization and analysis of molecular
data.
The main limitations of the tool are:
Only limited error measurement methods;
Has no wrapper methods for descriptor
selection;
Does not have automatic facility for Parameter
optimization of machine learning/statistical
methods;
Less suitable option for large complex
workflows.
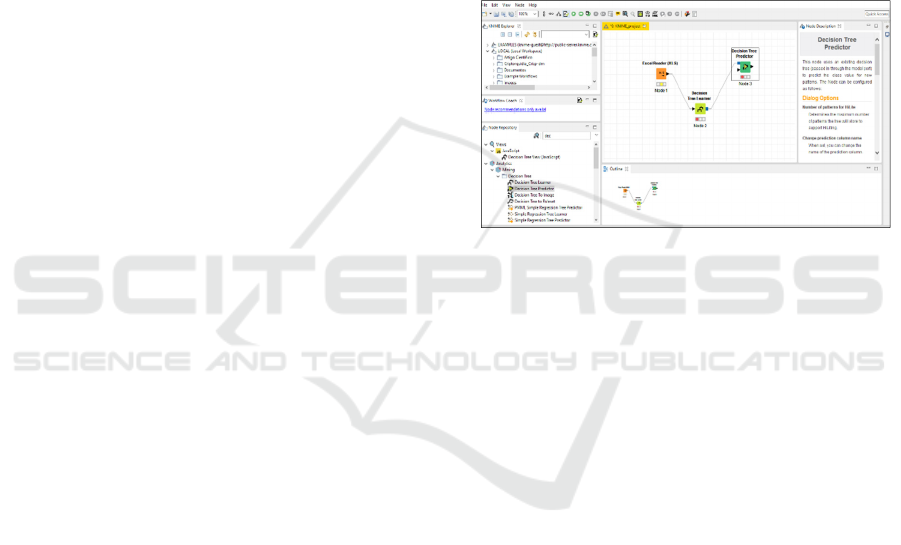
Figure 1 shows the interface of Knime.
Figure 1: Interface of Knime.
2.2 RapidMiner
RapidMiner is an Open Source Java-based, data-
mining tool that provides an integrated environment
for machine learning, data-mining, text mining,
predictive analysis, and business analytics (Chauhan
and Gautam, 2015).
It is intuitive to use and also grants access to the
help of a huge community of about 250,000 users,
according to its website. This community brings
advantages such as fast renovation of the tool but also
fast and quality assistance for new users (Almeida
and Bernardino, 2016).
It provides support for most types of databases,
which means that users can import information from
a variety of database sources to be examined and
analysed within the application.
RapidMiner represents a new approach to design
even very complicated problems by using a modular
operator concept which allows design of complex
nested operator chains for huge number of learning
problems.
XML is used to describe the operator trees
modelling knowledge discovery process and flexible
operators for data input and output file formats. It
contains more than 100 learning schemes for
regression classification and clustering analysis,
Open Source Data Mining Tools Evaluation using OSSpal Methodology
673
learning algorithms from WEKA and it supports
about twenty-two file formats.
The programming is by piping components
together in a graphic ETL work flows and Quick
Fixes are suggested to illegal work flows.
The main advantages of Rapid Miner are:
Full facility for model evaluation using cross
validation and independent validation sets;
Over 1,500 methods for data integration, data
transformation, analysis and, modelling as well
as visualization (no other solution on the
market offers more procedures and therefore
more possibilities of defining the optimal
analysis processes);
Numerous procedures, especially in the area of
attribute selection and for outlier detection,
which no other solution offers.
The main limitations of the tool are:
Limited partitioning abilities for dataset to
training and testing sets;
Limitations with data import.
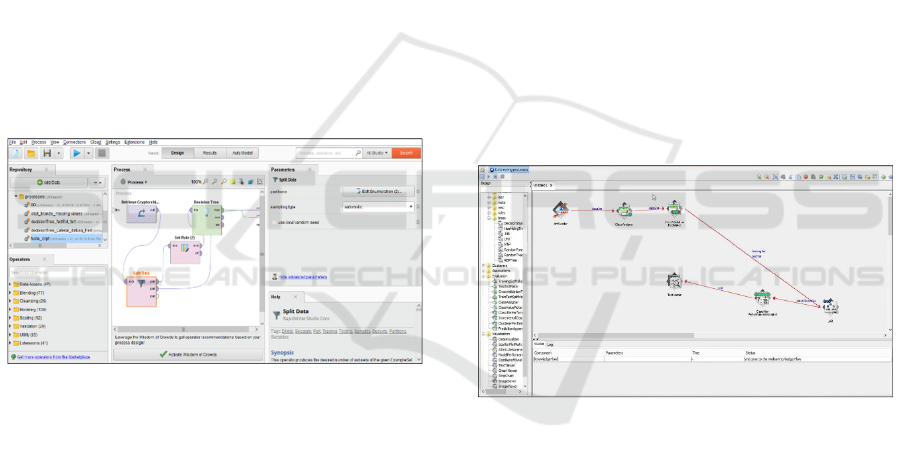
Figure 2 shows the interface of RapidMiner.
Figure 2: Interface of RapidMiner.
2.3 Weka
WEKA (Waikato Environment for Knowledge
Analysis) is a Java-based data mining tool which is a
collection of many data mining and machine learning
algorithms, including pre-processing on data,
classification, clustering, and association rule
extraction that can either be applied directly to a data
set or called from a Java code (Triguero et al., 2016)
Weka is best suited for mining association rules and
for Machine Learning. It provides three graphical
user interfaces i.e. the Explorer for exploratory data
analysis to support pre-processing, attribute selection,
learning, visualization; the Experimenter that
provides experimental environment for testing and
evaluating machine learning algorithms; and the
Knowledge Flow for new process model inspired
interface for visual design of KDD (knowledge-
discovery in databases) process.
The main advantages of Weka are:
Suitable for developing new machine learning
schemes;
Loads data file in formats of ARFF, CSV, C4.5,
binary.
It is Extensible, can be integrated into other
Java packages.
The main limitations of the tool are:
Lacks adequate documentations and suffers
from “Kitchen Sink Syndrome” where systems
are updated constantly;
Worse connectivity to Excel spreadsheet and
non-Java based databases;
CSV reader not as robust as in Rapid Miner;
Weaker in classical statistics;
Does not have the facility to save parameters
for scaling to apply to future datasets;
Does not have automatic facility for Parameter
optimization of machine learning/statistical
methods.
Figure 3 shows the interface of Weka.
Figure 3: Interface of Weka.
3 OSSpal METHODOLOGY
OSSpal is an assessment methodology that help
companies and other organizations to find high
quality Open Source Software to match their needs. It
is the successor of the Business Readiness Rating
(BRR) methodology, classified as one of the best
methodologies to evaluate open source software,
combining quantitative and qualitative evaluation
(Wasserman et al., 2017).
The Business Readiness Rating (BRR) was
conceived as an open and standard model to assess
software to increase the ease and correctness of
evaluation and accelerate the adoption of Open
ICSOFT 2018 - 13th International Conference on Software Technologies
674

Source Software (Standard, Assessment and
Software, 2005).
Unlike the BRR project, for which there was no
automated support, OSSpal has an operational,
publicly available website where users may search by
project name or category and enter ratings and
reviews for projects.
The OSSpal approach differs from other
evaluation approaches, in that it uses metrics to find
qualifying Open Source Software projects in the
various categories, but leaves the assessment of
quality and functionality of individual projects to
external reviewers, who may also add informal
comments to their scores (Wasserman et al., 2017).
To evaluate a software this methodology uses
seven categories (Wasserman et al., 2017):
Functionality: How well will the software
meet the average user’s requirements?
Operational Software Characteristics: How
secure is the software? How well does the
software perform? How well does the
software scale to a large environment? How
good is the UI? How easy to use is the
software for end-users? How easy is the
software to install, configure, deploy and
maintain?
Support and Services: How well is the
software component supported? Is there
commercial and/or community support? Are
there people and organizations that can
provide training and consulting services?
Documentation: Is there adequate tutorials
and reference documentations for the
software?
Software Technology Attributes: How well
is the software architected? How modular,
portable, flexible, extensible, open, and easy
to integrate is it? Is the design, the code, and
the tests of high quality? How complete and
error free are they?
Community and Adoption: How well is the
component adopted by community, market,
and industry? How active and lively is the
community for the software?
Development Process: What is the level of
the professionalism of the development
process and of the project organization as a
whole?
This methodology is composed of four phases
(Ferreira, Pedrosa and Bernardino, 2018):
1. First phase: Identify a software component list
to be analysed, to measure each component in
relation to the evaluation criteria and removing
from the analysis any software component that
does not satisfy the user requirements.
2. Second phase: Should attribute weights for the
categories and for the measures:
a) Assign a percentage of importance to each
category, totalling 100%;
b) For each measure within a category, it is
necessary to rank the measure in accordance
with its importance and assign the importance;
c) For each measure within a category assign the
importance by percentage, totalling all the
measures 100% of the category.
3.
Third phase: Gather data for each measure used
in each category and calculate its weighting in a
range between 1 to 5 (1 - Unacceptable, 2 - Poor,
3 - Acceptable, 4 - Very Good, 5 - Excellent);
4. Fourth phase: The qualification of the category
and the weighting factors should be used to
calculate the OSSpal final score.
The category ‘Functionality’ is calculated differently
from the others. This category intended to analyse
and evaluate the characteristics which the tools have
or should have. The method to assess this category is
as follows:
a) Set down the characteristics to analyse,
scoring them from 1 to 3 (less important to
very important);
b) Classify the characteristics in a cumulative
sum (from 1 to 3);
c) Standardize the prior result to a scale from 1
to 5.
The Functionality category will have the
following scale:
Under 65%, Score = 1 (Unacceptable);
65% - 80%, Score = 2 (Poor);
80% - 90%, Score = 3 (Acceptable);
90% - 96%, Score = 4 (Good);
Over 96%, Score = 5 (Excellent).
4 EVALUATION
To start the evaluation, first it is necessary to assign
weights to the categories in order of importance
(Marinheiro and Bernardino, 2014). Based on the
most important characteristics of a good software
(Kohli, 2014), and the characteristics that people
search when they look for open source datamining
Open Source Data Mining Tools Evaluation using OSSpal Methodology
675

tools (Giraud-Carrier and Povel, 2003), we define the
weights for each category of this methodology (see
Table 1).
Table 1: Weight assigned the categories.
Category
Weight
Functionality
25%
Operational Software
Characteristics
20%
Software Technology Attributes
15%
Documentation 12%
Community and Adoption 12%
Support and Service
10%
Development Process
6%
The most relevant characteristics in a software are the
functionalities that it has (Kohli, 2014). Due to this,
the category “Functionality” is the most important
and thus it was given the greatest weight, 25%.
In the second position, we have the category
“Operational Software Characteristics”. This
category includes the software security, reliability,
performance, scalability, usability, and setup. It
appears with 20%, because besides the functionality,
these features are the most important quality in a good
software (Courses, 2015).
“Software Technology Attributes”, this category
measures if the project is designed to be extensible,
the quality of project usage and how complete and
error free it is. It involves access to the source code to
review software architecture, code quality, and
internal documentation. It appears with 15%, because
the more extensible and less code errors the software
has, the better it is. But on the other side, as open
source software users can improve the quality of the
software architecture.
The categories “Documentation” and
“Community and Adoption” are assigned with 12%
because a good tool should have good documentation
to help in installation, configuration and maintenance
processes. “Community and Adoption” are essential
to help users with problems and to get feedback from
people who are using the software.
The “Support and Service” appears with 10%
because even though it is important, but when we talk
about open source software, people usually don´t
require commercial support, training or consulting
services; on the contrary, they look for tutorials and
documentation on the Internet.
“Development Process” was considered the less
relevant category in this evaluation, because the level
of the professionalism of the development process
and of the project organization are not required
features in open source software.
The next step is to define characteristics to analyse
the “Functionality” category. The characteristics
choose is based on the average user’s requirements
for an open source data mining tool (Giraud-Carrier
and Povel, 2003).
In Table 2 a score was assigned to each one
according to their relevance (1 - slightly important, 2-
important and 3 - very important).
Table 2: Weights for the characteristics of the functionality
category.
Characteristic Weight
Ability to program 1
Algorithms 3
Operators 3
Statistical computing 2
Predictive analysis 3
Processing nodes 3
Now, after gathering data for each measure used
in each category we calculate its weight in a range
between 1 to 5 (see Table 3).
Table 3: OSSpal score by category.
Category
Score
RapidMiner Knime Weka
Functionality 5 4 4
Operational Software
Characteristics
4.3 4.4 2
Software Technology
Attributes
4.2 4.1 2
Documentation 5 3.5 1.5
Community and
Adoption
4.8 4.1 2
Support and Service 4.2 4.1 1.5
Development Process 4.5 4.3 3.5
As we can see in Table 3, in the “Functionality”
category the RapidMiner tool stood out from the
others, obtaining the maximum score (5), which
means it has all the characteristics that we considered
in the functionality category.
ICSOFT 2018 - 13th International Conference on Software Technologies
676

For the others categories RapidMiner and Knime
has almost the same score, the biggest difference is
seen in the categories “Documentation” and
“Community and Adoption”. Although Knime has
increased its community of users, RapidMiner is still
on the top of the most used datamining tools, and
because of this it has a lot of documentation on the
internet and grants access to the help of a huge
community.
Weka is the tool that presents the worst results in
all the categories, which means that between this data
mining tools it is the worst.
After the evaluation for each category, the last
step in this methodology is to calculate the final score.
For each category, it is necessary to multiply the score
with the respective weight assigned.
RapidMiner = 5 x 0.25 + 4.3 x 0.20 + 4.2 x 0.15 + 5
x 0.12 + 4.8 x 0.12 + 4.2 x 0.1+ 4.5 x 0.06 = 4.606
Knime = 4 x 0.25 + 4.4 x 0.20 + 4.1 x 0.15 + 3.5 x
0.12 + 4.1 x 0.12 + 4.1 x 0.1 + 4.3 x 0.06 = 4.075
Weka = 4 x 0.25 + 2 x 0.20 + 2 x 0.15 + 1.5 x 0.12 +
2 x 0.12 + 1.5 x 0.1 + 3.5 x 0.06 = 2.48
Table 4: OSSpal final score.
Score
RapidMiner Knime Weka
TOTAL
4.606 4.07 2.48
As shown in Table 4, RapidMiner is the tool that
obtained the best final score with the application of
the OSSpal methodology, with a final score of 4.606
(from 1 to 5). Next Knime appears with 4.07 and then
Weka with the worst score 2.48.
5 CONCLUSIONS AND FUTURE
WORK
The rise of the Internet has meant that there are more
and more open source tools that have the same quality
and functionality as commercial tools. Therefore,
companies need to be aware of how they can lower
their costs using the open source ones according to
their specific needs.
In this paper, we analysed three of the most used
Open Source data mining tools. To do this evaluation
the information needed was collected technical
documentation, through the usability of the tools and
on the websites of the respective tools.
The application of the OSSpal methodology
allowed us to obtain a more precise assessment,
assigning a numeric value to each category tool, thus,
allowing for comparisons.
After applying the OSSpal methodology we
conclude that RapidMiner is the tool that obtained the
best final score, and this justifies the number of users
that this tool has. Knime occupy the second place
with a high score near to RapidMiner and this could
justify the huge increase of Knime users compared to
other tools over the last years and then Weka appears
with the worst score which justifies (according to the
KDnuggets Full Results and 3-year data mining tools
trends) the decrease in the number of user: 11.2% in
2015, 10.9% in 2016 and 9.8% in 2017.
As a future work, we intend to apply a greater number
of measures for each category and see if it is still the
same tool to have the best score. We also plan to
extend this study by including a higher number of
Open Source data mining tools and see if the results
would be similar.
REFERENCES
Almeida, P. and Bernardino, J. (2016) ‘A survey on open
source data mining tools for SMEs’, Advances in
Intelligent Systems and Computing, 444, pp. 253–262.
doi: 10.1007/978-3-319-31232-3_24.
Borges, L. C., Marques, V. M. and Bernardino, J. (2013)
‘Comparison of data mining techniques and tools for
data classification’, Proceedings of the International
C* Conference on Computer Science and Software
Engineering. doi: 10.1145/2494444.2494451.
Chauhan, N. and Gautam, N. (2015) ‘Parametric
Comparison of Data Mining Tools’, v, pp. 291–298.
Courses (2015) Software Quality Characteristics. Available
at: https://courses.cs.vt.edu/csonline/SE/Lessons/Quali
ties/index.html.
Ferreira, T., Pedrosa, I. and Bernardino, J. (2017)
‘Evaluating Open Source Business Intelligence Tools
using OSSpal Methodology’, Proceedings of the 9th
International Joint Conference on Knowledge
Discovery, Knowledge Engineering and Knowledge
Management, (Kdir), pp. 283–288. doi: 10.5220/0006
516402830288.
Ferreira, T., Pedrosa, I. and Bernardino, J. (2018)
‘Evaluating Open Source E-commerce Tools using
OSSpal Methodology’. 20th International Conference
on Enterprise Information Systems. doi: 10.5220/
0006790902130220.
Giraud-Carrier, C. and Povel, O. (2003) ‘Characterising
Data Mining Software’, Intelligent Data Analysis, 7(3),
pp. 181–192.
Kohli, T. (2014) What are the five most important
characteristics of a good software? Available at:
Open Source Data Mining Tools Evaluation using OSSpal Methodology
677

https://www.quora.com/What-are-the-five-most-impor
tant-characteristics-of-a-good-software.
Marinheiro, A. and Bernardino, J. (2013) ‘OpenBRR
evaluation of an open source BI suite’. doi:
10.1145/2494444.2494463.
Marinheiro, A. and Bernardino, J. (2014) ‘Experimental
Evaluation of Open Source Business Intelligence Suites
using OpenBRR’, IEEE Latin America Transactions,
13(3), pp. 810–817. doi: 10.1109/TLA.2015.7069109.
Rangra, K. and Bansal, K. L. (2014) ‘Comparative Study of
Data Mining Tools’, International Journal of Advanced
Research in Computer Science and Software
Engineering, 4(6), pp. 2277–128. doi: 10.1109 /
ICDSE.2016.7823946.
SHRAVAN I.V (2017) Top 10 open source data mining
tools. Available at: https://opensourceforu.com/2017/
03/top-10-open-source-data-mining-tools/.
Software Testing Help (2017) Top 15 Best Free Data
Mining Tools: The Most Comprehensive List.
Available at: https://www.softwaretestinghelp.com/
data-mining-tools/.
Standard, P. O., Assessment, F. and Software, O. S. (2005)
‘Business Readiness Rating for Open Source’, Access,
pp. 1–22.
Triguero, I. et al. (2016) ‘Comparison of KEEL versus open
source Data Mining tools : Knime and Weka software
Comparison of KEEL versus open source Data Mining
tools : Knime and Weka software Index of Contents’.
Wasserman, A. I. et al. (2017) ‘Open Source Systems:
Towards Robust Practices’, 496, pp. 193–203. doi:
10.1007/978-3-319-57735-7.
ICSOFT 2018 - 13th International Conference on Software Technologies
678
