
Parametric Sensitivity Analysis of a Multiple Model Adaptive
Predictive Control for Regulation of Mean Arterial Blood Pressure
Humberto A. Silva
1
, Celina P. Leão
2
and Eurico A. Seabra
3
1
Instituto Federal de Ciencia e Tecnologia do Rio Grande do Norte,Natal/RN, Brazil.
2
Departamento de Produção e Sistemas, Escola de Engenharia da Universidade do Minho, Guimarães, Portugal.
3
Departamento de Engenharia Mecânica, Escola de Engenharia da Universidade do Minho, Guimarães, Portugal.
Keywords: Blood Pressure Control, Predictive Control, Multi-Model, Sensitivity Analysis.
Abstract: Postsurgical complication of hypertension may occur in cardiac patients. To decrease the chances of
complication it is necessary to lower high blood pressure as soon as possible. Continuous infusion of
vasodilator drugs, such as sodium nitroprusside (Nipride), would quickly lower the blood pressure in most
patients. However, each patient has a different sensitivity to infusion of Nipride. The parameters and the time
delays of the blood pressure control system are initially unknown. Moreover, the parameters of the transfer
function associated with a particular patient change over time. The objective of the study is to develop a
procedure for blood pressure control in the presence of uncertainty of parameters and considerable time
delays. In this paper, a sensitivity analysis was performed, changing the parameter that controls the
convergence rate of weight factors (V). The simulation results showed significant changes in settling time
(T
s
), stressing the importance of this parameter on the control model definition. Considering a V = 0.05 was
obtained T
s
= 195s and, for same patient, T
s
= 510s by increasing the value to V = 0.4, with the Root Mean
Square Error (RMSE) varying but always lower than 1%.
1 INTRODUCTION
Arterial hypertension is an important risk factor
responsible to cause cardiovascular diseases, being
responsible for 54% of the deaths caused by stroke.
Twenty-nine percent (29%) of the world’s population
has arterial hypertension with Brazil contributing to
22% to 44%, depending on the region (Mion et al.,
2016). These numbers become very important as high
blood pressure is directly associated to
cerebrovascular events, coronary arterial disease and
mortality (Kochar and Woods, 1990).
In order to reduce the risk of postoperative
complications, the blood pressure needs to be
controlled in a quick and effective way. One way to
achieve this is to apply the infusion of vasodilators
drugs such as Sodium NitroPrusside (SNP).
However, each patient has, usually, a different
sensibility to the drug and this, in general, varies with
time and an overdose of the drug can cause serious
and undesirable side effects.
Drug Delivery Systems are the devices that are
used to infuse the drug into the human body at a
particular rate for a given time period. These systems
are widely used in cardiovascular surgical treatments
and Intensive Care Units (ICU). The drugs that are
used during treatments are mainly used to control the
blood pressure. Control of such drugs during
surgeries and in ICU are very tedious since manual
control are done by anaesthetists which is not
accurate and takes time (Sowparnika et al., 2017).
Blood pressure control of a patient under the
influence of SNP, that is a vasodilator, is modelled
through an uncertain model (Slate, 1980; Maitelli and
Yoneyama, 1997). A multi-model approach is used in
order to control the blood pressure under the
influence of this drug. Multi-model approaches are
commonly applied to control non-linear systems that
operates in long ranges (Cavalcanti et al., 2007;
Cavalcanti et al., 2009; Silva et al., 2010; Silva, 2010;
Silva et al., 2015).
The basic idea of Multiple Model Adaptive
Control (MMAC) procedure is based upon the
assumption that the plant (model which indicates the
relation between mean arterial pressure (MAP) of a
patient under the influence of SNP) can be
represented by a finite number of models and, for
510
Silva, H., Leão, C. and Seabra, E.
Parametric Sensitivity Analysis of a Multiple Model Adaptive Predictive Control for Regulation of Mean Arterial Blood Pressure.
DOI: 10.5220/0006909805100516
In Proceedings of the 15th International Conference on Informatics in Control, Automation and Robotics (ICINCO 2018) - Volume 1, pages 510-516
ISBN: 978-989-758-321-6
Copyright © 2018 by SCITEPRESS – Science and Technology Publications, Lda. All rights reserved

each model a controller can be priori designed (Silva
et al., 2015).
The objective of this paper is to develop an
adaptive method control for a blood pressure
management for any patient without changing the
controller. In this work, a multi-model adaptive
control (MMAC) is used to control the MAP. Thus, a
set of models is chosen and a Smith Predictor based
Generalized Predictive Control (SPGPC) is designed
for each chosen model. A validity function is defined
in order to calculate the weight of each controller. The
weight factor selected considers the residual error
between the output of a given model and the plant
(patient) output. Moreover, an analysis of the
influence of the parameter controlling the
convergence rate of the weight factors was carried
out.
2 PROBLEM FORMULATION
An automated drug SNP infusion system for blood
pressure control should produce good response
characteristics, such as pressure undershoot (i.e.,
maximum excursion below commanded level) less
than 10 mmHg, 20 percent settling time of 300-600
seconds, steady-state error within +5 mmHg (Silva,
2015).
A mathematical model of the mean arterial
pressure (MAP) of a patient under the influence of
SNP that was developed by (Slate, 1980) is given by:
(1)
where MAP is the mean arterial pressure, P
o
is the
initial blood pressure, ∆P(t) the change in pressure
caused by the SNP infusion, and v(t) is a stochastic
background noise. A continuous-time deterministic
model describing the relationship between the change
in the blood pressure and drug infusion rate (Slate,
1980) is as follows:
(2)
where ∆P(s) is the arterial blood pressure variation,
I(s) is the infusion rate, K is drug sensitivity, α is the
recirculation constant, T
i
is the inertial transport
delay, T
c
is the recirculation time delay, and τ is a time
constant.
The corresponding discrete-time deterministic
model for this process can be given as follows:
(3)
where q
-1
denotes a unit delay operator. The
parameters b
o
, b
m
, a
1
, d, and m are obtained from the
sampled version of the continuous-time model given
in (2).
A range of typical values for the parameters of the
model (2) for different patients is given by (Slate,
1980). Using these values and the sampling time T
s
equal to 15 s, a range of values for the parameters in
model (3) can be computed. It is given in Table 1.
Table 1: Range of values for parameters of the discrete-time
deterministic plant model for sampling time of 15 s.
Parameter
Minimum
Maximum
Nominal
b
o
0.053
3.546
0.187
b
m
0
1.418
0.075
a
1
0.606
0.779
0.741
d
2
5
3
m
2
5
3
3 MULTIPLE MODEL ADAPTIVE
CONTROL METHOD
The Multiple Model Adaptive Control (MMAC)
procedure, is based upon the assumption that the plant
can be represented by a finite number of models and,
for each model a controller can be priori designed.
An adaptive mechanism is then need to decide
which controller should be dominant for a given
plant. One procedure for solving this problem is to
consider a weighted sum of all the controller outputs,
where the weighting factors are determined by the
relative residuals between the plant response and the
model responses (Silva et al., 2015). Figure 1 depicts
the block diagram of the MMAC scheme using the
SPGPC in controller bank. The equations that
describe the model is presented on Table 2, and are
explained in more detail in the following subsections.
3.1 Model Bank Design
The model bank consists of a number of models with
constant parameters that characterize the individual
plant subspace (He et al., 1986).
These models should have the same structure as
the plant, and is described by Equation (4). Where the
output pressure from model j is calculated by (5).
0
( ) ( ) ( )MAP t P P t v t
(1 )
( ) ( )
1
ic
T s T s
Ke e
P s I s
s
1
1
()
( ) ( ); 0
1
dm
om
o
q b b q
P t I t b
aq
Parametric Sensitivity Analysis of a Multiple Model Adaptive Predictive Control for Regulation of Mean Arterial Blood Pressure
511
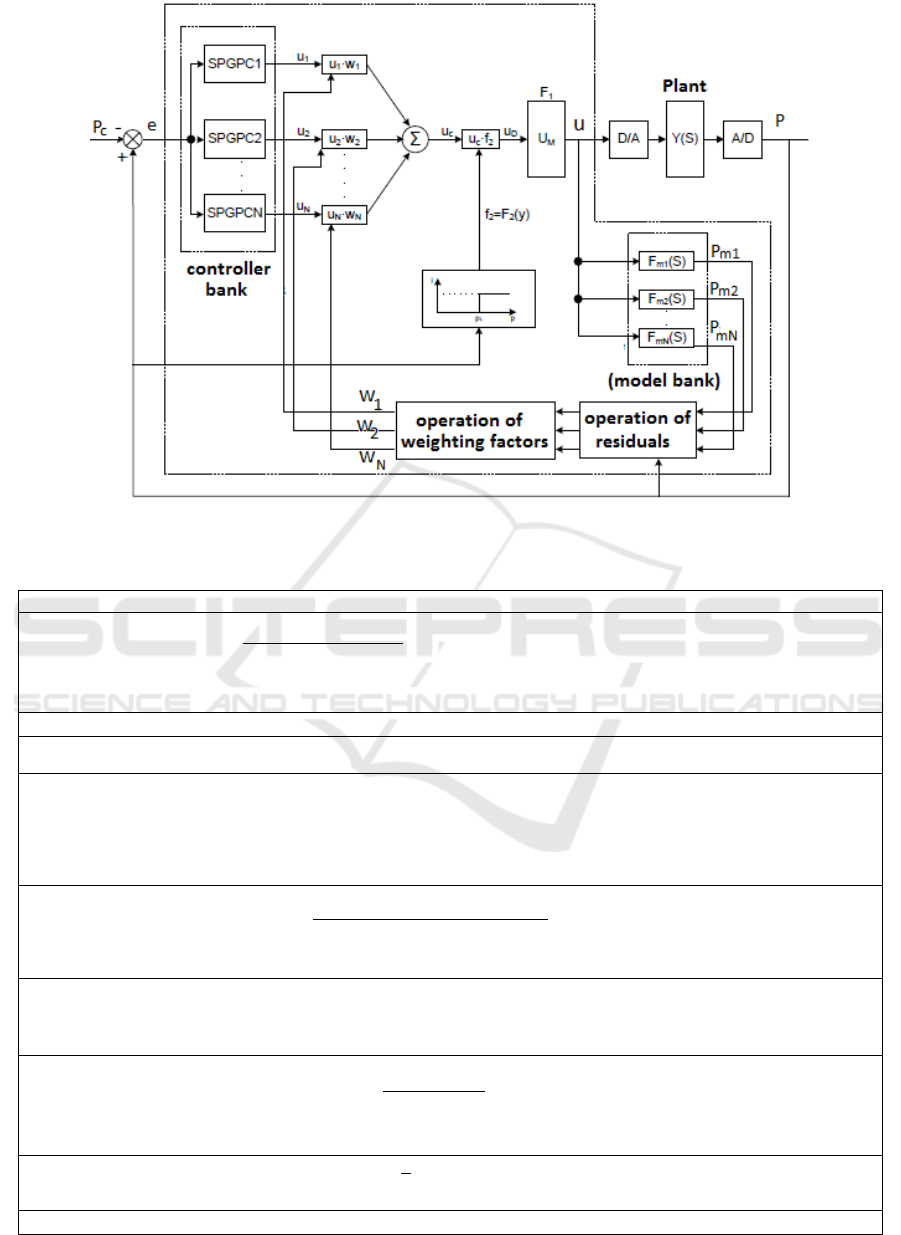
Figure 1: MMAC schema (Silva, 2015).
Table 2: Equations used in the MMAC schema.
Equation
(4)
(5)
(6)
where N is the number of models, u
c
(k) is the control variable, u
j
(k) are the individual controller outputs
and W
j
(k) are the weighting factors.
(7)
(8)
(9)
(10)
where N is the number of models
(11)
e(k) = p(k) – p
c
(12)
22
0
( ) {[ ( ) ( )]/ ( )}
j mj c
R k P k P k P P
1
( ) ( ) ( )
N
c i j
j
u k W k u k
22
'
22
1
exp[ / 2 ] ( 1)
()
exp[ / 2 ] ( 1)
jj
j
N
ii
i
R V W k
Wk
R V W k
''
'
( ) ( )
()
()
jj
j
j
W k W k
Wk
Wk
2
2
1
[ ( )]
()
[ ( )]
j
j
N
i
i
Wk
Wk
Wk
ICINCO 2018 - 15th International Conference on Informatics in Control, Automation and Robotics
512

Table 2: Equations used in the MMAC schema (cont.).
u = F
1
(u
D
) = 0, if u
D
< 0;
= F
1
(u
D
) = u
D
, if u
D
U
M
;
= F
1
(u
D
) = U
M
, if u
D
> U
M.
(13)
F
2
(p(k)) = 1, for p(k) p
L
;
or F
2
(p(k)) = 0, for p(k) < p
L
.
Where p
L
is defined as p
L
= p
c
– 20
and p
c
is the commanded pressure setpoint
(14)
The relative residual R
j
2
(k) will be defined as the
normalized squared error between plant and model
(6). At each sample time k, the model that has the
smallest residual is defined as the matching model,
which will be used to represent the plant
characteristics.
3.2 Control Algorithm
To reach desirable system performance and to
guarantee patient safety, the control algorithm should
converge quickly to the optimal values and should
react to time varying plant characteristics, as well as
ensure a reasonable rate of blood pressure change.
Table 2 shows the main equations used inr the
MMAC control algorithm that will be explained
following. Thus, the control was computed as a
weighted sum of controller bank signals, and
represented by the equation (7).
The weights were selected in 3 steps:
1. Recursive update calculated by (8);
2. Bounding away from zero by (9)
3. Normalization by (10)
where R
j
(k) are the residuals and defined in (6), V is a
parameter controlling the convergence rate of W'j(k)
with R
j
(k) and δ is a threshold to limit the importance
of past information.
Equations (7) and (8) express the basic
relationship between the control, the weighting
factors, and the relative residuals. Equation (9) is used
to delimit the importance of past information enabling
the adaptive mechanism quickly react to the new
information about the plant characteristics. Equation
(10) is used to normalize the weighting factors so that
their square sum is equal to unity.
The parameter V in (8) plays an important role in
controlling the convergence rate of W
j
(k). To see this,
let R
m
(k) and W
m
(k) represent the residual and the
weighting factor corresponding to the matching
model, then:
R
m
(k) < Rj(k) (for j ≠ m) (15)
From (8) and (10) it can be seen that:
Thus, for rapid convergence of W
j
(k), a smaller
value of V is desired; however, an excessive
reduction in V could cause a computer overflow. In
the algorithm, the initial weighting factors W
j
(0) and
the threshold δ must be determined a priori. Since
the plant gain may be located in any position in the
plant parameter space, the values for W
j
(0) were
assumed to be uniform and calculated by (11).
From (8), it is observed that a large value of δ will
improve the sensitivity of the algorithm to the new
plant information.
In Fig. 1, since the plant gain is negative, the system
error is expressed as (12). Where K is the sampling
time and p
c
, is the commanded or set-point pressure
level.
For patient safety, two nonlinear units are built
into the system. The nonlinear unit limiting infusion
rate is given by (13). Where U
M
is the allowed
maximum infusion rate. The other nonlinear unit is
used to turn off the infusion if and when hypotension
occurs (Slate, 1980). Its expression is given by (14).
4 SIMULATION RESULTS AND
SENSITIVY ANALYSIS
Computer simulations were used to evaluate the
response of the system design (Section 4) over a
representative plant parameter envelope. It were
studied the response to step command in the presence
of plant background noise, the adaptation of the
algorithm to time-varying plant parameter. Tables 3
and 4, show, the parameters of models bank and
patients tested, respectively.
Figure 2 shows a 3D chart, where it is possible to
visualize the parameters b
0
, b
m
and a
1
of the models
present in Tables 3 and 4.
The regime blood pressure considered was 150
mmHg and the multi-model controller deviation
reference of -50 mmHg. The plant background noise
v(t) was simulated as a white Gaussian noise
sequence with standard deviation of 2 mmHg.
Parametric Sensitivity Analysis of a Multiple Model Adaptive Predictive Control for Regulation of Mean Arterial Blood Pressure
513
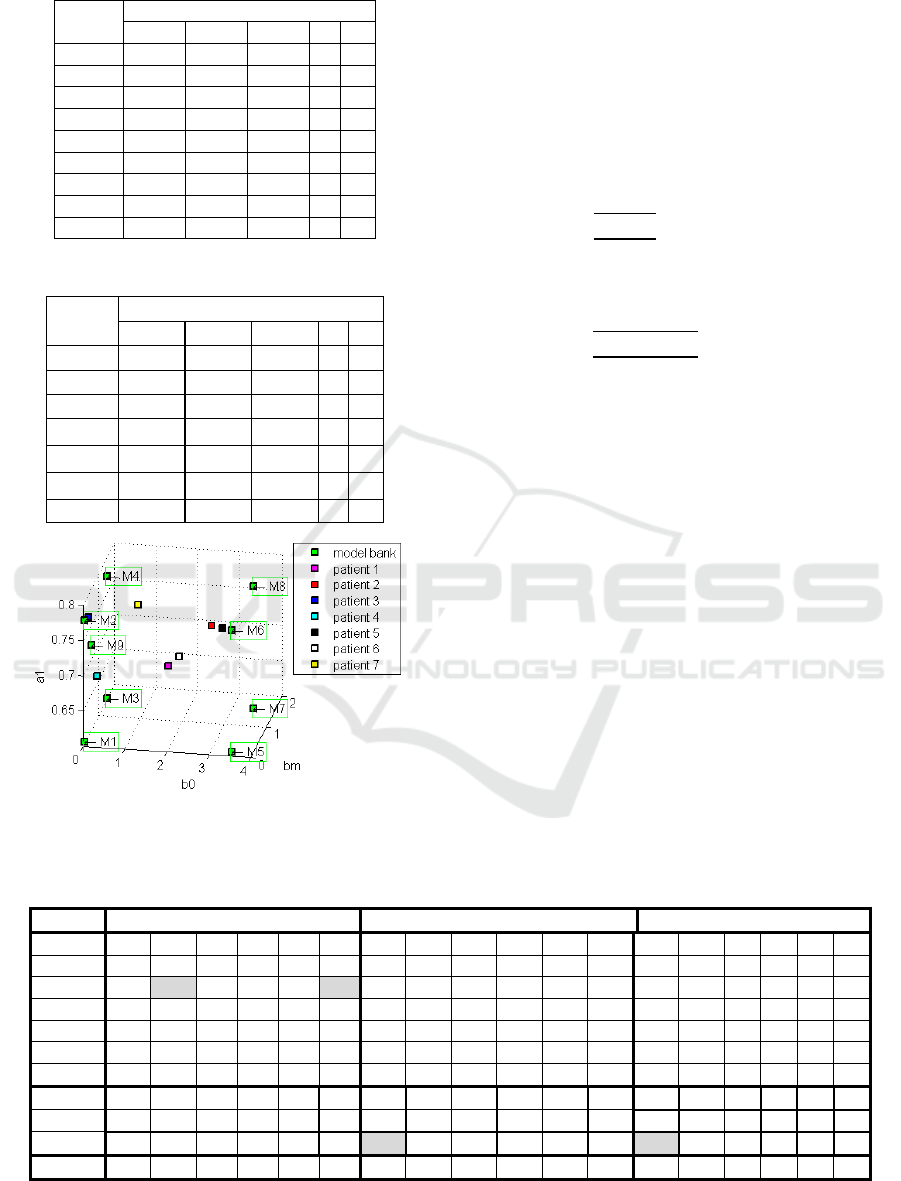
Table 3: Parameters of the models bank.
Model
Parameters
b
0
b
m
a
1
d
m
M1
0,053
0
0,606
3
3
M2
0,053
0
0,779
3
3
M3
0,053
1,418
0,606
3
3
M4
0,053
1,418
0,779
3
3
M5
3,546
0
0,606
3
3
M6
3,546
0
0,779
3
3
M7
3,546
1,418
0,606
3
3
M8
3,546
1,418
0,779
3
3
M9
0,187
0,075
0,741
3
3
Table 4: parameters of the patients tested.
Patient
Parameters
b
0
b
m
a
1
d
m
1
1,799
0,709
0,690
3
3
2
2,672
1,063
0,735
3
3
3
0,103
0,100
0,779
3
3
4
0,318
0,076
0,697
3
3
5
2,820
1,360
0,719
3
3
6
2,155
0,372
0,719
3
3
7
1,025
0,775
0,771
3
3
Figure 2: Parameters of the models bank and patients tested.
A sensitivity analysis was performed, changing
the parameter that control the convergence rate of
weight factors (V in Equation (8)) and computing the
performance indexes as follows:
1) T
s
– Settling Time = the time required for
the response curve to reach and stay within a range of
5% of the set point value;
2) Root Mean Square Erro (RMSE)
RMSE =
; (17)
3) Root Mean Square Control Effort (RMSU)
RMSU =
. (18)
Table 5 shows the relationship between parameter
V and values obtained for T
s
, RMSE and RMSU for
each simulated patient, presented in table 4.
The maximum, minimum and mean values of T
s
,
RMSE and RMSU of Table 5 were represented in the
figures 3, 4, 5, respectively.
Figures 6, 7 and 8 show blood pressure, infusion
rate and weight factors for patient 1, using V = 0.05,
respectively.
The simulations results presented in Figure 8
shown the convergence process of the weighting
factors W
j
(k), with the global control effort to be
calculated relatively to the closest model (less
residual error).
Figure 6 shows that the schema leads the blood
pressure of the chosen patient to the set reference.
These results also show that the MMSPGPC
algorithm is robust even in the presence of the plant
background noise.
Table 5: Relationship between parameter V and values obtained for T
s
, RMSE and RMSU for each simulated patient.
Patient
T
s
RMSE
RMSU
1
330
315
330
360
360
375
16,3
11,1
10,9
10,8
10,7
10,7
0,9
0,5
0,4
0,4
0,4
0,4
2
330
315
330
330
345
360
15,7
10,5
10,5
10,4
10,3
10,2
0,8
0,4
0,4
0,3
0,3
0,3
3
465
195
480
510
510
510
18,7
13,1
13,1
13,2
13,2
13,2
10,4
5,6
5,0
4,0
3,6
3,5
4
285
330
330
330
330
330
17,6
17,2
17,0
17,1
17,1
17,1
3,9
1,9
2,0
2,3
2,4
2,4
5
435
330
330
345
345
360
16,5
15,3
15,2
15,0
14,9
14,9
0,6
0,6
0,5
0,5
0,5
0,5
6
315
315
315
330
345
345
15,9
15,9
15,7
15,4
15,3
15,2
0,8
0,7
0,6
0,6
0,6
0,5
7
405
405
405
405
435
435
16,4
16,5
16,4
16,2
16,1
16,0
0,5
0,5
0,5
0,4
0,4
0,4
Average
366
315
360
373
381
388
16,7
14,2
14,1
14,0
13,9
13,9
2,5
1,5
1,3
1,2
1,2
1,1
Min
285
195
315
330
330
330
15,7
10,5
10,5
10,4
10,3
10,2
0,5
0,4
0,4
0,3
0,3
0,3
Max
465
405
480
510
510
510
18,7
17,2
17,0
17,1
17,1
17,1
10,4
5,6
5,0
4,0
3,6
3,5
V
0,01
0,05
0,1
0,2
0,3
0,4
0,01
0,05
0,1
0,2
0,3
0,4
0,01
0,05
0,1
0,2
0,3
0,4
ICINCO 2018 - 15th International Conference on Informatics in Control, Automation and Robotics
514
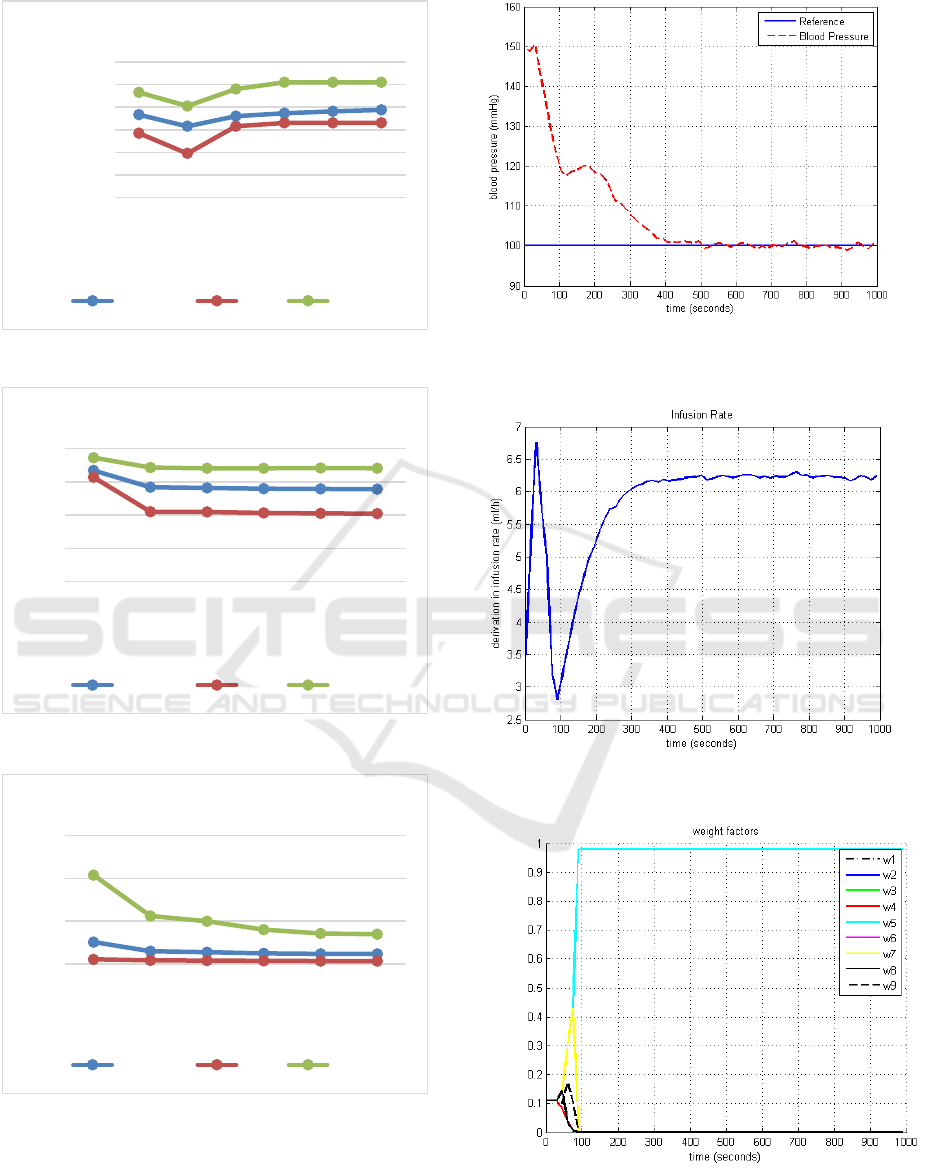
Figure 3: Average, maximum and minimum of T
s
.
Figure 4: Average, maximum and minimum of RMSE.
Figure 5: Average, maximum and minimum of RMSU.
Figure 6: Blood pressure (mmHg) for the Patient 1, using
V=0,05.
Figure 7: Infusion rate for the Patient 1, using V=0,05
Figure 8: Weight factors for the Patient 1, using V=0,05.
0 s
100 s
200 s
300 s
400 s
500 s
600 s
0,01 0,05 0,1 0,2 0,3 0,4
Time (seconds)
V
T
s
Average Min Max
0,0
5,0
10,0
15,0
20,0
0,01 0,05 0,1 0,2 0,3 0,4
V
RMSE
Average Min Max
0,0
5,0
10,0
15,0
0,01 0,05 0,1 0,2 0,3 0,4
V
RMSU
Average Min Max
Parametric Sensitivity Analysis of a Multiple Model Adaptive Predictive Control for Regulation of Mean Arterial Blood Pressure
515

5 CONCLUSIONS
The results showed that the multi-model schema
MMSPGPC presented has a great potential of
application in uncertain systems. Even in presence
of significant noise background, the presented
approach has shown a reasonable result and could
be applied, as first approach, in tests with animals.
Others basic controllers, in order to attenuate the
delay effect, may be considered.
The simulation results showed that, changes
small in V can induce large changes in settling time
(T
s
). Where, for the patient 3, was obtained T
s
=
195s using V = 0,05 and, T
s
= 510s using V = 0,4,
with the Root Mean Square Error (RMSE) varying
less than 1% and small change in RMSU.
Moreover, the sensitivity analysis shows that for
high values de V, had a slower convergence of the
weight factors, thus an increase of T
s
. However for
low values de V, for example V = 0,05, has a faster
convergence, reducing T
s
, in most cases with small
change in RMSU and RMSE. Although, overly
faster convergence, for example V ≤ 0,01, impair
control, increasing the values of T
s
, RMSE and
RMSU.
In addition, the patient 3, which is closer to a
model in models bank (see Figure 2), presented the
lowest settling time (T
s
= 195s) among all simulated
patients (see Table 5). This suggests that, the
nearness of the patient to a model in models bank,
can provide a faster convergence.
In the future, robustness tests must be
implemented with the submission of the system to a
larger range of disturbances and parameters.
Comparative studies with other control algorithms,
such as robust adaptive control, they would also be
important to accomplish in order to obtain the
accuracy of the MMSPGPC presented
REFERENCES
Cavalcanti, A. L., Fontes, A. B., Maitelli, A. L., 2007.
Generalized Predictive Control Based in
Multivariable Bilinear Multimodel. Proceedings of
8th International IFAC Symposium on Dynamics and
Control of Process Systems, pp. 91-96, Cancún.
Cavalcanti, A. L., Silva, H. A., Maitelli, A. L., 2009.
Multiple Model GPC for Blood Pressure Control. XVI
Congresso Internacional De Ingenieria Eletrónica,
Eléctrica Y Computación, INTERCON, Arequipa,
Peru.
He, W. G., Kaufman, H., Roy, R., 1986. Multiple Model
Adaptive Control Procedure for Blood Pressure
Control. IEEE Transactions on Biomedical
Engineering, vol. BME 33, no. 1.
Kochar, M. S.,Woods, K. D., 1990. Controle da
hipertensão: para enfermeiras e demais profissionais
da saúde.. 2. ed. São Paulo: Andrei, 317 pp.
Maitelli, A. L.,Yoneyama, T., 1997.Suboptimal Dual
Adaptive Control for blood pressure management.
IEEE Transactions on Biomedical Engineering, vol.
44, no. 6.
Mion, Jr. D., CA. Machado, M. Gomes et al., 2016. VII
diretrizes brasileiras de hipertensão arterial. Brazilian
Journal of Hypertension, vol. 107, no. 3, pp. 2-19.
Silva, H. A., Cavalcanti A. L. O., Maitelli, A. L., 2010.
SPGPC Multi-Modelo para controle de Pressão
Arterial. XVIII Congresso Brasileiro de Automática,
CBA, Bonito, MS, Brazil.
Silva, H. A., 2010. Multi-Model Generalized Predictive
Controller Applied to Blood Pressure Control (in
portuguese). Master's Thesis, Department of
Electrical and Computer Engineering, Universidade
Federal do Rio Grande do Norte, Rio Grande do
Norte, Brazil.
Silva, H. A., Maitelli, A. L., Leão, C. P., Seabra, E. A.,
2015. Multiple Model SPGPC for Blood Pressure
Control. 12th International Conference on
Informatics in Control, Automation and Robotics,
ICINCO, Colmar, France.
Slate, J. B., 1980. Model-based design of a controller for
infusing nitroprusside during postsurgical
hypertension. PhD thesis, University of Wisconsin-
Madison.
Sowparnika, G. C., Thirumarimurugan, M., Sivakumar V.
M., 2017. Metaphorical analysis of Tuning rules for
PI and PID Controllers in modeling an Automatic
Drug Delivery System to control Mean Arterial Blood
Pressure. International Conference on Advanced
Computing and Communication Systems, ICACCS,
Coimbatore, India.
ICINCO 2018 - 15th International Conference on Informatics in Control, Automation and Robotics
516
