
System to Predict Diseases in Vineyards and Olive Groves using Data
Mining and Geolocation
Luís Alves
1
, Rodrigo Rocha Silva
2,3
and Jorge Bernardino
1,3
1
DEIS, Polytechnic Institute of Coimbra - ISEC, Coimbra, Portugal
2
FATEC Mogi das Cruzes, São Paulo Technological College, Mogi das Cruzes, São Paulo, Brazil
3
CISUC, Centre for Informatics and Systems of the University of Coimbra, Coimbra, Portugal
Keywords: Data Mining, Geolocation, Agriculture, Crop Diseases.
Abstract: In recent years, producers have complained about the disease attacks in their crops, due in large part to the
weather conditions that lead to heavy losses. Information and communication technology in agriculture
offers a wide range of solutions to some agricultural challenges. This technology that allows progress of the
agricultural sector can increase the productivity and profitability of a farm. This paper intends to propose a
System to predict diseases in Vineyards and Olive Groves using data mining and geolocation. Grapevine
Downy Mildew, Powdery Mildew, Peacock Spot and Olive Anthracnose are the diseases used to test system
because they are diseases that cause large losses in production that result in very small profits and large
economic losses. The system captures and stores climatic, environmental data as well as data of the
producers and their properties. The data collected by the system is used to predict diseases using data
mining. We choose Random Forest algorithm provided by Weka, an open source system that provides a
collection of visualization tools and algorithms for data analysis and predictive modelling, to calculate the
probability of diseases occurrence. The main objective of the system is to help producers in a preventive
way so that there is less loss in the production of such agricultural crops.
1 INTRODUCTION
Nowadays, Information Technology (IT) is very
important for the development of various sectors
(Kapoor, 2014). In any sector, information is the key
for its development and, the agricultural sector is not
an exception to it (Allahyari and Chizari, 2010).
Agriculture is one of the most important sectors
in the world being a major livelihood for a lot of
people (Goswami, Matin and Aruma, 2012), and
could benefit tremendously from the applications of
ICTs. If relevant and right information is provided in
the right time, it can help agriculture a lot. It helps
take timely action, prepare strategies for next season
or year, speculate the market changes and avoid
unfavorable circumstances. The potential of IT can
be assessed as a tool for direct contribution to
agricultural productivity and as an indirect tool for
empowering farmers to take informed and quality
decisions which will have positive impact on the
way agriculture and allied activities are conducted
(Kapoor, 2014). IT has made its way into the
agricultural sector, and with positive results such as
improved decision making, better planning,
community involvement, agricultural breakthroughs
and agriculture for everyone (Mitra, 2014). So, the
development of agriculture may depend on how fast
and relevant information is provided to the end
users.
In recent years, producers have complained
about the disease attacks in their crops, due - in large
part - to the weather conditions that lead to heavy
losses (Ghini, Hamada and Bettiol, 2008). Grapevine
Downy Mildew (Plasmopara Viticola) and Powdery
Mildew (Uncinula necator) are two of the most
important diseases that infect Vineyards and
Peacock Spot (Cycloconium oleaginum) and Olive
Anthracnose (Gloeosporium Olivarum) diseases are
two of the most important diseases that infect Olive
Groves worldwide. These diseases cause large losses
in production that result in very small profits and
large economic losses. Given the economic
importance of these diseases, their occurrence can be
prevented and reduced through the correct use of
digital information.
Alves, L., Silva, R. and Bernardino, J.
System to Predict Diseases in Vineyards and Olive Groves using Data Mining and Geolocation.
DOI: 10.5220/0006914306790687
In Proceedings of the 13th International Conference on Software Technologies (ICSOFT 2018), pages 679-687
ISBN: 978-989-758-320-9
Copyright © 2018 by SCITEPRESS – Science and Technology Publications, Lda. All rights reserved
679

We propose a System to predict diseases in
Vineyards and Olive Groves using data mining and
geolocation. We test Random Forest classification
data mining algorithm in agricultural domain to
predict some transmissible diseases in vines and
olive groves based on symptoms and weather data
Data mining is an emerging technology that can
aid in the discovery of rules and patterns in sets of
data. The potential applications of data mining
techniques in domains such as agriculture are
numerous (Milovic and Radojevic, 2015). Applying
data mining in the agricultural field make possible
extract useful knowledge and trends (Milovic and
Radojevic, 2015). Knowledge gained with the use of
data mining techniques can be used to increase work
efficiency and improve decision making quality that
will rise success of the agricultural sector (Milovic
and Radojevic, 2015). Appropriate technology and
analytical techniques are required for measuring data
mining results, as well as reporting and tracking
systems. Agricultural organizations that use data
mining applications have the possibility to predict
future risk of disease and to make adequate
decisions about their treatments. We choose one of
the most popular software tools, called Weka, that
gathers a number of schemes and allows users to run
them on real – world data sets and interpret and
compare the results.
The main contributions of this paper are a new
approach for using data mining and geolocation in
agricultural domain to predict some transmissible
diseases in vines and olive groves based on
symptoms and weather data that will assist the
producer and help reduce unnecessary costs.
The remainder of this paper is organized as
follows. Section 2 describes related work. Section 3
describes the proposed System. Section 4 describes
geolocation. Section 5 describes weather forecasting.
Section 6 describes experimental evaluation.
Section 7 discuss the results. Finally, Section 8
concludes the paper and presents future work.
2 RELATED WORK
Information technology is more and more
implemented in agriculture enterprises in order to
respond to the needs of agronomists and managers in
their daily decision making activities (Milovic and
Radojevic, 2015).
Mobile apps in the agriculture sector can be the
best option to increase agricultural countries
production (Patel and Patel, 2016).
In this section we talk about some existing
application in agriculture field.
FarmManager – The management of small
farms, designed and developed to respond to the
needs and characteristics of farmers. It can store
database, do farm customization, easy field
management, land field data, easy job recording
process, employees and equipment (Lantzos,
Koykoyris and Salampasis, 2013).
AgroMobile – Developed specially to assist
farmers in agricultural needs. It is used for botanical
species recognition and disease detection using a
simple mobile phone with camera (Prasad, Peddoju
and Ghosh, 2013).
Agriculture Supply Chain Management – The
complete package for farmers who want to do
farming on sugarcane and obtain good production
with proper management (Chirmade et al., 2015).
E-agree – Used to detect leaf diseases. Also
provides online market place, weather report, market
rate guide and soil information to the farmer (Reddy
et al., 2015).
Agricultural Decision Support System –
Provide information for cultivation of various kinds
of crops in various type of atmosphere (Koli and
Jadhav, 2013).
Krishi Ville – It takes care of the updates of the
different agricultural commodities, weather forecast
updates or agricultural news updates. The
application has been designed taking Indian farming
into consideration (Singhal, Verma and Shukla,
2011).
Scheduling, Controlling and Monitoring of
Agricultural Devices – Used by the farmer for
remotely controlling the motor and pesticides
proportion, monitoring the farming activities going
on in the farm. It also allows improving the
efficiency of the irrigation process (Choudhary et
al., 2015).
MahaFarm – Helps in their farming activities
that include Agro based crop information, weather
updates, daily market prices and news informational
updates (Bhave, Joshi and Fernandes, 2014).
Solution for farmer consumer interaction –
Provides information to farmers regarding how to
get access to better inputs and gain more
productivity. It also gives information such as the
activities he should perform right from the time
when the seed germinates till the day when the crop
is ready to be harvested (Radhika, 2015).
Kharif and Rabi Crop Diseases Information –
Provides all Kharif and Rabi diseases details
information such as types of diseases, pesticides
ICSOFT 2018 - 13th International Conference on Software Technologies
680

used, method for applying pesticides (Patel, Thakkar
and Desai, 2014).
Irrigation Control System – Efficient use of
water and power. Helps the farmer to ON/OFF the
motor without his physical presence in the field
(Shabadi et al., 2014). Irrigation Control system is
only directed to control the efficient use of water and
power and not for crop information, weather forecast
and farm management.
Farmer Helping Services – Offers all the
Horticulture information about flowers, fruits and
vegetables (Patel, Thakkar and Radadiya, 2014).
Farmer Helping Services has advantages like
horticulture information but does not allow
producers to manage their farms and neither informs
about risk of diseases to occur.
Agrobase – “Agrobase” is an app designed to be
easy to use in the field, practical assistance for
agricultural consultants, farmers, trainees and
students of Agronomy and other agricultural related
areas. This app helps agronomists, farmers,
distributors and agricultural contractors easily find a
product by searching for active material, name,
category or culture. In recognitions in the field,
farmers and agronomists can easily identify weeds,
pests, insects, diseases, looking for common name,
Latin name, category or culture (Agrobase, 2017).
OpenPD – OpenPD is a mobile app that
provides an on-the-field and on-the-fly system for
fast identification of plant pests and diseases. It is
easy to use, based on open community and peer
learning (OpenPD, 2017).
We’ve found that many of the apps are static.
Instead of that, dynamic apps will be better to use.
The main difference between these apps and ours
work is that we make a system which use data
mining to predict diseases occurring on the basis of
climatic, environmental and other favorable
variables and geolocation to help farmers in their
farms. This System has a list of functionalities into
the one single app.
3 THE SYSTEM
Finding digital content related to agriculture is easy
but requires searching at various sources and
sometimes, the data is ambiguous and incomplete.
The data regarding farming are available from many
sources like printed media, audio and visual aids,
newspaper, TV, internet, mobile and others but the
formats and structures of data are dissimilar. It’s
very hard for a farmer to get the information and
understand the various pieces of information which
are disseminated from various sources. Sometimes
many manual steps are required while processing
data for transforming data from one format to
another (Patel and Patel, 2016).
Many times, a farmer gets confused when taking
decision regarding the selection of fertilizer,
pesticide and the time to take particular farming
actions.
3.1 The Propose
Mobile and Web apps in the arena of agriculture can
be the best option to increase countries agriculture
production. The goal is to create a system where
every user related with agriculture can manage his
crops, protecting them from diseases.
The main objective of this system is to help the
farmer in his farms and make all the useful
information available in a system. This system
provides various features such as:
User registration;
Property registration;
Symptoms registration in a given culture;
Disease risk prediction based on symptoms and
weather data;
Geolocation of all properties;
Risk history of disease in properties;
Registry of disease occurrence;
Query of weather data hourly and daily;
Property monitoring;
Regions registration.
Our aim is to take advantage of meteorological
data collected by devices in properties and data
coming from external APIs, symptoms registration
in a given agriculture by farmers and other data for
predicting risk of diseases. Merging these two
concepts (data collected and diseases) can bring
some advantages, such as:
Cost Reductions;
Assisted task execution;
Greater competitiveness in the agricultural
sector;
Productivity increase.
Data mining is used for predicting risk of
diseases, bringing more improvements in the
recommendation and searching of treatments.
We’ve chosen Weka - an open source system that
provides collection of visualization tools and
algorithms for data analysis and predictive
modelling (Milovic and Radojevic, 2015). We have
conducted a comparison study based on accuracy
between algorithms provided by Weka,
System to Predict Diseases in Vineyards and Olive Groves using Data Mining and Geolocation
681
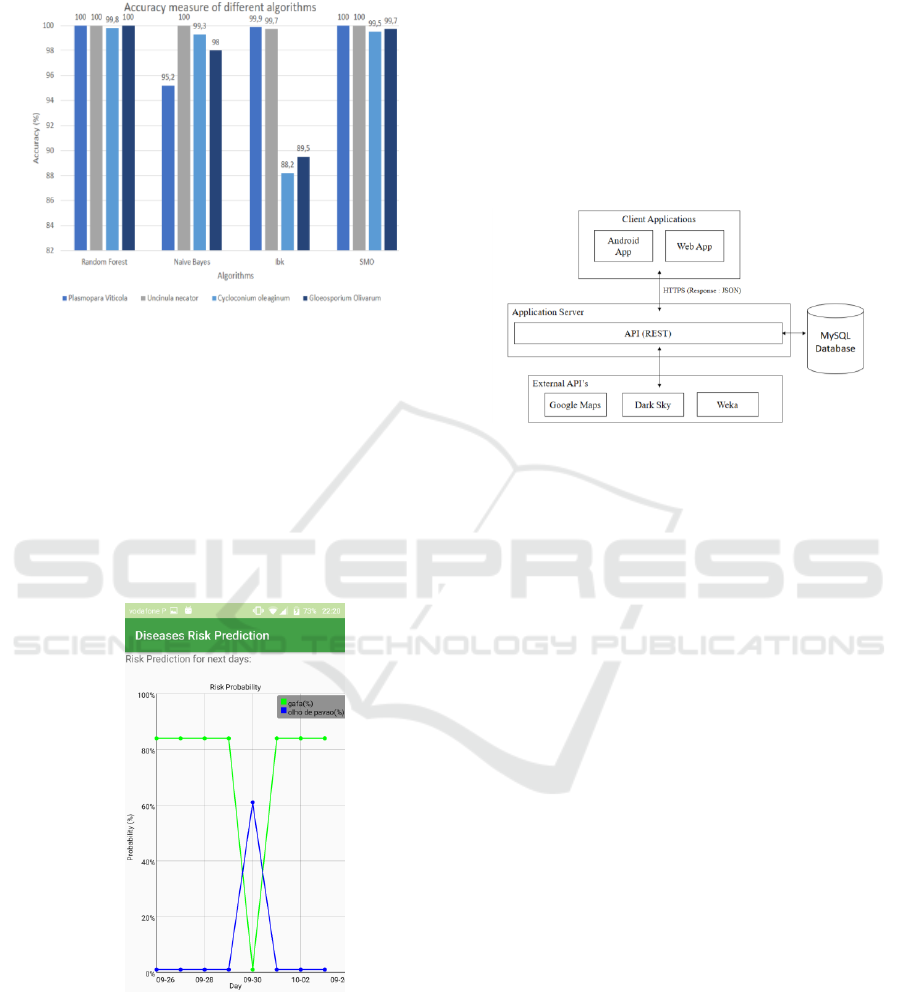
corresponding to different classification and the
Random Forest algorithm was the best (Figure 1).
Figure 1: Accuracy measure of different algorithms.
So, the data mining classification technique Random
Forest is used in order to calculate risk probability of
disease. We calculate the probability of diseases’
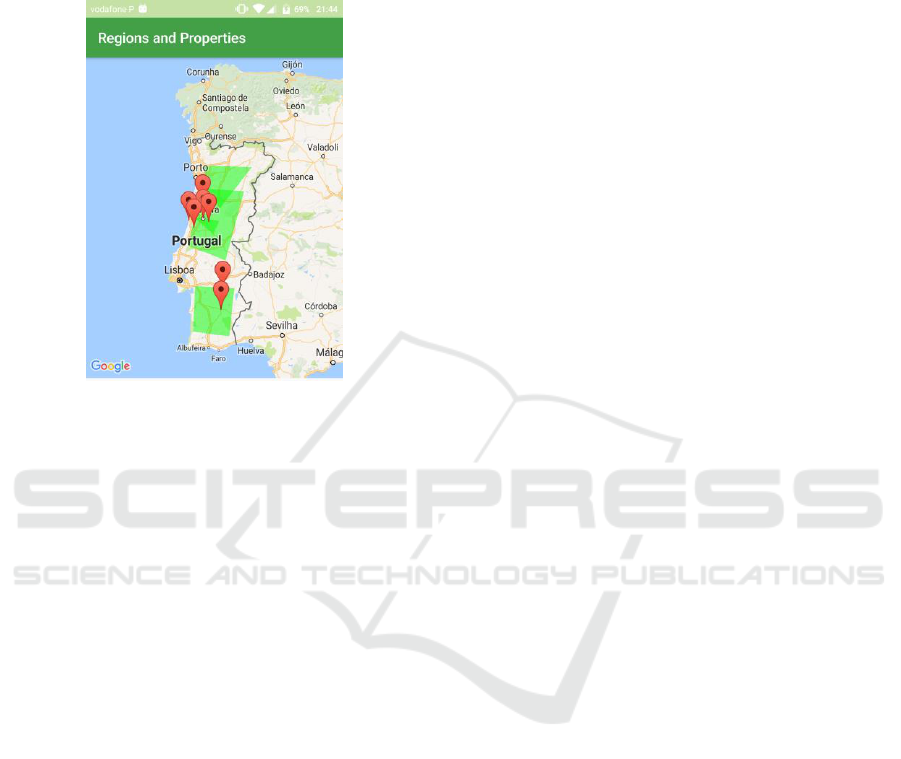
risk based on symptoms and weather data. In the
System, Weka allows us to display diseases risk
probability like it is shown in Figure 2. Figure 2
displays a chart showing the probability of two
diseases occurring in a property for the next 7 days.
The x axis represents the date and y axis represent
the probability value.
Figure 2: Disease Risk Prediction System.
In order to integrate the two applications (Web
and Mobile) we created a functionality that allows
association of symptoms with the stages of
cultivation.
For associating the Web application symptoms
with the Mobile application, we use an API that
communicate with Web application database and
returns a JSON object with the diseases, their
symptoms and the date those symptoms have been
inserted.
3.2 The Architecture
Figure 3 shows the architecture of our system and
how its components communicate between
themselves. Next, we will describe every component
and its main function.
Figure 3: System architecture.
Client applications are the applications that allow
the user to interact with the system and manage its
properties. These applications will communicate
with the server through the developed API, which is
based on HTTPS (Hyper Transfer Protocol Secure)
protocol. The data sent is in JSON (JavaScript
Object Notation) format and consists of properties
data.
Application Server is the first responsible for
supporting client applications, containing a RESTful
API to handle the requests of applications.
In order to save data, this architecture provides a
database. The Mysql database will be the database
that stores all data used by the applications described
above. This database will be updated periodically to
improve diseases prediction.
Finally, the external APIs are the APIs
responsible to provide meteorological data,
geolocation and data mining tasks.
4 GEOLOCATION
In this system, the use of geolocation allows location
of all land fields and farming tasks on Google Maps
API (Google Maps API, 2017). Information
collected from the use of geolocation can be
integrated to create field management strategies for
chemical application, cultivation and harvest.
ICSOFT 2018 - 13th International Conference on Software Technologies
682
4.1 Google Maps API
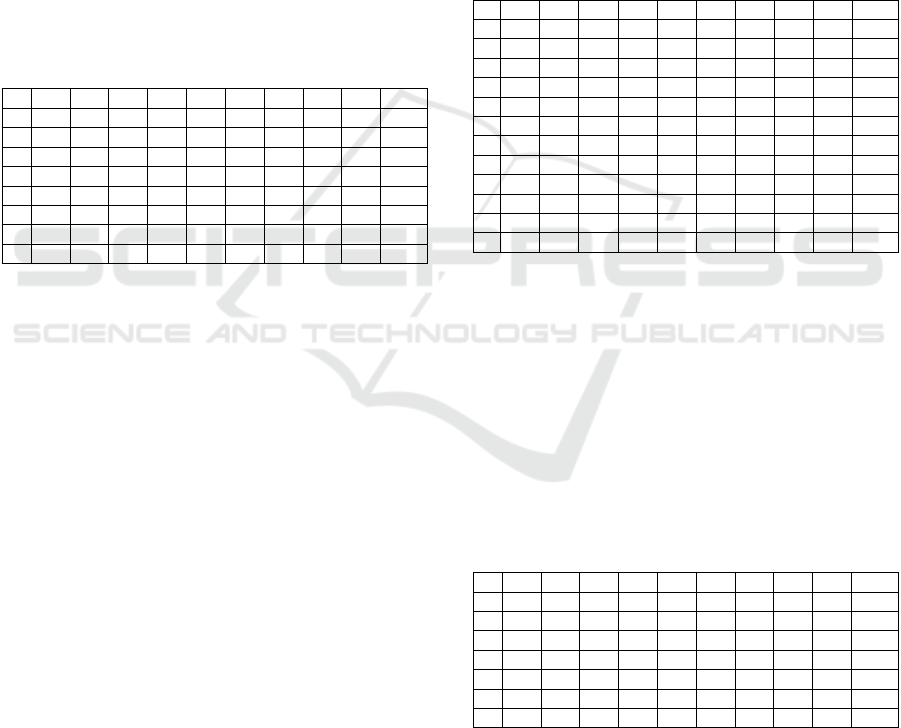
In the System, Google Maps API allows to register
properties and regions on the map like it is shown in
Figure 4.
Figure 4: System Region and Properties.
Properties are identified by a red marker and regions
are identified by a green area. A region can have
multiple associated properties and a property can be
associated with multiple regions. The properties will
have equipment that collects data from the
environment installed. Regions are important in the
proposed system to prevent property belonging to a
region in which a particular disease has occurred.
Having equipment associated with a region, enables
us to control all properties in that region.
5 WEATHER FORECASTING
Agricultural activities are very sensitive to climate
and weather conditions (Ghini, Hamada and Bettiol,
2008). Agricultural decision-maker can either be at
the mercy of these natural factors or try to benefit
from them. Climatological data is essential in
planning agricultural production.
For agriculture diseases, the minimum weather
data set required should consist of temperature and
humidity or derived parameters such as accumulated
heat or degree-days.
Real time meteorological information can also be
effectively used in agricultural production process.
Many times, the risk of diseases in cultures of
agriculture is related to favorable weather
conditions. So, weather data can increase
agricultural yield.
The quality and quantity of agricultural
production can be increased, and production costs
decreased. With weather data is also possible to
recognize bad weather conditions and be more
prepared to minimize the damage.
This System provides weather updates and in
case of diseases risk it alerts the farmers via e-mail,
text messages and mobile notifications. It provides
the weather conditions for the property location and
calculates probability of disease risk based on
collected data to assist the producer in undertaking
actions for healing and prevention at the correct
time, avoiding unnecessary spraying.
6 EXPERIMENTS
In the experimental evaluation, in order to test
system, we choose four diseases to predict
probability of risk. We choose Grapevine Downy
Mildew (Plasmopara Viticola), Powdery Mildew
(Uncinula necator), Peacock Spot (Cycloconium
oleaginum) and Olive Anthracnose (Gloeosporium
Olivarum) diseases to make the experimental
evaluation because we consider that they are the four
most important diseases that infect Vineyards and
Olive Groves worldwide based on farmers’ opinion.
In Weka, the datasets are given in ARFF
(Attribute Relation File format) format which is
compatible with this software. In order to perform
these experiments, we created four datasets. Each of
them has attributes that correspond to the most
important symptoms and weather data favorable to
the development of various diseases. DataSets -
Plasmopara Viticola, Uncinula necator,
Cycloconium oleaginum and Gloeosporium
Olivarum:
DataSet 1: This dataset is a generated dataset
with 4200 instances and correspond to
Plasmopara Viticola disease. This dataset
contains 1900 instances with probability of
disease and 2300 without it.
DataSet 2: This dataset is a generated dataset
with 141757 instances and correspond to
Uncinula necator disease. This dataset contains
35036 instances with probability of disease and
106721 without.
DataSet 3: This dataset is a generated dataset
with 1760 instances and correspond to
Cycloconium oleaginum disease. This dataset
System to Predict Diseases in Vineyards and Olive Groves using Data Mining and Geolocation
683

contains 185 instances with probability of
disease and 1575 without.
DataSet 4: This dataset is a generated dataset
with 2800 instances and correspond to
Gloeosporium Olivarum. This dataset contains
330 instances with probability of disease and
2470 without it.
Each of these datasets has attributes that correspond
to the most important causes and symptoms to
development of diseases.
DataSet 1 has the following attributes:
tmp: This matches the temperature. The
temperature is important for the development of
this disease when it has values higher than 11ºC.
hmdt: This matches the humidity. The humidity
is important for the development of this disease
when it has values higher than 92%.
rn: This matches the precipitation. The
precipitation is important for the development of
this disease because the fungus requires free
water in the tissues for a minimum of 2 hours for
infection.
TPS: This matches top page of the leaf with
spot. This attribute is one of the main symptoms
of this disease.
CP: This matches curving peduncle symptom.
WSS: This matches white spots on the lower
page of the sheet symptom.
SB: This matches stains on the branches
symptom.
diss: This matches the possibility of the disease
occurring based on the previous attributes.
The DataSet 2 has the following attributes:
tmp: This matches the temperature. The
temperature is important for the development of
this disease when it has values higher than 15ºC.
hmdt: This matches the humidity. The humidity
is important for the development of this disease
when it has values higher than 25%.
rn: This matches the precipitation. The
precipitation is important for the development of
this disease because the fungus requires free
water.
STS: This matches Stains on the Sheet symptom.
ESBL: This matches Edges of slightly beaded
leaves symptom.
NL: This matches Necrosis on leaves symptom.
BD: This matches Berry with dust symptom.
CRB: This matches Cracked berries symptom.
CTB: This matches Coated branches symptom.
SB: This matches Stained branches symptom.
ID: This matches Inflorescences with dust
symptom.
diss: This matches the possibility of the disease
occurring based on previous attributes.
The DataSet 3 has the following attributes:
tmp: This matches the temperature. The
temperature is important for the development of
this disease when it has values between 15ºC and
20ºC.
hmdt: This matches the humidity. The humidity
is important for the development of this disease
when it has values higher than 98%.
rn: This matches the precipitation. The
precipitation is responsible for the spread of the
disease.
SSP: This matches Stains on the superior page
sheet symptom.
SIP: This matches Stains on the inferior page
sheet symptom.
SF: This matches Stains on the fruits symptom.
diss: This matches the possibility of the disease
occurring based on the previous attributes.
The DataSet 4 has the following attributes:
tmp: This matches the temperature. The
temperature is important for the development of
this disease when it has values between 20ºC and
25ºC.
hmdt: This matches the humidity. The humidity
is important for the development of this disease
when it has values higher than 92%.
rn: This matches the precipitation. The
precipitation is responsible for the spread of the
disease.
RSF: This matches rounded spots on fruits. This
is one of the main symptoms of this disease.
WF: This matches wrinkled fruits symptom.
diss: This matches possibility of the disease
occurring based on the previous attributes.
We set random values for all attributes of
datasets and calculate probability of diseases
occurring.
6.1 Grapevine Downy Mildew
For the Grapevine Downy Mildew data set we set
some attributes like:
Temperature - C1 (ºC);
Humidity - C2 (%);
Precipitation Occurrence - C3 (Yes/No);
Yellowish leaves - S1 (Yes/No);
Curving peduncle - S2 (Yes/No);
White spots on the lower page - S3
(Yes/No);
Stains on the branches - S4 (Yes/No).
ICSOFT 2018 - 13th International Conference on Software Technologies
684
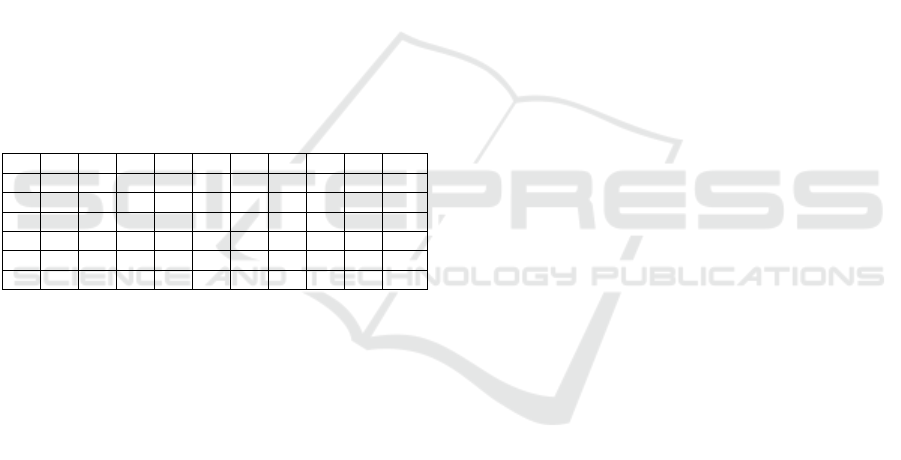
The results of application Random Forest
algorithm to calculate risk probability of Grapevine
Downy Mildew disease are shown in Table 1.
For example, in Test 10 the probability of
disease risk is 87% and values of attributes are:
Temperature (C1) - 11ºC;
Humidity (C2) - 63%;
Precipitation Occurrence (C3) - Yes;
Yellowish leaves (S1) - Yes;
Curving peduncle (S2) - No;
White spots on the lower page (S3) - No;
Stains on the branches (S4) – No.
When applying Random Forest algorithm to
Grapevine Downy Mildew dataset, the results were
satisfactory but could be improved if real property
data had been collected.
Table 1: Tests to Grapevine Downy Mildew disease.
T1
T2
T3
T4
T5
T6
T7
T8
T9
T10
C1
26
4
35
39
14
20
5
32
3
11
C2
78
36
67
41
71
88
50
41
97
63
C3
N
N
Y
Y
N
N
Y
N
N
Y
S1
N
Y
N
N
Y
N
Y
Y
N
Y
S2
Y
Y
Y
Y
Y
Y
N
N
Y
N
S3
N
N
Y
Y
N
N
N
N
N
N
S4
Y
N
N
N
N
N
Y
N
N
N
P
8
0
4
3
10
7
3
0
2
87
6.2 Powdery Mildew
For the Powdery Mildew data set we set some
attributes like:
Temperature - C1 (ºC);
Humidity - C2 (%);
Precipitation Occurrence - C3 (Yes/No);
Stains on the Sheet - S1 (Yes/No);
Edges of slightly beaded leaves - S2 (Yes/No);
Necrosis on leaves - S3 (Yes/No);
Berry with dust - S4 (Yes/No);
Cracked berries - S5 (Yes/No);
Coated branches - S6 (Yes/No);
Stained branches - S7 (Yes/No);
Inflorescences with dust - S8 (Yes/No);
When applying Random Forest algorithm to
Powdery Mildew dataset, we set random values for
the eleven attributes of this dataset in ten instances.
The results of application Random Forest
algorithm to calculate risk probability of Powdery
Mildew disease are shown in Table 2.
For example, in Test 5 the probability of disease
risk is 98% and values of attributes are:
Temperature (C1) - 29ºC;
Humidity (C2) - 67%;
Precipitation Occurrence (C3) - Yes;
Stains on the Sheet (S1) - Yes
Edges of slightly beaded leaves (S2) - Yes;
Necrosis on leaves (S3) - No;
Berry with dust (S4) - No;
Cracked berries (S5) - Yes;
Coated branches (S6) - No;
Stained branches (S7) - No;
Inflorescences with dust (S8) - No;
When applying Random _Forest algorithm to
Powdery Mildew dataset, the results are satisfactory
but could be improved if real property data had been
collected.
Table 2: Tests to Powdery Mildew disease.
T1
T2
T3
T4
T5
T6
T7
T8
T9
T10
C1
23
7
21
20
29
8
35
12
20
35
C2
41
74
97
27
67
59
91
29
26
74
C3
N
Y
Y
Y
Y
N
Y
N
N
N
S1
N
N
N
N
Y
N
Y
N
Y
N
S2
Y
Y
Y
N
Y
Y
N
N
N
N
S3
N
N
Y
Y
N
Y
N
N
N
N
S4
Y
Y
Y
N
N
Y
Y
N
Y
N
S5
N
Y
N
Y
Y
N
N
Y
N
Y
S6
N
N
N
Y
N
N
N
N
Y
Y
S7
N
Y
N
Y
N
Y
Y
N
N
N
S8
N
Y
N
N
N
Y
N
N
Y
N
P
99
98
97
5
98
1
3
0
2
0
6.3 Peacock Spot
For the Peacock Spot data set we set some attributes
like:
Temperature - C1 (ºC);
Humidity - C2 (%);
Precipitation Occurrence - C3 (Yes/No);
Stains on the superior page sheet - S1 (Yes/No);
Stains on the inferior page sheet - S2 (Yes/No);
Stains on the fruits - S3 (Yes/No);
Table 3: Tests to Peacock Spot disease.
T1
T2
T3
T4
T5
T6
T7
T8
T9
T10
C1
16
25
28
26
11
17
15
25
27
16
C2
83
90
76
76
91
74
97
89
88
85
C3
Y
Y
N
N
N
Y
Y
N
Y
Y
S1
N
Y
Y
Y
Y
N
Y
Y
Y
Y
S2
Y
N
Y
Y
N
N
N
N
Y
Y
S3
Y
Y
N
Y
Y
Y
Y
Y
Y
N
P
82
17
22
30
25
85
97
20
70
64
When applying Random Forest algorithm to
Peacock Spot dataset, we set random values for the
six attributes of this dataset in ten instances.
The results of application Random Forest
algorithm to calculate risk probability of Peacock
Spot disease are shown in Table 3. For example, in
System to Predict Diseases in Vineyards and Olive Groves using Data Mining and Geolocation
685
Test 9 the probability of disease risk is 70% and
values of attributes are:
Temperature (C1) - 27ºC;
Humidity (C2) - 88%;
Precipitation Occurrence (C3) - Yes;
Stains on the superior page sheet (S1) - Yes;
Stains on the inferior page sheet (S2) - Yes;
Stains on the fruits (S3) - Yes;
When applying Random Forest algorithm to
Peacock Spot dataset, the results were satisfactory
but could be improved if real property data had been
collected.
6.4 Olive Anthracnose
For the Olive Anthracnose data set we set some
attributes like:
Temperature - C1 (ºC);
Humidity - C2 (%);
Precipitation Occurrence - C3 (Yes/No);
Rounded spots on fruits - S1 (Yes/No);
Wrinkled fruits - S2 (Yes/No);
Table 4: Tests to Olive Anthracnose disease.
T1
T2
T3
T4
T5
T6
T7
T8
T9
T10
C1
16
24
29
18
27
15
30
25
26
23
C2
96
98
98
95
92
97
98
92
99
92
C3
Y
N
N
N
Y
N
Y
N
N
N
S1
Y
N
Y
N
Y
Y
Y
N
Y
Y
S2
Y
N
Y
N
N
N
N
N
N
Y
P
30
89
10
15
97
15
5
30
20
97
When applying Random Forest algorithm to
Olive Anthracnose dataset, we set random values for
the five attributes of this dataset in ten instances.
The results of application Random Forest
algorithm to calculate risk probability of Olive
Anthracnose disease are shown in Table 4.
For example, in Test 2 the probability of
disease risk is 80% and values of attributes are:
Temperature (C1) - 24ºC;
Humidity (C2) - 98%;
Precipitation Occurrence (C3) - No;
Rounded spots on fruits (S1) - No;
Wrinkled fruits (S2) - No;
When applying Random Forest algorithm to
Olive Anthracnose, the results were satisfactory but
could be improved if real property data had been
collected.
7 DISCUSSIONS OF RESULTS
We use Grapevine Downy Mildew (Plasmopara
Viticola), Downy Mildew (Uncinula Necator),
Peacock Spot (Cycloconium Oleaginum) and Olive
Anthracnose (Gloeosporium Olivarum) Data Sets.
Grapevine Downy Mildew dataset has 4200
samples with 7 independent variables and one class
variable. Powdery Mildew dataset has 141757
samples with 11 independent variables and one class
variable. Peacock Spot dataset has 1760 samples
with 6 independent variables and one class variable.
Olive Anthracnose dataset has 2800 samples with 5
independent variables and one class variable.
The data mining tool Weka is used for
experiment because it is an open source system that
provides a collection of visualization tools and
algorithms for data analysis and predictive
modelling.
The results are better than expected. However,
we need to collect real time data from Vineyards and
Olive Groves to make these results more reliable.
8 CONCLUSIONS AND FUTURE
WORK
Predictive data mining is becoming an essential
instrument in agriculture. Understanding the main
issues underlying these methods and the application
of agreed and standardized procedures are
mandatory for their deployment and the
dissemination of results. Agriculture organizations
that use data mining applications have the possibility
to predict future risk of diseases and make adequate
decisions about their treatments.
Nowadays, the use of smart phone technology
with specialized software shall boost the
management of farms to a high level. This proposed
System helps in all manners, that is, in weather
forecasting, crop analysis and understanding it more
clearly. The use of this System can overleap the high
difficulties of a farm. Using data mining and
geolocation in the agriculture sector can show us an
overview of current practices and challenges in this
sector. We believe that this System is a useful tool
for farm management.
As a future work, we can improve the system
architecture by introducing many more diseases for
risk predicting and more platforms can also use this
application. Real data from farms need to be
collected to improve prediction of disease risk.
ICSOFT 2018 - 13th International Conference on Software Technologies
686

REFERENCES
Google, 2017, Google Maps API, available from:
https://developers.google.com/maps/
Allahyari, M. S. and Chizari, M. (2010) ‘Potentials of
New Information and Communication Technologies
(ICTs) in Agriculture Sector Potentials of New
Information and Communication Technologies ( ICT
S ) in Agriculture Sector’, Journal of Agricultural
Science and Technology, 4(4), pp. 115–120.
Bhave, A., Joshi, R. and Fernandes, R. (2014) ‘MahaFarm
– An Android Based Solution for Remunerative
Agriculture’, 2(4).
Chirmade, M. et al. (2015) ‘Agriculture Supply Chain
Management Based Android Application’, 4(4), pp.
86–90.
Choudhary, M. et al. (2015) ‘Scheduling , Controlling
And Monitoring of Agricultural Devices Using
Android Application’, 4(4), pp. 1512–1515.
Ghini, R., Hamada, E. and Bettiol, W. (2008) ‘Climate
change and plant diseases’, Scientia Agricola,
65(December), pp. 98–107.
Goswami, S., Matin, S. and Aruma, S. (2012) ‘A Review:
The application of Remote Sensing, GIS and GPS in
Precision Agriculture’, Ijater, 2(1), pp. 50–54.
Kapoor, R. (2014) ‘Application of information and
communication technology for dissemination of
agricultural information among farmers: challenges
and opportunities.’, International Journal of
Agricultural Science, Research …, 4(2), pp. 83–91.
Koli, R. P. and Jadhav, V. D. (2013) ‘Agriculture Decision
Support System As Android Application’,
International Journal of Science and Research (IJSR)
ISSN (Online Index Copernicus Value Impact Factor,
14(4), pp. 2319–7064.
Lantzos, T., Koykoyris, G. and Salampasis, M. (2013)
‘FarmManager: An Android Application for the
Management of Small Farms’, Procedia Technology.
Elsevier B.V., 8(Haicta), pp. 587–592.
MiloviC;RadojeviC (2015) ‘Application of Data Mining in
Agriculture’, Bulgarian Journal of Agricultural
Science, 21(1), pp. 1082–1085.
Mitra, T. (2014) Importance of Information Technology in
Agricultural Reforms. Available at:
https://www.linkedin.com/pulse/20140627095530-
308433376-importance-of-information-technology-in-
agricultural-reforms (Accessed: 1 January 2017).
Patel, H. and Patel, D. (2016) ‘Survey of android apps for
agriclture sector’, International Journal of Information
Sciences and Techniques, 6(1), pp. 61–67.
Patel, V. B., Thakkar, R. G. and Desai, H. V (2014) ‘An
Android Application for Farmers for Kharif and Rabi
Crop Diseases Information’, 4(10), pp. 788–791.
Patel, V. B., Thakkar, R. G. and Radadiya, B. L. (2014)
‘An android application for farmers to disseminate
horticulture information’, International Journal of
Computer Applications, 88(4), pp. 1–4.
Prasad, S., Peddoju, S. K. and Ghosh, D. (2013)
‘AgroMobile: A Cloud-Based Framework for
Agriculturists on Mobile Platform’, International
Journal of Advanced Science and Technology, 59, pp.
41–52..
Radhika, D. (2015) ‘One Stop Solution for Farmer
Consumer Interaction’, (Ncac), pp. 16–19.
Reddy, S. et al. (2015) ‘A Survey on Crop Disease
Detection and Prevention using Android Application’,
2(4), pp. 621–626.
Shabadi, L. et al. (2014) ‘International Journal of
Advanced Research in Computer Science and
Software Engineering Irrigation Control System Using
Android and GSM for Efficient Use of Water and
Power’, 4(7), pp. 607–611.
Singhal, M., Verma, K. and Shukla, A. (2011) ‘Krishi
Ville - Android based solution for Indian agriculture’,
in International Symposium on Advanced Networks
and Telecommunication Systems, ANTS.
Agrobase, Google Play, available from:
https://play.google.com.
OpenPD, available from: http://www.openpd.eu/.
System to Predict Diseases in Vineyards and Olive Groves using Data Mining and Geolocation
687
