
Estimation of Intellectual Concentration States using Pupil Diameter and
Heart Rate Variability
Kaku Kimura, Shutaro Kunimasa, You Kusakabe, Hirotake Ishii and Hiroshi Shimoda
Graduate School of Energy Science, Kyoto University, Kyoto, Japan
Keywords:
Intellectual Concentration States, Classification Learning, Physiological Indices, Pupil Diameter, Heart Rate
Variability.
Abstract:
Although modern society has improved the value of intellectual work, its objective and quantitative evaluation
method has not been established. In this study, the authors have focused on physiological indices such as pupil
diameter and heart rate variability which are supposed to be influenced by their cognitive load in office work,
and an estimation method of intellectual concentration states from the measured indices has been proposed.
The concentration states to be estimated in this study are one of three states when giving three kinds of cogni-
tive loads which are high, medium and low. As the result of the experiment where intellectual concentration
states of 31 participants were estimated, the accuracy was 57.3% in average and it was significantly higher than
random estimation (p < 0.001). It was also found that those who had no clear physiological response caused
by the difference of cognitive load or those who showed different physiological response when measuring in
different time tended to be low estimation accuracy.
1 INTRODUCTION
In modern information society, most human activity
in office and laboratory is intellectual work. It is ex-
pected that the efficiency of work performance, that
is, intellectual productilvity get improved by revie-
wing office environmentand companies can get a lot
of economic benefit. In this way, intellectual work is
an important factor in modern society. In order to eva-
luate it, various studies have been conducted. For ex-
ample, an evaluation method based on visual task has
been proposed (Kosuke et al., 2000)(Wargocki et al.,
2000). It is, however, difficult to evaluate intellectual
work productivity directly due to the difference bet-
ween the visual task and real office work. On the ot-
her hand, there are another evaluation method using
physiological indices by biological response of hu-
man beings. In the case of this method, it is possi-
ble to measure on time while office worker is actually
engaged. Since the work efficiency of simple intel-
lectual work sharing the majority of office work is
closely related to the intellectual concentration state
when cognitive load is applied, it is possible to in-
directly evaluate intellectual productivity by estima-
ting the intellectual concentration state when giving
a cognitive load. It is known that physiological in-
dices are closely related to cognitive load of human
beings (Tryon, 1975)(Jorna, 1992) so that they can
be effective indices. Considering these backgrounds
in this study machine learning methods are applied
where training data is created by conducting classi-
fication learning about each individual physiological
measurement data while the intellectual concentration
states of office workers are changed. The purpose of
this study is to propse a method which can estimate
intellectual concentration state of office workers. As
shown in Figure 1, heart rate variability and pupil di-
ameter were employed as the physiological indices
for intellectual concentration estimation. Classifica-
tion learning method was employed in order to derive
trained model for the estimation, and estimated the
test data based on the trained model. If this method
Training Data
Estimate
Test Data
①Training Phase
Concentration
State ??
Physiological
Indices
Concentration
State
Physiological
Indices
Pupil
Diameter
Heart Rate
Variability
②Test Phase
Cognitive
Task
Figure 1: Outline of this study.
62
Kimura, K., Kunimasa, S., Kusakabe, Y., Ishii, H. and Shimoda, H.
Estimation of Intellectual Concentration States using Pupil Diameter and Heart Rate Variability.
DOI: 10.5220/0006928800620069
In Proceedings of the 2nd International Conference on Computer-Human Interaction Research and Applications (CHIRA 2018), pages 62-69
ISBN: 978-989-758-328-5
Copyright © 2018 by SCITEPRESS – Science and Technology Publications, Lda. All rights reserved

is shown to be useful, it is possible to estimate intel-
ligent concentration states of real office workers. It is
also expected to be applied to the evaluation of intel-
lectual productivity.
2 ESTIMATION METHOD
2.1 Cognitive Activity and Physiological
Indices
It is known that there is a close relationship between
physiological reponse and coginitive activity (Tryon,
1975)(Jorna, 1992), and especially pupil diameter and
heart rate variability are easy to change as cognitive
activity changes (Eckhard H. Hess, 1964)(Tsukahara
et al., 2016)(Mulder and Mulder, 1981). In addition,
it is expected that non-contact measurement techno-
logy is established on the every indices in the future
(Sakamoto et al., 2015), and that the influence of we-
aring measurement instruments on physiological in-
dices can be ignored. Therefore, pupil diameter and
heart rate variability were employed in this study.
2.1.1 Pupil Diameteer
In the field of psychophysiology, it is known that pupil
diameter changes by various cognitive activity condi-
tion (Eckhard H. Hess, 1964)(Tsukahara et al., 2016),
so that it is considered that pupil diameter is effective
as a measurement index also in this study. The vari-
ables used for the estimation were left eye and right
eye pupil diameter.
2.1.2 Heart Rate Variability
In the field of psychophysiology, heart rate variability
is used as indices which reflect cognitive load, stress,
and emotion (Mulder and Mulder, 1981). It is consi-
dered that changes in intellectual concentration states
have an effect on changes of variability, and it can be
also an effective measurement index. The variables
used for estimation were 4 elements. They are heart
rate(HR), LF power, HF power, the ration of LF to
HF(LF/HF), which are often used in various studies
on cognitive load theory. In this study, an electro-
cardiogram (ECG) measurement method is adopted,
which is the most reliable method for heart rate mea-
surement. Electrode was attached to each of the left
flank and the right neck muscle, and the waveform of
the electrocardiogram was observed. Heart rate was
calculated by measuring the RR interval from the R
wave of the ECG and determining the inverse num-
ber. Regarding feature value extraction, one section
has 60 second long, in which the power spectrum of
the LF band falls for at least 3 cycles. Then, while
shifting this section every 30 seconds, the average va-
lue calculated from each section was taken as the fe-
ature value of the section. Regarding the pupil dia-
meter data, in order to make the time series of data
unified with the heart rate variation, the feature value
section to be extracted was set to be the same as the
heart rate variability.
2.2 Estimation Method of Intellectual
Concentration States
In this study, the cognitive load was changed by dis-
tinguishing solution method of cognitive tasks. Then,
multiple physiological indices data from cognitive
task was learned in order to estimate the intellectual
concentration state according to the cognitive load.
Although Classification learning is usually based on
two binary classification, classification of three or
more classes is possible by applying multiclass classi-
fication method called ECOC method (Dietterich and
Bakiri, 1995). This method is employed in this study
to estimate the intellectual concentration state classi-
fied into three types. Various classification learning
methods such as SVM and KNN were applied to phy-
siological data. A list of all the 11 classification met-
hods applied in this study is shown in Table 1. Es-
timation of test data is performed based on trained
models classified by these methods. MATLAB (Inc
MathWorks, ) was used for analysis and estimation of
measurement data. The evaluation method of estima-
tion accuracy is explained in section 4.1
Table 1: List of classification methods.
Classification Method Remarks
1 Decision Tree
2 Linear Classifier
3 Quadratic Classifier
4 Linear SVM
5 Quadratic SVM
6 Cubic SVM
7 Fine Gaussian SVM = 0.6
8 Middle Gaussian SVM = 2.4
9 Row Gaussian SVM = 9.8
10 Fine KNN k = 1
11 Row KNN k = 10
Estimation of Intellectual Concentration States using Pupil Diameter and Heart Rate Variability
63
3 EXPERIMENT
3.1 Purpose
The purpose of this experiment was to extract phy-
siological indices data by measuring pupil diameter
and heart rate during intellectual work and to evaluate
estimation accuracy by performing various classifica-
tion learning method shown in Section 2.2 .
3.2 Method
3.2.1 Cognitive Task
In this study, Receipt-Classification Task was applied
as the task used for estimation of intellectual concen-
trate states. It is a cognitive task in which three items
of information on the date, amount of money and bu-
siness type of the displayed receipt was classified and
they continues to answer the corresponding option
until the time limit. All operations are performed by
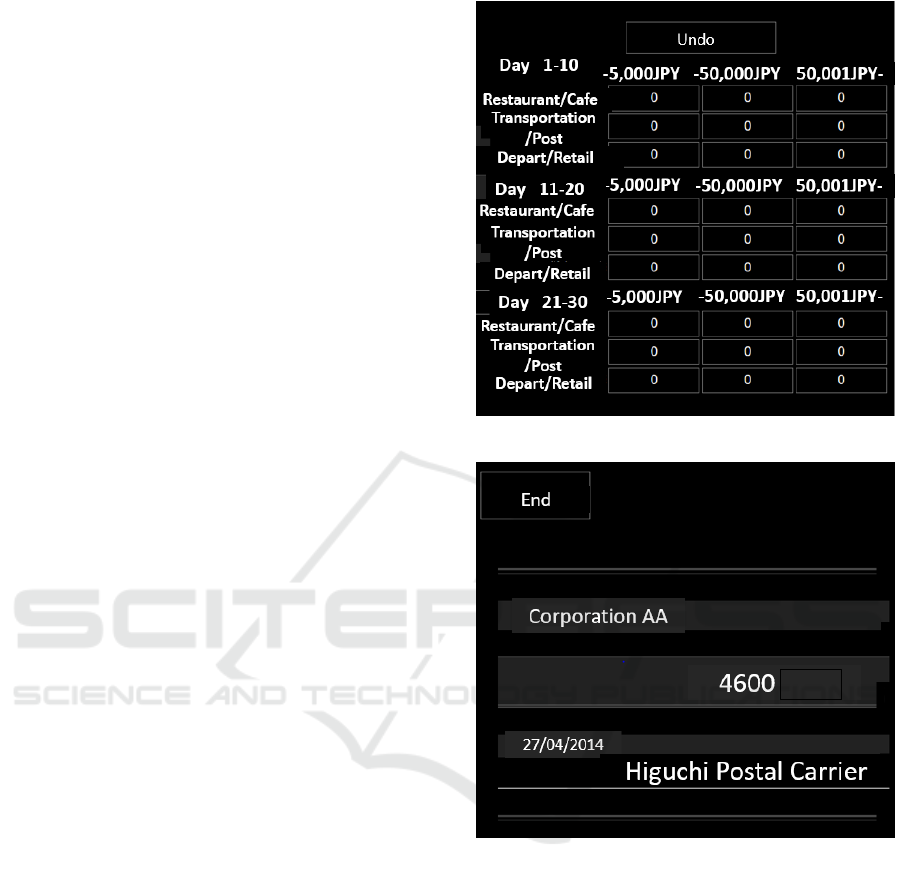
moving a mouse and left clicking. The examples of
the task displays are shown in Figure 2 and Figure3.
In case of Figure 3, the date is “27th”, the amount
is “4,600 JPY”, and the company is “Higuchi Pos-
tal Carrier”, the part corresponding to “Day 21-30”,
“-5000 yen”, and ”Transportation/Post” is the correct
answer. The reasons for employing the Receipt- Clas-
sification task are as follows; First, the task difficulty
level is almost uniform. In this study, the change
of the solution method such as the solution speed of
tasks is considered as the change of intellectual con-
centration state and estimate the concentration state,
so it is necessary to unify conditions such as difficulty
level of task. Second, the task reflects the proces-
sing capability required for simple intellectual work
in the actual office. The ability necessary for sim-
ple intellectual work is supposed to be the numercical
processing ability such as data entry or graph crea-
tion, and the linguistic processing ability such as do-
cument preparation. Even in this study assuming ap-
plication to actual work, these two capabilities are re-
quired when solving the tasks. For the above reasons
Receipt-Classification task was used in this study.
3.2.2 Control of Performing Task
There is a close relationship between cognitive load
and intellectual concentration state, and the more con-
centrated the worker is, the more taken cognitive load.
In this study in order to estimate the intellectual con-
centration state when giving a cognitive load, it is ne-
cessary to change the intellectual concentration state
in a state where various amounts of cognitive load are
Figure 2: Display for Reccipt-Classifiation Task.
JPY
Figure 3: An example of a receipt.
given. In this experiment, therefore, the answer met-
hod of task was set to change by intentionally con-
trolling cognitive load . A list of relationship bet-
ween task type and intellectual concentration states
is shown in Table 4. First, two kinds of answer pace
of tasks, slow pace and fast pace were set, which are
“Task A: slow pace” and “ task B: fast pace”. The
answer pace of each participant was decided by them-
selves. In addition, “Task C: Click” was introduced as
a control condition of Task A and Task B, which is a
task that gives no cognitive load, Click is a task of re-
peating mouse clicks on appropriate places without
the Receipt-classification. Even in this task, since
physical actions such as looking at the screen and ope-
rating the mouse is similar to the task A and B, it is
considered that the factors affecting the physiologi-
CHIRA 2018 - 2nd International Conference on Computer-Human Interaction Research and Applications
64

cal response other than the difference in the cognitive
load are equivalent to those of the task A and B. For
the above three kinds of answer methods, task A was
set as the cognitive load “medium”, task B as the cog-
nitive load “high”, and task C as the cognitive load
“low”. The total time was set to 5 minutes because it
is considered that feature values for estimation should
be sufficiently extracted, and the same concentration
state can be maintained during task. The task perfor-
mance and correct answer rate are not the target of the
estimation in the experiment .
3.2.3 Experimental Environment
The experiment was conducted an experimental room
of Kyoto University. The room temperature during
the experiment was controlled to 251.0, thesound
noise was controlled to less than 50 dB, and the il-
luminance on the desk was set to approximately 550
lux.
3.2.4 Measurement of Physiological Indices
Pupil diameter and ECG were employed in this ex-
periment. The pupil diameter was measured by an
infrared eye tracking camera, faceLAB5 (Seeing Ma-
chines, ). The installation position of faceLAB5 ca-
mera and the camera angle are shown in Figure.4. The
height and position of the chair was adjusted for each
participant so that the head of the participant can be
recognized correctly. since it is necessary to perform
face recognition as precisely as possible, a jaw ta-
ble was installed for suppressing the movement of the
head. The ECG was measured by Polymate AP216.
The electrodes were placed on a left rib and a right
clavicle where R wave is easy detected without body
motion artifact. As a noise signal removal, the cutoff
frequency of the low-pass filter was set to 100 Hz, and
a notch filter of 60 Hz was set as a hum noise elimi-
nation from the commercial power supply.
1030
400~500
700
420
700
1000
70
30°
Unit: mm
Display
Eye Tracking
Camera
Jaw Table
Figure 4: Position of a participant and experimental devices.
Table 2: Experimental schedule.
Duration(min) Content
10 Introduction and Explanation
10 Setting of Electrodes and Eye
Tracking Camera
10 Task Practice
18 Set1
5 Break Time
18 Set2
10 Removal of the Instruments
/Quastionnaire
Table 3: Protocol for each set.
Duration(min) Protcol
1 Rest
5 *Task1
1 Rest
5 *Task2
1 Rest
5 *Task3
*The order of task answer methods was random for each
participant
3.2.5 Experimental Protocol
The experiment was conducted in December 11th to
27th, 2017. The experimental schedule and the task
protocol of each set are shown in Table 2 and 3 re-
spectively. Each participant conducted two sets of
the task. As shown in Table 3, Each set contained
rest time for 1 minute, task time for 5 minutes and
they were repeated 3 times. For each set, Receipt-
Classification task was conducted for 5 minutes with
three kinds of answer methods shown in Table 4. The
order of task answer methods was random for each
participant in order to cancel order effect of the tasks.
In the rest time, white ‘+’ mark was displayed at the
center of the screen for 1 minute. A simple questi-
onnaire was given to the participants after the experi-
ment. It was used as a reference for the detail inter-
pretation of experimental results.
3.2.6 Participant
Participants were 31 male university students. They
were (1) those whose mother tongue is Japanese, (2)
not wearing glasses. Regarding the condition of (2), it
was observed that the accuracy of pupil diameter me-
asurement of participants wearing glasses sometimes
deteriorated in the preliminary experiments. There-
fore, in order to keep the measurement accuracy, this
condition was set for the purpose of removing partici-
pants who wore glasses in advance.
Estimation of Intellectual Concentration States using Pupil Diameter and Heart Rate Variability
65

Table 4: Relationship between task type and intellectual concentration states.
Task Type Details Cognitive Load Concentration States
Task A (Slow Pace)
Solve the Receipt-Classification Task
Middle Somewhat Concentrated
as Slow as Possible
Task B (High Pace)
Solve the Reccipt-Classification Task
High Very Concentrated
as Fast as Possible
Task C (Click)
Conduct the Click Task (Do Not
Low Not Concentrated at All
Solve the Receipt-Classification Task )
4 RESULT
In this experiment, six out of the 31 participants were
excluded from the later analysis as invalid data.The
reasons why there were invalid data was because their
heart beat data was lost due to the failure or irregu-
lar power off of the ECG measuring device, or pupil
diameter data was lost due to their dozing during mea-
surement. Finally 25 participants excluding the above
six were analyzed. 10 out of 25 participants were in-
terrupted half way because an error occurred in which
the response of the task was interrupted at the transi-
tion of the task screen, and their measurements re-
started from just before the error occurred. However,
since there was no data loss of these participants, their
measured data were included in the later analysis.
4.1 Evaluation Method of Estimation
Accuracy
60 second pupil diameter data and heart rate data ex-
tracted as a frame and the frames were shifted every
30 seconds, and the average value of each frame ex-
cluding the beginning 30 seconds was taken as the ex-
tracted feature value. In this experiment, the total time
of each task was set to 5 minutes, so the number of
feature values per variable was 24. The explanatory
variables are the left pupil diameter, the right pupil
diameter, heart rate, LF, HF, LF / HF in total, and the
objective variable is the type of tasks described in Ta-
ble 2. The ratio of the number of the objective varia-
bles that can be correctly estimated, that is, the correct
estimation rate, is evaluated as estimation accuracy in
this method.
Next, an evaluation method of estimation accu-
racy will be described. First, for all 24 training data,
all classification learning methods shown in Table 2
were applied. Then, the highest generalization per-
formance for each participant was defined as a trai-
ned model of the participant. Finally, an unknown
test data of the participant was estimated based on the
model and the estimation accuracy was calculated. In
this experiment total 2 sets of similar protocols were
carried out. Thus, estimation accuracy in this study
was defined as average value of accuracy when set-
ting set 1 as training data, set 2 as test data and accu-
racy when setting set 1 as test data, set 2 as training
data. The cross validation method was used to evalu-
ate the generalization performance of the trained mo-
del. Generalization performance of trained models of
all valid data was 91.1% in average. The most applied
classification method was linear classifier, and at the
next point was SVM.
4.2 Estimation Accuracy of Intellectual
Concentration States and
Disccusion on Estimated Error
By using the estimation method discribed in 4.1
section, the estimation accuracy of all valid test data
wa 57.3% in average. It was significantly higher than
the random expected value (p < 0.001). However, the
percentage of correct answer was depending on the
individual participants. In the following, giving re-
presentative examples of participants who were high
in correct answer rate and those who were low, and
discuss the differences in estimation results.
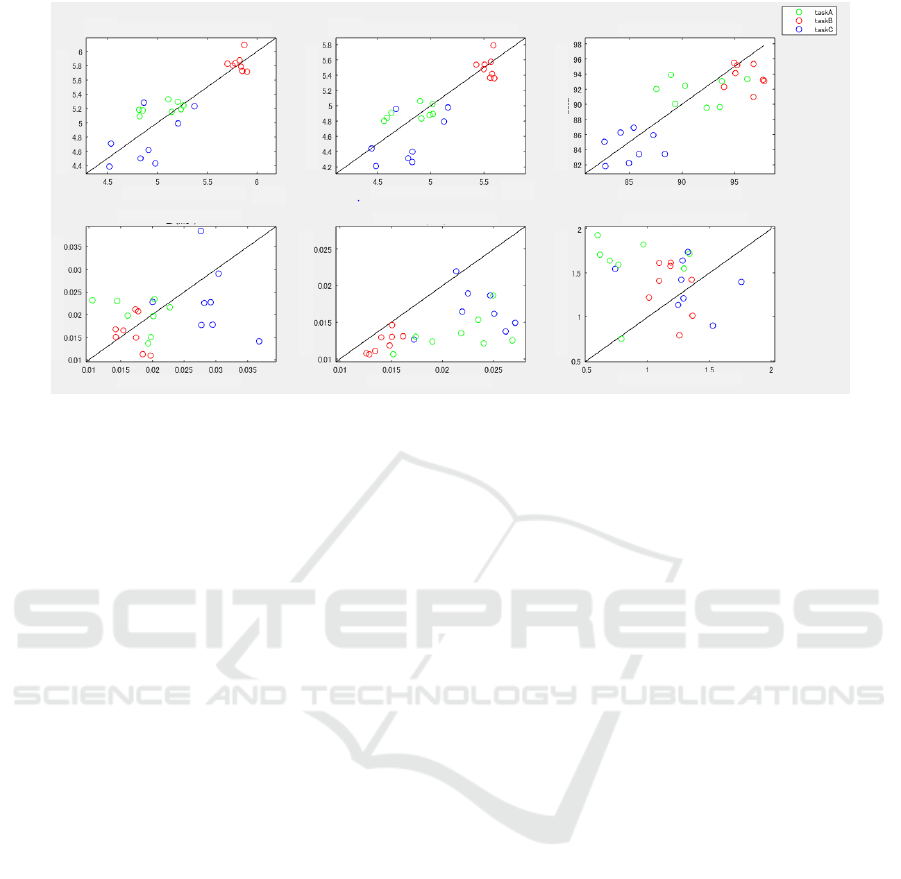
First, considering the participant who was estima-
ted with the highest accuracy with a correct answer
rate of 88%. Figure 5 shows a scatter diagram for each
physiological index where the horizontal axis shows
those of set1 while the vertical axis shows those of
set2 for each of the 8 feature values in each of the
three intellectual concentration states. If the same fe-
ature value appeared between set1 and set2, a feature
point is displayed on the straight line y = x. In the case
of this participant, obvious differences of pupil dia-
meters and heart rate were shown between three con-
centration states, where they increased when the cog-
nitive load of the task increased. Regarding LF and
HF, although there was no such obvious differences
between concentration states, there was a tendency to
show the smallest value in task B: very concentrated
status. From the above results, in case of this parti-
cipant it seems that the difference in intellectual con-
centration state due to the task difference appeared in
CHIRA 2018 - 2nd International Conference on Computer-Human Interaction Research and Applications
66
Left Pupil Diameter (mm) Right Pupil Diameter (mm) Heart Rate (/min)
LF (ms²)
HF (ms²) LF/HF
set1
set1
set1
set1
set1
set1
set2
set2
set2
set2
set2
set2
Figure 5: Scatter plots between two set about physiological indices in ex1.
the different physiological responses, and estimation
accuracy got higher because of similar responses bet-
ween set 1 and set 2.
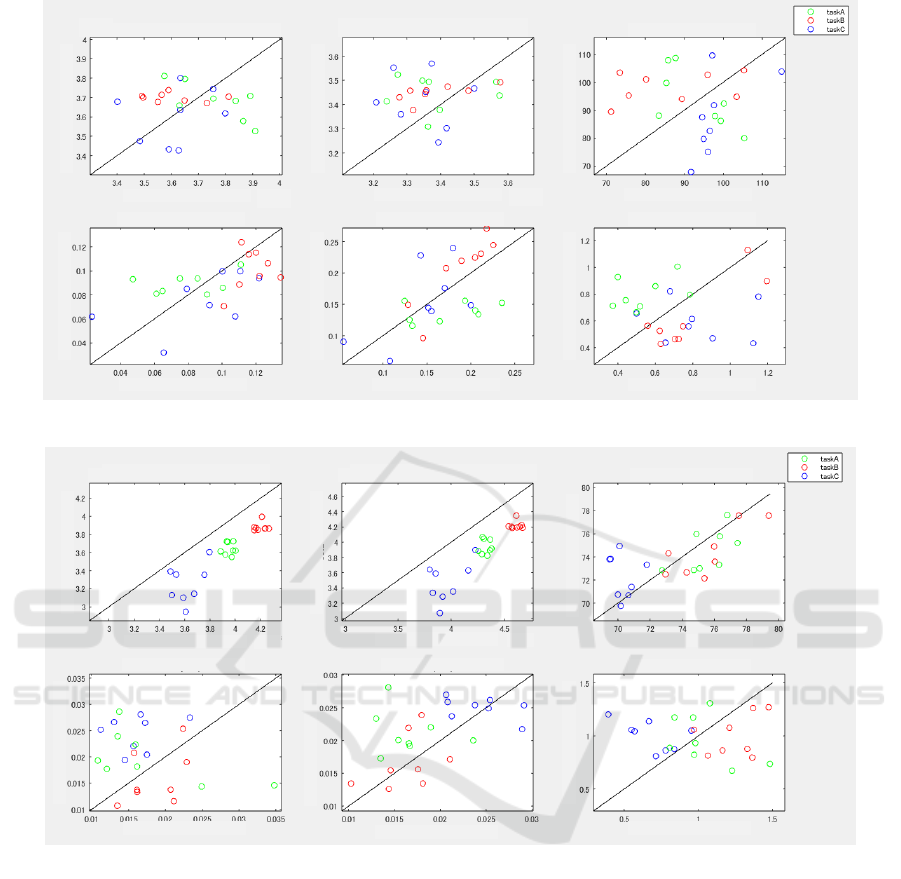
Next, considering the participant whose estima-
tion accuracy was the lowest with a correct answer
rate of 23%. A scatter diagram of each feature value
for each index is shown in Figure 6. In the case of this
participant, no particular trend due to difference in
cognitive load was found in any indicies. In this par-
ticipant, the generalization performance of the trained
model is as low as 77%. Therefore, it is supposed that
it is difficult to create a trained model by classification
learning and the estimation of test data could not be
done correctly because the difference of the intellec-
tual concentration by the difference of tasks tends not
to appear as a physiological response.
Finally, considering another example of partici-
pant who had a low correct estimation rate. A scatter
diagram of the feature values of each index is shown
in Figure 7. Despite the fact that the generalization
performance of the trained model was as very high
as 98%, the correct estimation rate of the test data
was as low as 42%. As shown in Figure 7, there is
a difference in the left and right pupil diameter, which
is considered to contribute to the trained model con-
struction. However, each feature value is distributed
to the lower right of the straight line y = x. That is, the
pupil diameter decreased at set 2 compared with set 1
in any time frame. Taking average of the pupil dia-
meters of every set of all participants, in task B with
very concentrated state, their pupil diameters decrea-
sed significantly in set 2 compared with those in set 1.
It is supposed that they contracted due to the decrease
of cognitive load by learning effect. When set 1 is set
as training data and set 2 is as test data, task B is in-
correctly estimated as task A and task A is as task C.
Thus, it is suppossed that even when different physi-
ological responses appear when measured at different
times, a deviation may be seen in the physiological in-
dex data and an incorrect concentration state may be
estimated.
5 CONCLUSIONS
In this study, as a basic study for developing quanti-
tative evaluation method of intellectual concentration,
a method was propsed and examined to estimate the
intellectual concentration state of the worker by mea-
surement of physiological indices, and an experiment
was conducted to evaluate the estimation accuracy of
the method. As the result of the experiment, the es-
timation accuracy was 57.3% in average, which was
significantly higher than the random expected value
(p < 0.001). Some of the participants showed extre-
mely high value of estimation accuracy, while those
who did not clearly show differences in cognitive lo-
ading in physiological responses, or those with diffe-
rent physiological responses showed low estimation
accuracy. Particularly with regard to the pupil diame-
ter, a large change was observed due to the difference
in cognitive load, and it is supposed that the measu-
rement value was varied during the measurement at
different time due to the contraction of the pupil by
learning effect.
In the future, it is necessary to devise various
ideas such as explore additional physiological respon-
ses that can contribute to the estimation by increasing
the measurement indices, or examining the method of
correcting the deviation of the values when measured
Estimation of Intellectual Concentration States using Pupil Diameter and Heart Rate Variability
67
Left Pupil Diameter (mm)
Right Pupil Diameter (mm)
HR (/min)
LF (ms²)
HF (ms²) LF/HF
set1
set1
set1
set1 set1 set1
set2
set2
set2
set2
set2
set2
Figure 6: Scatter plots between two set about physiological indices in ex2.
Left Pupil Diameter (mm)
Right Pupil Diameter (mm)
HR (/min)
LF (ms²) HF (ms²)
LF/HF
set2
set1
set1
set1
set1
set1
set2
set2
set2
set2
set2
set1
Figure 7: Scatter plots between two set about physiological indices in ex3.
at different times. In this study, since experiment was
conducted with participants only for men university
students, it is also necessary to verify the influence on
the estimation accuracy due to the difference in the at-
tributes of the participants. Furthermore, in this study,
the intellectual concentration states are estimated by
the cognitive load amount set for each answer method
of the Receipt-Classification Task, and the intellectual
concentration states in actual work cannot be directly
estimated by physiological responses. In the future,
it is necessary to confirm the effectiveness of the pre-
sent estimation method in tasks other than Receipt-
Classification Task and to study the relationship bet-
ween cognitive activity and physiological responses.
ACKNOWLEDGEMENTS
This work was supported by JSPS KAKENHI Grant
Numbers JP17H01777.
REFERENCES
Dietterich, T. G. and Bakiri, G. (1995). Solving mul-
ticlass learning problems via error-correcting output
codes. Journal of Artificial Intelligence Research,
2:263–286.
Eckhard H. Hess, J. M. P. (1964). Pupil size in rela-
CHIRA 2018 - 2nd International Conference on Computer-Human Interaction Research and Applications
68

tion to mental activity during simple problem-solving.
Science, 143(3611):1190–1192.
Inc MathWorks. MATLAB. http://www.mathworks
.co.jp/products/matlab.html. (Accessed May. 2018).
Jorna, P. G. A. M. (1992). Spectral analysis of heart rate
and psychological state: A review of its validity as a
workload index. Biological Psychology, 34(2):237–
257.
Kosuke, U., Koutarou, O., Kazune, M., Hirotake, I., and
Hiroshi, S. (2000). Process in evaluation index of in-
tellectual productivity based on work concentration.
Lecture Notes on Software Engineering, 2(1):635–
640.
Mulder, G. and Mulder, L. J. M. (1981). Information
processing and cardiovascular control, psychophysi-
ology. Psychophysiology, 18(4):392–402.
Sakamoto, T., Okumura, S., Imanishi, R., Taki, H., Sato,
T., Yoshioka, M., Inoue, K., Fukuda, T., and Sakai,
H. (2015). Remote heartbeat monitoring from human
soles using 60-ghz ultra-wideband radar. IEICE Elec-
tronics Express, 11(25):1–6.
Seeing Machines. faceLAB 5. http://www.ekstrem-
makina.com/EKSTREM/product/facelab/index.html
(Accessed May. 2018).
Tryon, W. W. (1975). Pupillometry: A survey of sources of
variation. Psychophysiology, 12(1):90–93.
Tsukahara, J. S., Harrison, T. L., and Engle, R. W. (2016).
The relationship between baseline pupil size and in-
telligence. Cognitive Psychology, 91:109–123.
Wargocki, P., Wyon, D. P., and Fanger, O. P. (2000). Pro-
ductivity is affected by the air quality in offices. Pro-
ceedings of Healthy Buildings, 1(1):635–640.
Estimation of Intellectual Concentration States using Pupil Diameter and Heart Rate Variability
69
