
Predicting Flare Probability in Rheumatoid Arthritis using Machine
Learning Methods
Asmir Vodenčarević
1
, Marlies C. van der Goes
2
, O’Jay A. G. Medina
3
, Mark C. H. de Groot
4
,
Saskia Haitjema
4
, Wouter W. van Solinge
4
, Imo E. Hoefer
4
, Linda M. Peelen
5
, Jacob M. van Laar
2
,
Marcus Zimmermann-Rittereiser
1
, Bob C. Hamans
6
and Paco M. J. Welsing
2
1
Digital Services, Siemens Healthcare GmbH, Erlangen, Germany
2
Department of Rheumatology & Clinical Immunology, UMC Utrecht, Utrecht University, Utrecht, The Netherlands
3
Department of Information Technology, UMC Utrecht, Utrecht University, Utrecht, The Netherlands
4
Department of Clinical Chemistry and Hematology, UMC Utrecht, Utrecht University, Utrecht, The Netherlands
5
Julius Center for Health Sciences and Primary Care, UMC Utrecht, Utrecht University, Utrecht, The Netherlands
6
Enterprise Services & Solutions, Siemens Healthcare Nederland B.V., The Hague, The Netherlands
Keywords: Predictive Modeling, Flare Probability, Rheumatoid Arthritis, Electronic Medical Record.
Abstract: Rheumatoid Arthritis (RA) is a chronic inflammatory disease that mostly affects joints. It requires life-long
treatment aiming at suppression of disease activity. RA is characterized by periods of low or even absent
activity of the disease (“remission”) alternated with exacerbations of the disease (“flares”) leading to pain,
functional limitations and decreased quality of life. Flares and periods of high disease activity can lead to
joint damage and permanent disability. Over the last decades treatment of RA patients has improved,
especially with the new “biological” drugs. This expensive medication also carries a risk of serious adverse
events such as severe infections. Therefore patients and physicians often wish to taper the dose or even stop
the drug, once stable remission is reached. Unfortunately, drug tapering is associated with the increased risk
of flares. In this paper we applied machine learning methods on the Utrecht Patient Oriented Database
(UPOD) to predict flare probability within a time horizon of three months. Providing information about
flare probability for different dose reduction scenarios would enable clinicians to perform informed tapering
which may prevent flares, reduce adverse events and save drug costs. Our best models can predict flares
with AUC values of about 80%.
1 INTRODUCTION
Rheumatoid Arthritis (RA) is the most common
chronic inflammatory autoimmune joint disease
affecting as much as 1% of the Western population
(WHO, 2018). To date the specific causes of the
disease are unknown, but dysregulation of the
immune system plays a major role (Smolen et al.,
2016). The disease is characterized by joint swelling
and pain as results of synovial inflammation caused
by immune activation. This eventually leads to joint
damage and permanent disability as illustrated in
Fig. 1. Although primarily joints are involved, the
disease should be considered a systemic disease
where also extra-articular manifestations, such as
rheumatoid nodules, pulmonary involvement, vascu-
Figure 1: Permanent destrucion of hand joints affected by
rheumatoid arthritis (RheumatologyAdvisor, 2018).
litis, and comorbidities occur (Smolen et al., 2016).
In general, RA patients suffer from significantly
reduced quality of life.
Voden
ˇ
carevi
´
c, A., Goes, M., Medina, O., Groot, M., Haitjema, S., Solinge, W., Hoefer, I., Peelen, L., Laar, J., Zimmermann-Rittereiser, M., Hamans, B. and Welsing, P.
Predicting Flare Probability in Rheumatoid Arthritis using Machine Learning Methods.
DOI: 10.5220/0006930501870192
In Proceedings of the 7th International Conference on Data Science, Technology and Applications (DATA 2018), pages 187-192
ISBN: 978-989-758-318-6
Copyright © 2018 by SCITEPRESS – Science and Technology Publications, Lda. All rights reserved
187

To date, there is no known cure for RA and
treatment is life-long. However, treatment has
improved considerably during the last decades, with
early diagnosis and direct start of treatment with a
conventional synthetic Disease Modifying Anti-
Rheumatic Drugs (cDMARD) regimen, typically
including methotrexate as the first line drug with
adjustments of treatment when the activity of the
disease is not sufficiently suppressed (treat-to-
target). Other DMARDs can be added or replace the
initial DMARD. Furthermore a biological Disease
Modifying Anti-Rheumatic Drug (bDMARD) can be
started as the second line treatment (Bouman et al.,
2017; Smolen et al., 2016 ). The preferred treatment
target is so-called remission, i.e. a very low level of
disease activity, a target which nowadays can often
be reached and maintained over longer periods of
time.
DMARDs suppress inflammation, thereby
reducing the progression of joint damage and
development of functional disability. Due to
suppression of the immune system, patients
receiving biological treatment are more susceptible
to severe infections, and even to increased risk of
certain types of malignancy, among other side
effects (Singh et al., 2011; Singh et al., 2015).
Moreover, patients need to self-inject the drug on a
regular basis or receive intravenous infusions in the
hospital. From a socio-economic point of view, the
costs of biological treatment are notable, summing
up to about 17,000 USD in Europe and 26,000 USD
in the USA per patient per year (Bouman et al.,
2017).
In order to minimize the risk of drug side effects,
but also to meet patients’ desire for “drug holidays”
and minimize costs, dose tapering is sometimes
performed and the drug may even be stopped for as
long as remission remains. Tapering is typically
applied via gradually reducing the dose and closely
monitoring the patient’s disease activity. Tapering
can lead to two outcomes: (1) either completely
stopping medication (rare case) or (2) finding a
lower dose level which still keeps the disease
activity at an acceptable level. However, tapering is
not always tried, because of fear for flares of disease
activity by patients and physicians. A flare is an
acute increase of disease activity, which is
associated with pain and functional limitations for
patients. Although flares are treatable by
intensifying the medication, they are associated with
additional hospitalizations, follow-up visits and
decreased quality of life in general (Bouman et al.,
2017).
Unfortunately, it is currently unclear in clinical
practice which patients are suitable candidates for
dose reduction of medication (Edwards et al., 2017;
Verhoef et al., 2017). More insights on this are
highly desired, aiming at informed shared decision
making of clinicians together with their patients
regarding tapering of bDMARDs and (further)
personalizing the tapering strategy to an individual
patient. Moreover, by making more appropriate
tapering decisions, clinicians would (1) reduce the
occurrence of flares during tapering, (2) reduce the
associated need for extra follow-up visits as well as
(3) increase the quality of life of their RA patients.
Finally, with available and accurate guidance,
clinicians would probably perform tapering more
often, ultimately leading to lower treatment costs
with comparable effectiveness and less adverse
events.
In this paper we publish the first results of our
study with the goal to evaluate feasibility of
accurately predicting flare probability for individual
patients using (1) data as collected in routine
medical care and (2) machine learning methods. The
work was conducted in a clinical research
collaboration between the University Medical Center
Utrecht in the Netherlands and Siemens Healthineers
within the ADAM (Applied Data Analytics in
Medicine) Programme of the UMC Utrecht.
2 RELATED WORK
There have been multiple studies on bDMARD dose
reduction in RA patients (see Verhoef et al., 2017
for a summary of 45 such studies). They differ in
multiple aspects, from study design to definitions of
remission and flare, making their direct comparison
difficult. Nevertheless, it can be concluded that
abrupt drug discontinuation carries a high risk of
flares. Best practices indicate that tapering should be
a gradual process and include close monitoring of
the disease activity in a patient.
Machine learning methods have been already
applied in the context of diagnosing RA. In
(Shiezadeh et al., 2015) an ensemble learning
approach (generating and combining multiple
predictive models) was proposed to diagnose
rheumatoid arthritis. Reported diagnosis accuracy of
the best model was 85% with a sensitivity of 44%.
The work given in (Lin et al., 2013) deals with
the automatic prediction of RA disease activity from
the Electronic Medical Records (EMR data). Here
the focus was on utilizing the features extracted
from clinical notes by Natural Language Processing
DATA 2018 - 7th International Conference on Data Science, Technology and Applications
188

(NLP) methods. Laboratory values are used
additionally to predict one of the four classes of
disease activity (high, moderate, low, remission) as
defined for the Disease Activity Score in 28 joints
(DAS28, Prevoo et al., 1995). The reported AUC
measured in a 10-fold cross validation was 83.1%. It
is important to note that lab measurements had
higher predictive power than the features extracted
from text. In this work, the disease activity (i.e. its
level) was predicted for the current patient visit and
not for any future time horizon as performed in our
study.
Very few papers are published that deal
specifically with predicting future flares. One
notable work deals with predicting flares in
DMARD-treated RA patients in remission (Saleem
et al., 2012) using both clinical data and ultrasound
imaging. However, in this paper the authors focused
on patients receiving cDMARD whose dose is not
systematically tapered.
A recent review on tapering (Verhoef et al.,
2017) concluded that: “Unfortunately, no clear
predictors of successful dose reduction have been
identified so far”. To the best of our knowledge, this
is the first paper with results on dynamically (i.e.
over time) predicting the probability of a (future)
flare for individual RA patients on bDMARD
therapy from routinely collected EMR data using
machine learning methods.
3 DATA PREPARATION
3.1 Patient Selection
Data was extracted from electronic medical records
using the Research Data Platform (RDP) and the
Utrecht Patient Oriented Database (UPOD) of the
UMC Utrecht in line with all ethical and privacy
regulations. The research was conducted in
accordance with the declaration of Helsinki and
evaluated by the IRB (Institutional Review Board)
which waived the formal informed consent
requirement. In the first step a target group of RA
patients treated at the Department of Rheumatology
& Clinical Immunology of the University Medical
Center Utrecht receiving biological treatment was
selected from electronic medical records. It included
588 patients out of which 314 patients became
eligible for tapering at least once (i.e. who had stable
low disease activity or remission) and were chosen
for the analysis. The unit of analysis was a patient
follow-up during the bDMARD course (i.e. a patient
followed from start of the treatment until start of the
next bDMARD treatment or end of the follow-up).
Longitudinal data on bDMARD use was merged
with data on disease activity variables and relevant
patient and disease characteristics by bringing all
values collected within a 4 week period to a data
vector corresponding to a single follow-up to reduce
the amount of missing data.
After removing all (4-week) visits before the
eligibility for tapering and those for which the target
variable could not be derived (due to insufficient
data on disease activity variables during the 3 month
follow-up after a visit), we ended up with about
2,000 instances that were included in the analysis.
3.2 Applied Definitions
There is a notable variance in definitions of relevant
terms such as a remission or a flare observed in the
literature (Verhoef et al., 2017). For the purpose of
this work, we have used the following definitions in
line with previously developed and validated
definitions as much as possible taking into account
the completeness of the available data.
Definition 1. Estimated Disease Activity Score in 28
joints (DAS28_est) is the mean value of all available
DAS28 measurements collected within a 4 week
period (for more details on DAS28 and its
components see Prevoo et al., 1995).
Definition 2. Dose percentage (Doseperc) is the
dose of bDMARD expressed as the proportion of the
standard (full) dose.
Definition 3. Dose category (Dosecat) is defined as
follows:
Category 1: Doseperc < 0.2
Category 2: 0.2 <= Doseperc < 0.4
Category 3: 0.4 <= Doseperc < 0.6
Category 4: 0.6 <= Doseperc < 0.75
Category 5: Doseperc >= 0.75
Definition 4. Swollen Joint Count 28 (SJC28) is
defined as the count of observed swollen joints of 28
joints assessed at a patient visit.
Definition 5. “Remission” is defined as:
DAS28_est < 3.2 AND SJC28 < 2
(1)
When a patient reaches this at least at one time
point after the start of bDMARD and had a follow-
up of at least 24 weeks this patient was considered
eligible for bDMARD tapering.
Predicting Flare Probability in Rheumatoid Arthritis using Machine Learning Methods
189

Definition 6. Flare is defined as:
Increase from last visit in DAS28_est > 1.2 with
≥ 1 increase in SJC28 and DAS28_est at
endpoint ≥ 2.6 OR
Increase from last visit in DAS28_est > 0.6 and
DAS28_est at endpoint ≥ 3.2 with an increase of
SJC28 ≥ 1 OR
Increase in medication (Dosecat) from last visit
without DAS28_est at endpoint < 2.6 (either
missing or DAS28_est ≥ 2.6)
Definition 7. Target Event is an indicator showing if
a patient experienced a flare within 3 months from
the current follow-up. It gets the following values:
Value 1: if flare is observed within 3 months
from the current follow-up
Value 0: otherwise.
3.3 Input and Output Variables
Input variables used in the analysis are measured
longitudinally unless mentioned otherwise and can
be clustered into following groups:
Demographic data including (only measured
cross-sectionally): age, gender, weight, height,
BMI, disease duration, smoking
Laboratory data including: ESR, CRP, anti-
CCP positivity, rheumatoid factor
Medication data including: ATC codes, dose
(i.e. Doseperc and Dosecat)
Examination data including: follow-up time,
DAS28_est, SJC28, Tender Joint Count28
(TJC28), VAS-General Health, erosive
disease (measured cross-sectionally).
The output variable for the predictive modeling
was the Target Event as defined by Definition 7. The
prediction horizon of three months is selected
because it corresponds to the typical visit frequency
of RA patients.
We have observed the following major challenges
in analysing the routinely collected EMR data:
Relatively high number of missing values in
the input variables: treated by several
remedies including deleting whole variables,
deleting (filtering) observations, median
imputation and introducing a dummy variable
Missing output variable for many follow-ups:
resulting in inclusion of only about a quarter
available follow-ups in the analysis
Imbalanced output variable (class labels have
ratio 4:1 with the majority of instances having
the class ‘0’): treated by assigning a higher
weight to the minority class to penalize its
misclassification more heavily.
4 METHODOLOGY
4.1 Modeling Formalisms
After extracting the data from the RDP and UPOD
and its extensive (non-trivial) preparation described
before, a modeling step is performed. From the
nature of the target variable it follows that the task
of predicting a flare probability for individual RA
patients whose biological therapy is being tapered is
a problem of supervised machine learning and more
concretely a problem of binary classification. There
are various modeling formalisms suited for
addressing this problem. Since we were interested in
predicting probability of classes in addition to their
label, we relied on modeling formalisms capable of
generating probability estimates. In this work, we
tested different models focusing mostly on logistic
regression and random forest (Hastie et al., 2009).
For both formalisms we tested multiple values of
their corresponding hyperparameters including:
Logistic regression: different thresholds for
filtering out features with low variance,
regularization type (L1 vs. L2), and the value
of the regularization parameter
Random forest: number of trees in a forest,
maximum depth of a tree, minimum number
of samples required to split a node, minimum
number of samples at a leaf node, and a
splitting criterion (Gini impurity vs.
information gain).
The optimal values of these hyperparameters are
found using a cross-validation procedure (Hastie et
al., 2009), always evaluating the overall
performance of the corresponding approach on
independent test sets. The folds of the cross-
validation are selected in a stratified manner
ensuring that each train and test fold include roughly
the same proportions of the two classes.
Additional care was taken to have all the data
belonging to a single patient either in the training or
in the test set in every fold of the cross-validation. In
this way, we ensure that no leakage of patient’s
future data takes place. Additionally, data
preprocessing models are in each fold derived from
the training set and just applied to the corresponding
test set. Algorithms and models are developed using
the Python language and libraries: scikit-learn,
pandas, numpy and matplotlib.
DATA 2018 - 7th International Conference on Data Science, Technology and Applications
190
4.2 Performance Metrics
In order to evaluate the performance of different
predictive models, we have computed the Area
Under the Receiver Operating Characteristics
(AUROC; Fawcett, 2006), which is a commonly
used metric in binary classification. The ROC
curve graphically shows a number of possible
operating points of a classifier, each corresponding
to a specific trade-off between metrics called
sensitivity and specificity. In our case, sensitivity
represents the probability that truly occurring flares
(within the specified time horizon of 3 months) will
be recognized as such by a classifier. Similarly,
specificity is the probability that truly not-
occurring flares will be recognized as such by a
classifier.
AUROC provides information about the
discriminatory power of a classifier but doesn’t
show how well a classifier is “calibrated”. A
classifier is said to be well-calibrated if the predicted
probabilitiy of a class matches that class’ expected
frequency. Calibration is relevant in cases when
predicting a class probability is important, in
addition to predicting a class label. As we are
interested in knowing a flare probability within the
given time horizon, we’ve implemented calibration
plots (Niculescu-Mizil et al., 2005) in addition to the
ROC curves.
5 RESULTS
As mentioned before, mainly two algorithms
(logistic regression and random forest) and values
of their corresponding hyperparameters are
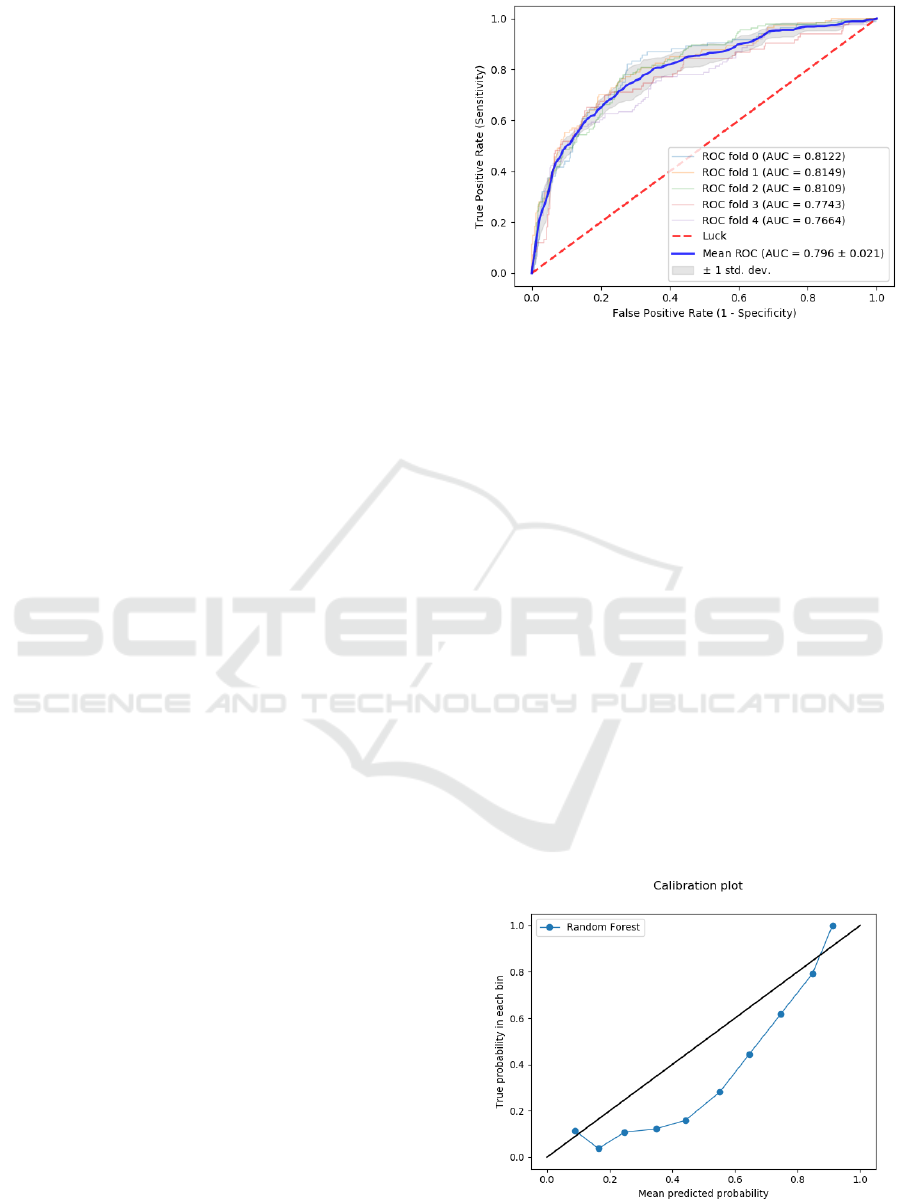
evaluated. The best model turned out to be a
random forest model, which reached AUROC of
0.796 ± 0.021 (mean ± one standard deviation). Its
overall discriminatory performance is given in Fig.
2. Small differences between the AUROC values of
the individual folds (summarized in the small
standard deviation of their mean value) indicate the
robustness of the random forest model.
Looking at these results we conclude that it is
possible to predict the probability of a (future) flare
using the routinely collected EMR data with
reasonable accuracy. The most important group of
predictors were (as expected) medication data,
surprisingly followed by demographic data.
Interestingly most of the examination and
laboratory data played only a marginal role in the
final model.
Figure 2: ROC curve of the best predictive random forest
model. AUC values are given for each fold of the cross-
validation. Mean AUC value is followd by the standard
deviation.
The performance of several other models
(logistic regression and adaboost) was close to this
best result obtained with random forests, having
AUROC only 2 to 3 percent points lower. On the
other hand, a couple of other models had
significantly lower AUROC (k-NN, decision tree) of
about 70%.
In addition to measuring the AUC, we also
evaluated the model calibration. Fig. 3 shows a fair
calibration plot, which indicates that the model is
somewhat underconfident in predicting the
probabilities between 20% and 80%. It is important
to note that the plot relates to the default model; i.e.
without any calibration measures undertaken. Most
likely, the model calibration can be improved
significantly using the standard approaches such as
Platt Scaling or Isotonic Regression (Niculescu-
Mizil et al., 2005).
Figure 3: Calibration plot of the best predictive model.
Predicting Flare Probability in Rheumatoid Arthritis using Machine Learning Methods
191

6 CONCLUSION AND FUTURE
WORK
In this work we showed that routinely collected
EMR data has clinical utility in predicting future RA
flare probability in patients treated with biological
DMARDs in daily practice. Several predictive
machine learning models were developed and tested
with the best one having an AUROC of about 80%.
This relatively good predictive power could enable
decision support for physicians and patients to guide
tapering of bDMARDs once low disease activity or
remission is reached. This offers potential to lower
the risk of adverse events, meet patients’ desire for
drug holidays, lower the overall costs for expensive
biological drug treatment and retain good control of
disease activity in RA patients.
In the future we plan to validate, calibrate and
test the generalizability of developed models and
approaches using external patient data, coming from
different clinics.
ACKNOWLEDGEMENTS
This project was made possible by the Applied Data
Analytics in Medicine (ADAM) programme of the
University Medical Center Utrecht, Utrecht, the
Netherlands. The authors would like to specifically
acknowledge ir. Hyleco H. Nauta and Harry Pijl,
MBA for their organizational support. Additionally,
the authors would like to acknowledge Arjan
Westrik from Accenture as well as Heike Bollmann
and Bas Idzenga from Siemens Healthineers for their
overall support to the ADAM-RA Project. We are
grateful to rheumatologists of the UMC Utrecht for
their valuable input regarding clinical definitions
and suggestions for implementation during the
project. Moreover, we thank the pharmacy of the
UMC Utrecht for their valuable insights in the
process of medication handling.
REFERENCES
World Health Organization, 2018. www.who.int. Online
resource.
Smolen, J. S., Aletaha, D., McInnes, I. B., 2016.
Rheumatoid arthritis. In Lancet, volume 388, pages
2023-2038.
RheumatologyAdvisor, 2018. www.rheumatologyadvisor.
com. Online resource.
Bouman, C. A. M., van Herwaarden, N., van den Hoogen,
F. H. J., et al., 2017. Long-term outcomes after disease
activity-guided dose reduction of TNF inhibition in
rheumatoid arthritis: 3 year data of the DRESS study –
a randomised controlled pragmatic non-inferiority
strategy trial. In Ann Rheum Dis, volume 76, pages
1716–1722.
Singh, J. A., Wells, G. A., Christensen, R., et al., 2011.
Adverse effects of biologics: a network meta-analysis
and cochrane overview. In Cochrane Database Syst
Rev., volume 2.
Singh, J. A., Cameron, C., Noorbaloochi, S., et al., 2015.
Risk of serious infection in biological treatment of
patients with rheumatoid arthritis: a systematic review
and meta-analysis. In Lancet, pages 258-265.
Edwards, C. J., Fautrel, B., Schulze-Koops, H., et al.,
2017. Dosing down with biologic therapies: a
systematic review and clinicians’ perspective. In
Rheumatology, volume 56(11), pages 1847-1856.
Verhoef, L. M., Tweehuysen, L., Hulscher, M. E., et al.,
2017. bDMARD Dose Reduction in Rheumatoid
Arthritis: A Narrative Review with Systematic
Literature Search. In Rheumatology and Therapy,
volume 4(1), pages 1-24.
Shiezadeh, Z., Sajedi, H., Aflakie, E., 2015. Diagnosis of
Rheumatoid Arthritis Using an Ensemble Learning
Approach. In Intl. Conf. on Advanced Information
Technologies and Applications, pages 139-148.
Lin, C., Karlson, E., W., Canhao, H., et al., 2013.
Automatic prediction of rheumatoid arthritis disease
activity from the electronic medical records. In PLoS
ONE, 8(8): e69932.
Prevoo, M. L. L., van't Hof, M. A., Kuper, H. H., et al.,
1995. Modified disease activity scores that include
twenty-eight-joint counts. In Arthritis Rheum, volume
38, pages 44-48.
Saleem, B., Brown, A., K., Quinn, M., et al., 2012. Can
flare be predicted in DMARD treated RA patients in
remission, and is it important? A cohort study In
Annals of the Rheumatic Diseases, 71:1316-1321.
Hastie, T., Tibshirani, R., Friedman, J., 2009. The
Elements of Statistical Learning, Springer, Stanford,
CA, 2
nd
edition.
Fawcett, T., 2006. An introduction to ROC analysis. In
Patt. Rec. Letters, volume 27, pages 861-874.
Niculescu-Mizil, A., Caruana, R., 2005. Predicting Good
Probabilities With Supervised Learning. In Proc. Intl.
Conf. on Machine Learning, pages 625-632.
DATA 2018 - 7th International Conference on Data Science, Technology and Applications
192
