
Beyond k-NN: Combining Cluster Analysis and Classification for
Recommender Systems
Rabaa Alabdulrahman
1
, Herna Viktor
1
and Eric Paquet
1,2
1
School of Electirical Engineering and Computer Science, University of Ottawa, Ottawa, Canada
2
National Research Council of Canada, Ottawa, Canada
Keywords: Recommendation Systems, Hybrid Model, Data Sparsity, Cluster Analysis, Classification, Learning.
Abstract: Recommendation systems have a wide application in e-business and have been successful in guiding users
in their online purchases. The use of data mining techniques, to aid recommendation systems in their goal to
learn the correct user profiles, is an active area of research. In most recent works, recommendations are
obtained by applying a supervised learning method, notably the k-nearest neighbour (k-NN) algorithm.
However, classification algorithms require a class label, and in many applications, such labels are not
available, leading to extensive domain expert labelling. In addition, recommendation systems suffer from a
data sparsity problem, i.e. the number of items purchased by a customer is typically a small subset of all
ĉvailable products. One solution to overcome the labelling and data sparsity problems is to apply cluster
analysis techniques prior to classification. Cluster analysis allows one to learn the natural groupings, i.e.
similar customer profiles. In this paper, we study the value of applying cluster analysis techniques to
customer ratings prior to applying classification models. Our HCC-Learn framework combines content-
based analysis in the cluster analysis stage, with collaborative filtering in the recommending stage. Our
experimental results show the value of combining cluster analysis and classification against two real-world
data sets.
1 INTRODUCTION
Recommendation systems are a widely researched
area within computer science and business due to the
added value offered to commercial organizations
that are embracing the increasing demand of 24/7
online shopping. That is, many organizations have
realized that with accurate recommendations,
browsers may turn into buyers, while one-time
buyers may turn into loyal consumers. Therefore,
there is a need not only to make the best
recommendations, but also to find the most pertinent
recommendation for each customer, rather than just
displaying a list of most popular items.
The use of data mining techniques, and notably
the k-nearest neighbour (k-NN) classification
method, has been proposed as a way to improve the
accuracy and personalization of recommendations
(Su and Khoshgoftaar, 2009, Wei et al., 2007). A
major problem of current solutions is that the
number of items within a “shopping basket” often
constitutes a tiny subset of those on sale. This data
sparsity problem may lead to inaccurate
recommendations since data mining techniques may
not generalize well across large dimensions. Further,
classification algorithms require class labels, which
are frequently scattered or expensive to obtain. That
is, manual labelling of customers is time-consuming
and expensive, and consequently not realistic in an
environment where the numbers of customers and
items are huge.
Generally speaking, recommendation systems
are divided into three categories: content-based (CB)
recommendations, systems based on collaborative
filtering (CF) recommendations, and hybrid
recommendations. A content-based recommendation
focuses on the item matrix and assumes that users
who showed interest in some items in the past will
be interested in similar items in the future (Minkov
et al., 2010, Acosta et al., 2014). Hence, these
systems study the general attributes and categories
associated with the items (Liao and Lee, 2016). On
the other hand, collaborative filtering focuses on
user-rating matrices. These types of systems
recommend items that have been rated by the users
who present the most similar preference with respect
82
Alabdulrahman, R., Viktor, H. and Paquet, E.
Beyond k-NN: Combining Cluster Analysis and Classification for Recommender Systems.
DOI: 10.5220/0006931200820091
In Proceedings of the 10th International Joint Conference on Knowledge Discovery, Knowledge Engineering and Knowledge Management (IC3K 2018) - Volume 1: KDIR, pages 82-91
ISBN: 978-989-758-330-8
Copyright © 2018 by SCITEPRESS – Science and Technology Publications, Lda. All rights reserved

to the target user (Saha et al., 2015). Therefore,
collaborative filtering systems rely generally on the
historic data of user ratings and similarities across
the user network (Minkov et al., 2010). As stated in
Elahi et al. (2013), the prediction algorithm
characteristics as well as the number and the quality
of the ratings stored in the system highly influence
the performance of a CF system. Finally, hybrid
systems take characteristics from both collaborative
and content-based filtering. Therefore, these
systems consider both items based on users’
preferences and similarity between the items’
content (Acosta et al., 2014).
As mentioned above, all types of
recommendation systems have inherent challenges
collecting relevant information about users or items.
The data sparsity problem refers to the fact that the
number of items that customers purchase are, in
general, much smaller than the number of items on
sale (Su and Khoshgoftaar, 2009). Further, there is a
need to group customers who purchase similar
items, such as two similar types of bicycles, together
without invoking explicit manual labelling.
This paper addresses the label and data sparsity
problems through the use of data mining techniques.
Specifically, our contributions are as follows. We
created a hybrid cluster analysis and classification
learning framework, named HCC-Learn, that
combines unsupervised and supervised learning to
obtain highly accurate classification models. Further,
we completed an extensive study of different types
of cluster analysis techniques and reported on their
impact on classification accuracy. Finally, we
showed that combining the k-NN algorithm with the
expectation maximization (EM) cluster analysis,
hierarchical clustering, canopy, k-means, and
cascade k-means method generally produces high-
quality results against the datasets used in our study.
The k-NN algorithm is used for this part of the
experiment because of its popularity in the
recommendation system research area, especially
when using CF- based techniques (Sridevi et al.,
2016, Katarya and Verma, 2016).
The rest of the paper is organized as follows.
Section 2 discusses some related research in the
recommendation system area. In Section 3 we
present our HCC-Learn framework along with its
various components. Section 4 details the datasets,
experiment setup, and evaluation methodology. The
results are discussed in Section 5, while Section 6
concludes the paper.
2 RELATED WORK
Several studies show that employing cluster analysis
as a pre-processing step leads to highly accurate
models. Clustering and classification have been used
within the same framework in many research areas,
such as marketing, social network analysis, and
study of human behaviour, to improve
advertisements (Wei et al., 2007).
In recent years, researchers have been studying
human behaviour in an attempt to better simulate it
and improve the accuracy of machine learning and
artificial intelligence algorithms. For instance,
customer habits and day-to-day activities affect
marketing campaigns and revenues.
Recommendation systems in e-business have been
used extensively to gain customer loyalty and
increase profits. In (Liao and Lee, 2016), the authors
employ self-clustering techniques to reduce the high
dimensionality of the products matrix. By assorting
similar products into groups prior to supervised
learning, the classification algorithms were able to
produce accurate recommendations to the user while
reducing the waiting time.
Moreover, studies have shown that the type and
volume of the collected data highly influence the
recommender system accuracy. It follows that
sparsity has a crucial impact on the accuracy. A
number of researchers have addressed this problem.
For instance, Kanagal et al. (2012) introduced the
taxonomy-aware latent factor model that uses a
mixture of taxonomies and latent factor models.
Cluster analysis methods were applied to categorize
items in the matrix by using human-labelled
categories. They created this model to address both
the “cold-start” (i.e., incorporating unknown,
anonymous users or new items) and the data sparsity
problems.
Wang et al. (2015) presented another solution:
deep learning to alleviate the sparsity in the dataset.
Deep representation learning, for both the items’
information and user rating, was performed using a
hierarchical Bayesian analysis.
As we mentioned earlier, users’ unwillingness to
share information, often for privacy reasons, is one
of the main causes for sparsity. For this reason,
(Nikolaenko et al., 2013) used a hybrid approach
with matrix factorization that enables the system to
collect additional information about the items while
preserving users’ privacy. In another research
project, (Guo et al., 2012) created a simpler
approach in which the system essentially “borrows”
information from the targeted user’s neighbour.
These neighbours are chosen from the user’s trusted
Beyond k-NN: Combining Cluster Analysis and Classification for Recommender Systems
83

social network. The model simply merges the
collected information with those relative to the
targeted user to find similar users in the system’s
network.
Furthermore, in mobile applications, data are
continuously collected. However, only a few users
rate locations they visited; they keep returning,
however, because they are satisfied with the services
provided. Based on this observation, Rank-GeoFM
collects the check-in and check-out point to add
more information to the system (Li et al., 2015).
Similarly, location-based social networks apply
clustering to similar point-of-interests in the item
matrix to solve the sparsity problem (Lian et al.,
2014).
To the best of our knowledge, a study on the
impact of cluster analysis techniques has not been
conducted. In the next section, we introduce the
HCC-Learn multi-strategy learning framework in
which multiple cluster analysis and classification
techniques co-exist.
3 HCC-LEARN FRAMEWORKS
This section presents our HCC-Learn framework.
Through it we address the label and data sparsity
problems through the combination of cluster
analysis and classification algorithms.
3.1 Framework Components
Figure 1 shows the general outline of our HCC-
Learn framework. We build hybrid models by
combining cluster analysis and classification
techniques. Our aim is to address two research
questions in the data mining and recommendation
system areas. The first one is the value of applying
cluster analysis techniques to the datasets before
building our model using classification algorithms,
thus addressing the label sparsity problem. Second,
we address data sparsity by exploring various cluster
analysis techniques.
It follows that data pre-processing, including
data exploration, cleansing, and categorization, are
performed prior to learning. Data pre-processing is a
crucial step, especially when considering the
conversion of nominal data, the normalization of
numeric data, and the determination of the “best”
distance function, when applicable.
Our proposed method is shown in algorithm 1. In
the first stage, cluster analysis techniques (A1 …
An) are applied to the pre-processed datasets. In
general, cluster analysis algorithms group similar
items into one cluster, attempting to keep inter-
cluster similarity low. A number of diverse
algorithms are employed, namely partitioning,
hierarchical, density, and model-based (Pande et al.,
2012). Generally, clustering may be divided into
hard and soft clustering. Hard clustering assigns
each point to one and only one group, whereas soft
clustering allows overlapping between these groups.
This means that each point may simultaneously
belong to one or more clusters (Mishra et al., 2015).
In recommendation systems, soft clusters are
preferred because of their ability to better capture
users’ interest by allowing them to be associated
with more than one group (Mishra et al., 2015). In
this paper, we use the EM technique to perform soft
clustering. The HCC-Learn framework builds on this
observation in that we incorporate multiple cluster
analysis algorithms with extremely different learning
styles. Applying the algorithms (
…
) to the
dataset results in n different models being built,
denoted by (
…
). Next, we conduct a clusters-
to-classes evaluation for all
. That is, each pair of
clustering and classification algorithms is considered
in the evaluation.
Algorithm 1: HCC-Learn Recommendation.
Input
: a set of class labelled training inputs;
: Classifier;
: Clustering algorithm;
: Number of clusters;
: Class label of ;
: Unknown sample;
Initialization for clustering stage:
1-
discover objects from as initial cluste
r
centre
2- Repeat:
- (re)assign each object to cluster according to
distance measure
- Update
- Calculate new value
Until no change
3- Output models (
,…
)
4- Split dataset into train
and test
.
Initialization for classifications and
prediction stage:
1- Classify (
,,)
2- Output classification model .
3- Test model on
.
KDIR 2018 - 10th International Conference on Knowledge Discovery and Information Retrieval
84
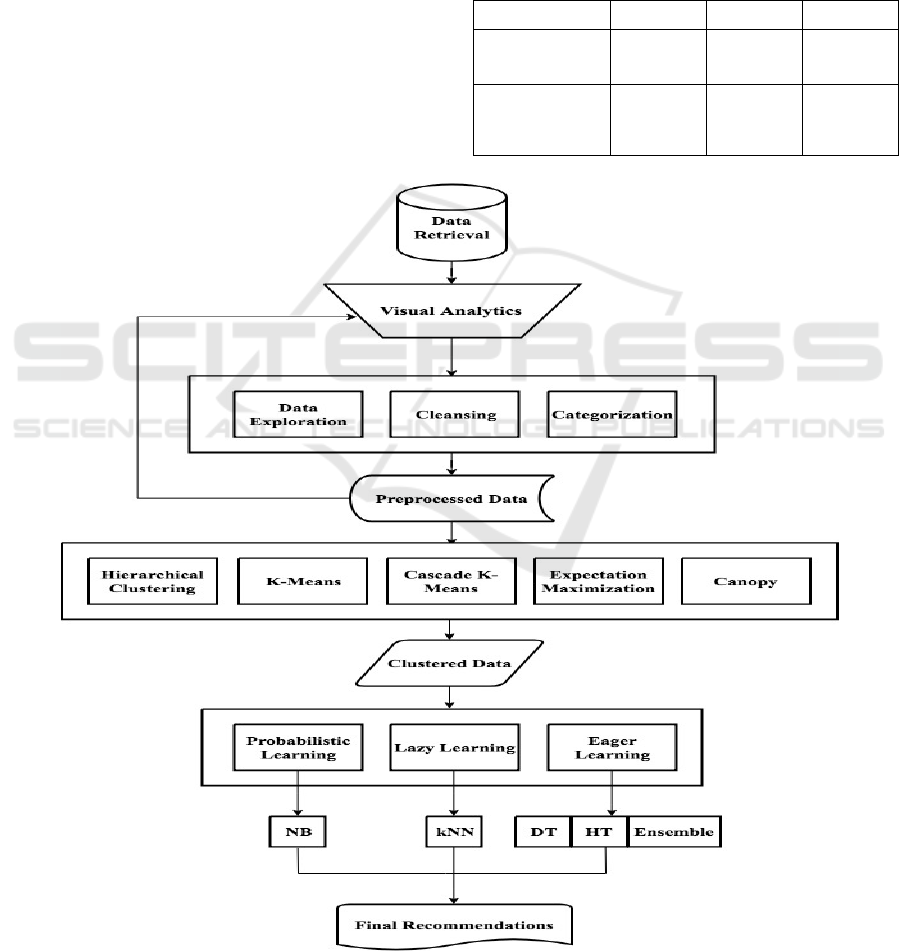
We use classification algorithms (
…
), once
more employing techniques with diverse learning
strategies. To this end, we employ probabilistic,
eager, and lazy learners (Han et al., 2011). The
dataset is divided into training and test sets. The
classifiers proceed to build models against the
training set and test the models accordingly.
Subsequently, we compare the different
classification accuracy for each model. The accuracy
is evaluated, and a cluster analysis algorithm is
selected to improve the prediction accuracy of the
given classifier for a particular dataset. It follows
that this choice is domain dependent. Note that our
framework is generic, in that it may incorporate
virtually any cluster analysis and classification
algorithms.
Finally, for each dataset, the (clustering,
classification) pair that produces the best results, in
terms of accuracy, is selected to recommend items to
the users.
4 EXPERIMENTAL SETUP
All the experiments were conducted on a
workstation with an Inter i5 Core @ 2.7 GHz and 16
gigabytes of memory.
Table 1: Data description.
Dataset #Sample #Attribute #Classes
Restaurant-
Consumer (RC)
1161 14 3
Fuel-
Consumption-
Rating (FCR)
1056 14 5
Figure 1: HCC-Learn Recommendation Framework.
Beyond k-NN: Combining Cluster Analysis and Classification for Recommender Systems
85
4.1 Data Description
In this paper, we use two datasets: the restaurant and
consumer (RC) dataset and the fuel consumption
rating (FCR) case study. Both datasets were
generated based on the customer rating for specific
products. Table 1 summarizes their characteristics.
Table 2: Attributes for the restaurant-consumer data.
User_ID, Accessibility, Alcohol, Ambience, Area,
Marital Status, Place_ID, Parking (Y/N), Price ($)
Transport, Smoking Area (Y/N)
Food Rating, Service Rating, Overall Rating
The RC dataset (Vargas-Govea et al., 2011) were
collected from a recommender system prototype
created with the intent of finding the top-N
restaurants based on consumers’ ratings. In this
dataset, customers belong to three different classes
based on their overall rating. The rest of the data
contains information about the users and restaurants,
together with a user-item rating matrix, as shown in
Table 2.
Table 3: Attributes in the fuel consumption rating data.
Vehicle Make Vehicle Model
Engine_size Fuel_consumption_in_city
Fuel_type Fuel_consumption_on_highway
Vehicle_class Fuel_consumption_Combined
Cylinders Fuel_consumption_Combined_mpg
Transmission CO2_emissions
Rating_CO2 Rating_smog
The second dataset contains an FCR obtained
from the Government of Canada Open Data Project,
and its characteristics are detailed in Table 3
(Natural Resources Canada, 2017). This dataset
includes information regarding the fuel consumption
of vehicles, based on factors such as the engine size,
the number of cylinders, and the transmission type.
In the original dataset, the vehicle make attribute had
42 different values. To reduce this number, attribute
banding was performed, and based on the feedback
from domain experts, two versions of the dataset
were created. In the first version (FCR-1), the
vehicle makes were divided into three categories,
North American, European, and Asian. For instance,
records of vehicles with makes such as Honda, Kia,
and Toyota are all assigned to the Asian category. In
the second version (FCR-2), the vehicles were
divided into seven categories based on the country
where they were designed—the United States,
Germany, Italy, Japan, Korea, the United Kingdom,
and Sweden. For both versions, vehicles belong to
five different classes based on their smog rating.
4.2 Experimental Setup
Our experimental evaluation was conducted using
the WEKA data mining environment (Frank et al.,
2016). In this research, we evaluated the
performance of four individual classifiers: decision
trees and Hoeffding tree (HT) decision trees, as well
as the Naïve Bayes (NB) and k-NN learners. Theses
classifiers belong to the probabilistic, lazy, and eager
learning categories, respectively (Han et al., 2011).
Ensemble learning methods are known for their
ability to increase classification accuracy (Witten et
al., 2011). Hence, two of these methods, bagging
and boosting, were also employed during our
experimentation. The reader should note that most
current recommendation system frameworks employ
the k-NN algorithm, so k-NN constitutes a kind of
benchmark in this particular field.
We employed five different cluster analysis
algorithms: hierarchical clustering (HC), k-means,
the cascade k-means technique, the EM model-based
method, and the canopy clustering technique. These
methods were chosen because of their ability to
handle numeric attributes, nominal attributes, and
missing values, as well as for the diversity of
learning strategies they represent (Han et al., 2011).
In this work, the number of clusters is set to equal
the number of classes in each dataset.
The value of k, for the k-NN algorithm, was set
to 5 by inspection. It follows that the number of base
learners within the ensemble when performing either
bagging or boosting is highly domain dependent.
Following (Alabdulrahman et al., 2016), this number
was set to 25. After the data preparations step, as
detailed in the previous section, the datasets were
divided into training sets (70%) and test sets (30%).
Finally, all classification algorithms were validated
using 10 folds cross-validation. Recall that this
experiment is executed using WEKA. This software
provides four testing options to train a classifier.
According to (Witten et al., 2011), using a training
set as a test option to train the classifier will produce
misleading results. The reason is that the classifier in
this option will be learning from the same training
set. Hence, using cross-validation as a test option in
WEKA will result in more realistic performance.
Also, it results in a smaller variance and gives a
valid statistical sample (Witten et al., 2011).
KDIR 2018 - 10th International Conference on Knowledge Discovery and Information Retrieval
86

4.3 Evaluation Criteria
The selection of algorithms and parameters, and the
evaluation of the results of cluster analysis is still a
topic of much debate (Mythili and Madhiya, 2014,
Zhang and Li, 2012). Recall that in this paper we
evaluate the results of different clusters using the
well-known extrinsic clusters-to-classes evaluation
since the ground truth, in our datasets, is always
available. To evaluate the quality of the
classification on the various datasets after clustering,
we used the model accuracy and the F-score
measure, which fuses the precision and the recall
rates.
5 RESULTS AND DISCUSSIONS
As mentioned earlier, we conducted two sets of
experiments, which are discussed in this section.
5.1 Impact of Cluster Analysis on
Classification
In this section, the three datasets presented in section
4.1 were used to evaluate our framework. Our goal
was to study the impact of using cluster analysis as a
pre-processing step on classification accuracy. That
is, our aim is to determine whether cluster analysis
may improve the classification process through the
identification of natural groupings within the data.
To this end, each classifier was tested separately
using one of the clustering algorithms mentioned in
section 4.2. That is, four individual classifiers and
two ensemble learning techniques were employed
for each of the five clustering algorithms. Therefore,
a total of 72 clustering-classification pairs were
tested during our experimentation.
Our results are reported in Table 4. They clearly
confirm that the use of cluster analysis improves the
classification accuracy considerably. Indeed, the
gains, in terms of accuracy, are quite high, ranging
from 16.24% to 44.92% when comparing the no-
clustering approach to the best-performing method.
On average, the accuracy improves by 29.5% across
all experiments. The cluster analysis algorithms
yield comparable performance against all three
datasets. The results indicate that the EM, HC, and
cascade k-means algorithms generally yield the
highest accuracies. The EM algorithm has the
highest accuracy in 19 experiments, and the HC
algorithm in 10 cases, while the cascade k-means is
the most accurate in 5 cases. Furthermore, for the
RC data, the EM algorithm produces the highest
accuracy 75% of the time.
EM is a model-based method that learns the
soft clusters using a probabilistic mixture of
Gaussian models (Bifet and Kirkby, 2009). The
algorithm consists of two steps, an “assignment”
(expectation) step followed by a “re-centering” (or
maximization) step, similar to the simple k-means
algorithm in which the means, the covariance
matrices, and the weights associated with the various
Gaussian distributions (or clusters) are re-evaluated.
The algorithm keeps iterating until convergence
(Bifet and Kirkby, 2009).
The HC method follows an agglomerative
approach when generating clusters. In this bottom-
up approach, each observation starts in its own
cluster, and pairs of clusters are merged as one
moves up through the hierarchy. In our
implementation, we used the mean distance to merge
clusters (Witten et al., 2011).
The cascade k-means is a dendrite-based method,
based on the Calinski-Harabasz criterion (Calinski,
and Harabasz, 1974), that extends the simple k-
means algorithm by creating several partitions. That
is, starting with a small k, it proceeds by cascading
clusters from a small to a large number of groups,
thus using a top-down method. These groupings are
formed by iterating though the original k-means
algorithm. This algorithm finds the correct number
of classes, but is different from the k-means method
where k is a parameter set by the inspection,
potentially leading to higher accuracies. This is
confirmed by our experimental results.
In summary, those results indicate that EM, HC,
and cascade k-means are the most successful
clustering algorithms. Intuitively, in a
recommendation system setting where the number of
items is far higher than the subset purchased by a
consumer, such flexibility is preferred.
Next, we consider the results in terms of
classification algorithms. Our evaluation shows that
there is no clear winner in terms of predictive
accuracy. Nevertheless, all classification algorithms
clearly profit from the clustering step. Further, the
reader will notice that the k-NN is clearly
outperformed by the other classification algorithms.
This result seems to advise against the standard
practice of using k-NN for recommendation systems.
In recommendation systems and classification
models, recall and precision are usually used to
assert the “truthfulness” level of the model. Indeed,
recall gives the ratio of the retrieved items
considered notable by the user to the total of relevant
items, whereas precision provides the ratio of
Beyond k-NN: Combining Cluster Analysis and Classification for Recommender Systems
87
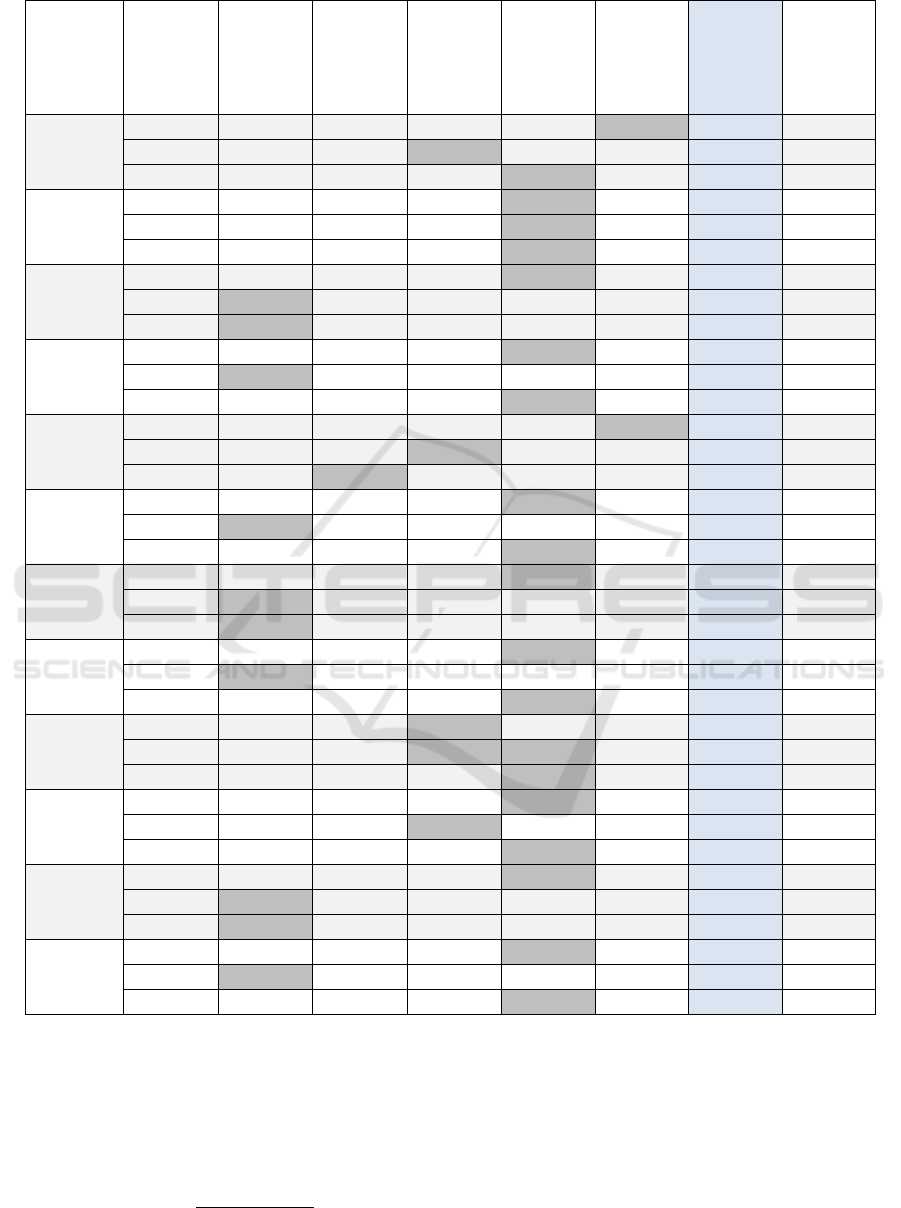
Table 4: Results, in terms of accuracies, for all experiments.
Classifier
No-
Clustering
HC
k-Means
Cascade
k-Means
EM
Canopy
Increase
over no
clustering
Dataset
kNN
68.842 93.103 88.177 92.857 89.409 93.350 24.51 RC
67.118 85.927 85.250 88.227 86.739 81.867 21.11 FCR-1
69.824 86.739 87.415 85.115 87.551 79.567 17.73 FCR-2
HT
57.020 88.916 73.153 89.163
98.522 70.074 41.50 RC
58.999 87.280 86.468 87.821 88.498 76.725 29.50 FCR-1
59.946 84.844 86.468 81.461 90.122 81.461 30.18 FCR-2
DT
72.044 91.995 93.966 95.197 99.138 95.074 27.09 RC
71.583 96.752 96.346 96.482 91.746 90.934 25.17 FCR-1
73.342 96.346 92.287 94.723 91.340 89.445 23.00 FCR-2
NB
74.507 92.241 90.517 92.488
99.138 91.010 24.63 RC
58.999 89.039 86.604 87.821 88.498 79.838 30.04 FCR-1
59.946 84.168 86.468 81.461 90.122 81.461 30.18 FCR-2
Bagging-
kNN
70.443 92.980 88.547 93.596 90.394 94.212 23.77 RC
68.742 86.739 86.198 89.175 87.280 82.138 20.43 FCR-1
70.230 87.415 88.227 86.062 87.415 79.838 17.19 FCR-2
Bagging-
HT
60.468 90.394 77.094 90.517 98.276 73.153 37.81 RC
58.457 89.445 86.198 88.498 88.633 78.620 30.99 FCR-1
58.863 84.980 86.062 81.597 90.663 76.996 31.80 FCR-2
Bagging-
DT
72.537 92.488 94.212 96.305 99.384 96.059 26.85 RC
56.969 98.106 96.346 97.700 92.964 90.798 41.14 FCR-1
57.916 96.752 94.587 95.129 92.558 91.204 38.84 FCR-2
Bagging-
NB
74.507 92.118 90.025 91.995 98.892 91.379 24.39 RC
58.999 89.310 86.198 88.363 88.633 79.161 30.31 FCR-1
58.999 84.980 86.062 81.191 90.663 80.514 31.66 FCR-2
Boosting-
kNN
68.842 93.103 88.177 93.227 88.424 92.365 24.39 RC
67.118 83.356 87.010 87.686 87.686 79.432 20.57 FCR-1
69.824 84.844 84.980 84.844 86.062 79.567 16.24 FCR-2
Boosting-
HT
60.222 88.916 77.463 89.409 98.522 70.074 38.30 RC
58.999 88.633 90.934 92.828 92.016 82.544 33.83 FCR-1
59.946 88.227 88.769 87.010 94.181 84.168 34.24 FCR-2
Boosting-
DT
70.813 92.611 92.611 96.305 99.015 96.675 28.20 RC
54.533 97.835 96.076 97.158 95.535 94.858 43.30 FCR-1
51.556 96.482 94.723 95.535 95.535 90.798 44.93 FCR-2
Boosting-
NB
65.025 89.286 91.133 93.966 98.153 91.379 33.13 RC
60.352 94.723 92.964 93.911 91.746 85.521 34.37 FCR-1
60.758 87.821 91.069 89.987 93.099 83.762 32.34 FCR-2
retrieved items by the used method to the total
number of recommendations (Katarya and Verma,
2016, Han et al., 2011b). In our paper, we employ
the F-score to combine the recall and the precision
into one holistic measure (Witten et al., 2011).
= 2 ∗
∗
(1)
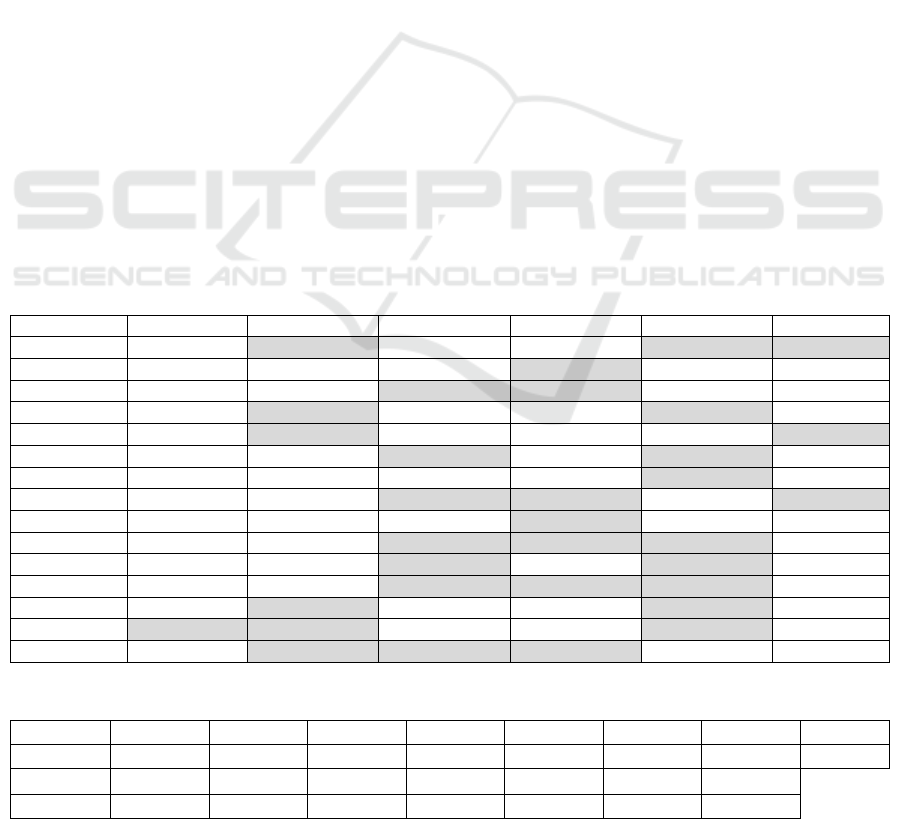
The results, as shown in Table 5, confirm our
earlier discussions, in that it clearly shows the
benefits of cluster analysis prior to classification.
Also, the table highlights the highest F-score values
for the (clustering, classification) pairs using the
EM, hierarchical, and cascade k-means clustering
algorithms.
KDIR 2018 - 10th International Conference on Knowledge Discovery and Information Retrieval
88

Table 5: F-score results for all experiments.
Classifier
No-
Clustering
HC
kMeans
Cascade
EM
Canopy
Increase
over no
clustering
Dataset
kNN
0.689 0.931 0.882 0.930 0.897 0.933 0.24 RC
0.680 0.955 0.920 0.949 0.885 0.930 0.28 FCR-1
0.000 0.980 0.961 0.966 0.868 0.927 0.98 FCR-2
HT
0.585 0.892 0.735 0.898
0.985 0.719 0.40 RC
0.606 0.951 0.947 0.966 0.935 0.856 0.36 FCR-1
0.617 0.848 0.698 0.890 0.890 0.696 0.27 FCR-2
DT
0.732 0.919 0.940 0.952 0.991 0.951 0.26 RC
0.725 0.988 0.976 0.971 0.947 0.950 0.26 FCR-1
0.749 0.976 0.927 0.951 0.900 0.857 0.23 FCR-2
NB
0.747 0.922 0.905 0.925
0.991 0.910 0.24 RC
0.606 0.868 0.796 0.852 0.914 0.757 0.31 FCR-1
0.617 0.840 0.822 0.821 0.890 0.740 0.27 FCR-2
Bagging-kNN
0.712 0.934 0.889 0.938 0.906 0.943 0.23 RC
0.685 0.981 0.961 0.974 0.868 0.925 0.30 FCR-1
0.712 0.850 0.834 0.824 0.855 0.757 0.14 FCR-2
Bagging-HT
0.614 0.904 0.768 0.906
0.984 0.739 0.37 RC
0.601 0.900 0.957 0.965 0.966 0.861 0.37 FCR-1
0.617 0.844 0.796 0.793 0.887 0.739 0.27 FCR-2
Bagging-DT
0.741 0.926 0.945 0.963 0.990 0.956 0.25 RC
0.569 0.921 0.978 0.978 0.958 0.955 0.41 FCR-1
0.571 0.976 0.936 0.947 0.917 0.881 0.41 FCR-2
Bagging-NB
0.745 0.925 0.910 0.921
0.990 0.913 0.25 RC
0.595 0.871 0.799 0.849 0.916 0.754 0.32 FCR-1
0.613 0.844 0.815 0.823 0.887 0.742 0.27 FCR-2
Boosting-kNN
0.689 0.931 0.881 0.932 0.885 0.924 0.24 RC
0.000 0.972 0.960 0.965 0.868 0.931 0.97 FCR-1
0.000 0.821 0.797 0.783 0.832 0.746 0.83 FCR-2
Boosting-HT
0.602 0.892 0.773 0.894
0.985 0.704 0.38 RC
0.606 0.963 0.954 0.973 0.960 0.874 0.37 FCR-1
0.617 0.875 0.731 0.710 0.906 0.750 0.29 FCR-2
Boosting-DT
0.709 0.926 0.926 0.963 0.990 0.967 0.28 RC
0.546 0.992 0.978 0.984 0.970 0.969 0.45 FCR-1
0.517 0.977 0.923 0.934 0.935 0.881 0.46 FCR-2
Boosting-NB
0.652 0.893 0.911 0.940
0.982 0.914 0.33 RC
0.619 0.972 0.860 0.926 0.966 0.904 0.35 FCR-1
0.633 0.902 0.902 0.892 0.887 0.797 0.27 FCR-2
5.2 Predicting User Responses
In this section, we consider the RC dataset to
determine whether cluster analysis yields highly
accurate recommendations to current users. That is,
we explore the impact on the recommendation
accuracy for existing users using 15 customers who
were randomly selected from our test set. Here, our
aim is to study whether we are able to accurately
predict the ratings of existing customers, given that
the number of items is high, while the number of
ratings is low (data sparsity).
The number of ratings available for each user is
shown in Table 7. The reader should notice that the
Beyond k-NN: Combining Cluster Analysis and Classification for Recommender Systems
89
number of ratings by individuals are between 11
(0.95%) and 18 (1.55%), while the total number of
ratings in the dataset is 1,161.
We report the accuracies for individual user
recommendations in Table 6. Recall that in this
experiment we are studying the impact of clustering
the dataset on the performance of k-NN in
recommendation systems. Our results confirm that
cluster analysis substantially improves the accuracy
for existing user predictions. Indeed, in 14 cases out
of the 15 (93.3%), one or more algorithm was able
to obtain a perfect score against the test cases. Also,
it alleviates the negative effects associated with data
sparsity that are prevailing in the RC dataset. In
addition, the table shows that cluster analysis
algorithms yield comparable results, with EM
having the highest accuracy 66.7% of the time. EM
allows for soft membership and does not assume an
equal shape and size for the clusters. Indeed,
customer recommendations and profiles are typically
skewed, which implies that the EM method is highly
suitable for such a scenario.
6 CONCLUSIONS AND FUTURE
WORK
This paper introduced the HCC-Learn multi-strategy
framework, which combines multiple cluster
analysis and classification algorithms for
recommendation systems. Classification techniques,
and notably the k-NN method, have been employed
in many recommendation systems to improve their
prediction accuracy. However, these techniques face
the challenge of labelling and data sparsity. The
HCC-Learn framework addresses these challenges.
Our results indicate that the combination of cluster
analysis and classification benefits the learning
process, leading to accurate results. Further, our
HCC-Learn framework is able to improve the
prediction accuracy for existing users substantially,
when compared to the no clustering scenario.
In future work, we plan to explore the
appropriateness of cluster analysis algorithms for
recommendation systems further. Specifically, we
propose to extend our framework by including
additional clustering analysis algorithms. For
instance, the use of subspace-based methods, such as
bi-clustering approaches, shall be investigated when
the number of dimensions is high. We shall also
extend our work to the streaming context, where
users’ preferences may change over time as a result
of concept drift.
Table 6: Accuracy of the various clustering algorithms for the restaurant-consumer dataset.
No clustering HC k-Means Cascade EM Canopy
U1003 69.23 100.00 92.31 92.31 100.00 100.00
U1014 54.55 90.91 90.91 100.00 90.91 90.91
U1036 66.67 91.67 100.00 100.00 91.67 91.67
U1057 54.55 100.00 90.91 81.82 100.00 81.82
U1061 77.78 100.00 94.44 72.22 88.89 100.00
U1081 63.64 90.91 100.00 90.91 100.00 100.00
U1089 92.86 92.86 92.86 92.86 100.00 85.71
U1096 72.73 90.91 100.00 100.00 90.91 100.00
U1104 58.33 91.67 75.00 100.00 91.67 91.67
U1106 61.11 88.89 94.44 94.44 94.44 77.78
U1112 76.92 92.31 100.00 92.31 100.00 84.62
U1114 81.82 90.91 100.00 100.00 100.00 90.91
U1122 66.67 100.00 75.00 58.33 100.00 83.33
U1128 100.00 100.00 90.91 90.91 100.00 90.91
U1137 71.43 100.00 100.00 100.00 92.86 64.29
Table 7: Number of historic records available for the sample users in the Restaurant-Consumer dataset.
User ID U1003 U1014 U1036 U1057 U1061 U1081 U1089 U1096
#records
13 11 12 11 18 11 14 11
User ID
U1104 U1106 U1112 U1114 U1122 U1128 U1137
#records
12 18 13 11 12 11 14
KDIR 2018 - 10th International Conference on Knowledge Discovery and Information Retrieval
90

REFERENCES
Acosta, O.C., Behar, P.A. and Reategui, E.B., 2014,
October. Content recommendation in an inquiry-based
learning environment. In 2014 IEEE Frontiers in
Education Conference (FIE) (pp. 1-6). IEEE.
Alabdulrahman, R., Viktor, H. and Paquet, E., 2016,
November. An Active Learning Approach for
Ensemble-based Data Stream Mining. In Proceedings
of the International Joint Conference on Knowledge
Discovery, Knowledge Engineering and Knowledge
Management (pp. 275-282). SCITEPRESS-Science
and Technology Publications, Lda.
Bifet, A. and Kirkby, R., 2009. Data stream mining a
practical approach.
Caliński, T. and Harabasz, J., 1974. A dendrite method for
cluster analysis. Communications in Statistics-theory
and Methods, 3(1), pp.1-27.
Elahi, M., Ricci, F. and Rubens, N., 2013. Active learning
strategies for rating elicitation in collaborative
filtering: A system-wide perspective. ACM
Transactions on Intelligent Systems and Technology
(TIST), 5(1), p.13.
Frank, E., Hall, M.A. and Witten, I.H., 2016. The WEKA
workbench. Data mining: Practical machine learning
tools and techniques, 4.
Guo, G., Zhang, J. and Thalmann, D., 2012, July. A
simple but effective method to incorporate trusted
neighbors in recommender systems. In International
Conference on User Modeling, Adaptation, and
Personalization (pp. 114-125). Springer, Berlin,
Heidelberg.
Han, J., Pei, J. and Kamber, M., 2011. Data mining:
concepts and techniques. Elsevier.
Kanagal, B., Ahmed, A., Pandey, S., Josifovski, V., Yuan,
J. and Garcia-Pueyo, L., 2012. Supercharging
recommender systems using taxonomies for learning
user purchase behavior. Proceedings of the VLDB
Endowment, 5(10), pp.956-967.
Katarya, R. and Verma, O.P., 2016. A collaborative
recommender system enhanced with particle swarm
optimization technique. Multimedia Tools and
Applications, 75(15), pp.9225-9239.
Li, X., Cong, G., Li, X.L., Pham, T.A.N. and
Krishnaswamy, S., 2015, August. Rank-geofm: A
ranking based geographical factorization method for
point of interest recommendation. In Proceedings of
the 38th International ACM SIGIR Conference on
Research and Development in Information
Retrieval (pp. 433-442). ACM.
Lian, D., Zhao, C., Xie, X., Sun, G., Chen, E. and Rui, Y.,
2014, August. GeoMF: joint geographical modeling
and matrix factorization for point-of-interest
recommendation. In Proceedings of the 20th ACM
SIGKDD international conference on Knowledge
discovery and data mining (pp. 831-840). ACM.
Liao, C.L. and Lee, S.J., 2016. A clustering based
approach to improving the efficiency of collaborative
filtering recommendation. Electronic Commerce
Research and Applications, 18, pp.1-9.
Minkov, E., Charrow, B., Ledlie, J., Teller, S. and
Jaakkola, T., 2010, October. Collaborative future
event recommendation. In Proceedings of the 19th
ACM international conference on Information and
knowledge management (pp. 819-828). ACM.
Mishra, R., Kumar, P. and Bhasker, B., 2015. A web
recommendation system considering sequential
information. Decision Support Systems, 75, pp.1-10.
Mythili, S. and Madhiya, E., 2014. An analysis on
clustering algorithms in data mining. Journal
IJCSMC, 3(1), pp.334-340.
Natural Resources Canada 2017. Fuel Consumption
Rating. In: Canada, O. G. L. (ed.).
Nikolaenko, V., Ioannidis, S., Weinsberg, U., Joye, M.,
Taft, N. and Boneh, D., 2013, November. Privacy-
preserving matrix factorization. In Proceedings of the
2013 ACM SIGSAC conference on Computer &
communications security (pp. 801-812). ACM.
Pande, S.R., Sambare, S.S. and Thakre, V.M., 2012. Data
clustering using data mining techniques. International
Journal of advanced research in computer and
communication engineering, 1(8), pp.494-9.
Vargas-Govea, B., González-Serna, G. and Ponce-
Medellın, R., 2011. Effects of relevant contextual
features in the performance of a restaurant
recommender system. ACM RecSys, 11(592), p.56.
Saha, T., Rangwala, H. and Domeniconi, C., 2015, June.
Predicting preference tags to improve item
recommendation. In Proceedings of the 2015 SIAM
International Conference on Data Mining (pp. 864-
872). Society for Industrial and Applied Mathematics.
Sridevi, M., Rao, R.R. and Rao, M.V., 2016. A survey on
recommender system. International Journal of
Computer Science and Information Security, 14(5),
p.265.
Su, X. and Khoshgoftaar, T.M., 2009. A survey of
collaborative filtering techniques. Advances in
artificial intelligence, 2009.
Wang, H., Wang, N. and Yeung, D.Y., 2015, August.
Collaborative deep learning for recommender systems.
In Proceedings of the 21th ACM SIGKDD
International Conference on Knowledge Discovery
and Data Mining (pp. 1235-1244). ACM.
Wei, K., Huang, J. and Fu, S., 2007, June. A survey of e-
commerce recommender systems. In Service systems
and service management, 2007 international
conference on (pp. 1-5). IEEE.
Witten, I.H., Frank, E., Hall, M.A. and Pal, C.J.,
2016. Data Mining: Practical machine learning tools
and techniques. Morgan Kaufmann.
Zhang, Y. and Li, T., 2012. Dclustere: A framework for
evaluating and understanding document clustering
using visualization. ACM Transactions on Intelligent
Systems and Technology (TIST), 3(2), p.24.
Beyond k-NN: Combining Cluster Analysis and Classification for Recommender Systems
91
