
Defining Dynamic Indicators for Social Network Analysis: A Case
Study in the Automotive Domain using Twitter
Indira Lázara Lanza Cruz and Rafael Berlanga Llavori
Llenguatges I Sistemes Informatics, Universitat Jaume I, Castellón, Spain
Keywords: Social Business Intelligence, Indicators, Data Streaming.
Abstract: In this paper we present a framework based on Linked Open Data Infrastructures to perform analysis tasks in
social networks based on dynamically defined indicators. Based on the typical stages of business intelligence
models, which starts from the definition of strategic goals to define relevant indicators (Key Performance
Indicators), we propose a new scenario where the sources of information are the social networks. The
fundamental contribution of this work is to provide a framework for easily specifying and monitoring social
indicators based on the measures offered by the APIs of the most important social networks. The main novelty
of this method is that all the involved data and information is represented and stored as Linked Data. In this
work we demonstrate the benefits of using linked open data, especially for processing and publishing
company-specific social metrics and indicators.
1 INTRODUCTION
The main objective of Business Intelligence (BI) is to
extract strategic knowledge from the information
provided by performance indicators. This knowledge
is the basis for facilitating the decision-making
process and improving performance in the
organization. A performance indicator is used to
assess the degree of achievement of an organization's
objectives (e.g., to increase revenue), as well as to
measure expected results within a business process
(e.g., number of products sold). Strategic indicators
are calculated from measures of interest collected
from various sources and integrated into a
multidimensional scheme. The measures are often of
a corporate nature (sales, costs, customers, etc.), are
generated within the same company and have a well-
defined structure. However, today, much of the
strategic information relevant to an organization
resides in external sources, mainly in social networks
(Zhou et al., 2015) (Fan and Gordon, 2014).
Unfortunately, there are few studies that establish the
most appropriate external indicators for each domain
and the way to calculate them from the data offered
by social networks.
Today, traditional BI processes related to decision
making are affected by trends in social media, the
latter providing immediate user feedback on products
and services. In turn, new types of businesses have
proliferated in digital media, newspapers, blogs, as
well as digital marketing departments, whose market
value is determined by user interaction, influence and
impact on social media; their growth cannot be
measured using traditional performance indicators.
From the BI point of view, social data can also be
treated as a multidimensional model that can be
linked to corporate data to aid decision making. In
this area, we can define a social indicator as a time
metric that allows an organization to dynamically
measure the impact of its activities on social networks
and the Web. The challenge lies in defining good
social indicators from a large volume of unstructured
data from social networks.
Given the interest in analyzing social networks to
improve business processes, many commercial tools
have proliferated for the analysis and monitoring of
metrics and indicators in social networks, mainly
offering statistical summaries of the metrics offered
by the APIs of the most popular social networks.
Most of these tools are limited to very specific
contexts and dimensions, and do not allow a true
integration with corporate BI systems. Some research
focuses on modelling solutions to very specific
problems such as the analysis of feelings, clustering
of events, user classification and identification of
marketing campaigns on Twitter. Currently, the
analysis of social networks is reaching a sufficient
Lanza Cruz, I. and Berlanga Llavori, R.
Defining Dynamic Indicators for Social Network Analysis: A Case Study in the Automotive Domain using Twitter.
DOI: 10.5220/0006932902210228
In Proceedings of the 10th International Joint Conference on Knowledge Discovery, Knowledge Engineering and Knowledge Management (IC3K 2018) - Volume 1: KDIR, pages 221-228
ISBN: 978-989-758-330-8
Copyright © 2018 by SCITEPRESS – Science and Technology Publications, Lda. All rights reserved
221

degree of maturity to be approached from a more
methodological point of view.
In this paper we present a framework for the
definition, capture and monitoring of social indicators
based on the multidimensional model. The main
objective is to provide a framework to facilitate the
analysis of the semi-structured data offered in
streaming by APIs services of various social networks
(e.g. Twitter), and then summarize them as social
indicators that respond to specific organization goals.
The rest of the article is structured as follows. In
Section 2 we review the work related to solutions for
social analysis, define the context of the research and
the requirements that our proposal must meet. Section
3 defines the analytical patterns to be taken into
account to develop a system oriented BI analysis.
Section 4 presents the framework for defining and
monitoring social indicators. Section 5 describes the
characteristics and ways of evaluating a social
indicator. Section 6 presents a case study to validate
the proposal. Finally, we conclude the article in
Section 7.
2 CONTEXT AND
REQUIREMENTS
Our approach integrates a broad spectrum of research
problems that have been addressed independently in
the literature or that solve very specific problems. In
the revised literature we identified four main research
approaches that allowed us to group the related work
together: "Social analysis for BI", "Streaming text
processing", "Modelling performance indicators" and
"Collaborative networks for maintaining
performance indicators". These works are discussed
in Section 2.1. Then in Section 2.2, we briefly present
the background of our proposal and the new
requirements for defining dynamic indicators for
social network analysis.
2.1 Related Work
Social Analysis for BI. Despite the great commercial
interest in creating analytical techniques for social
networking, there are few approaches in the literature
that address the issue within the area of BI. Some
pioneering work has recently been reviewed in
(Berlanga and Nebot, 2015), and basically they
establish a correlation between external entities (such
as news or opinions) and internal entities (the facts to
be analysed). Other work has focused on creating
multidimensional models for the analysis of opinions
expressed in social networks about a product or
company (Berlanga et al., 2015) (García-Moya,
2016). Many approaches in the area directly create
ad-hoc processes that measure some kind of indicator
on a given topic in a social network, mainly
topological (Wang et al., 2013), product (Yan et al.,
2015) (Chae, 2015), or feeling (polarity) (Dai et
al.,2015) (He et al., 2015).
Streaming Text Processing. In (Feng et al., 2015)
and (Liu et al., 2013) authors propose a similar
approach as ours. They model and process streams of
texts extracted from Twitter in the form of a
multidimensional cube with the “TextCube” and
“StreamCube” frameworks respectively. The former
presents an algorithm for the detection, clustering and
ranking of events through Twitter hashtags. These
events are stored in a stream cube and the dimensions
are limited to location and time. The second article is
a study of human behaviour based on the analysis of
feelings by geo-localization. In both reviews the data
is stored on disk, requiring large amounts of storage
resources to maintain the large volume of data
generated by social networks. Moreover, indicators
are restricted to a small set of predefined dimensions
and metrics.
Modelling Performance Indicators. In the area of
formalization and evaluation of performance
indicators in a company, (Barone et al., 2011)
includes a series of techniques and algorithms to
derive composite indicators based on the Business
Intelligence Model. On the other hand (Popova and
Sharpanskykh, 2011) proposes a formal framework
for the modelling goals based on performance
indicators and defined mechanisms to establish the
fulfilment of objectives, allowing the evaluation of
organizational performance. Both approaches make it
easier to derive indicators, to discover the
relationships between them and to know clearly what
they allow for evaluation.
Collaborative Networks for Maintaining
Performance Indicators. Nowadays, the creation of
collaborative networks are key factors in achieving
sustainable competitive advantages for companies.
Semantic technologies are a powerful tool to provide
a common layer for information exchange. In this
sense (Diamantini et al., 2016) establishes a semantic
framework for the formal definition and collaborative
maintenance of a dictionary of performance
indicators. A similar approach (Maté et al., 2017),
propose an infrastructure for automatic derivation of
KDIR 2018 - 10th International Conference on Knowledge Discovery and Information Retrieval
222

company indicators, setting up a common framework
between business analysts and developers that links
business strategies and data analysis. The above
proposals focus on the formal definition of indicators
and highlight the importance of keeping them linked
to business objectives. These solutions are a reference
framework for the formalization of indicators in a
company, but for Social BI it is necessary to manage
data of a different nature (unstructured, volatile and
fast) from external sources (unlike the historical
measurements stored in DW). As a result, techniques
for deriving performance indicators cannot be applied
directly to social indicators because they are dynamic,
volatile and less predictable in their behaviour.
2.2 Background and Requirements of
the Proposal
In this paper, we consider as social information all
collective information produced by customers and
consumers in a marketplace when participating in
online social activities. We will also refer to data
extracted from social information by analysis tools,
such as sentiment data or opinion facts. The amount
of data extracted is massive so social forums can be
considered as Big Data.
A previous work to this research is the SLOD-BI
infrastructure (Berlanga et al., 2015). SLOD-BI
provides mechanisms and tools to collect, store and
analyze social metrics based on data published by
social networks users. From a scientific and technical
point of view, the project proposes the combination
of cognitive models with statistical language models,
large open knowledge resources and
multidimensional analytical models to define
efficient methods of extraction and analysis of social
information. This infrastructure follows the principles
of the Linked Open Data (LOD) initiative.
In this paper we propose to extend the SLOD-BI
infrastructure with new modules for the definition of
dynamic indicators for social analysis. The new
requirements are the following ones:
1. Definition of a dictionary of social indicators
correlated to the objectives of the business to
be modelled.
2. Due to the dynamic nature of the data, the
solution must allow the definition and updating
of multidimensional structures for the analysis
context.
3. Construction of a real-time data cube from
linked semantic data and defined dimensions.
The modelling of social measures in form of
cubes allows the calculation and exploration of
indicators on different dimensions.
4. The cube will keep only current information
contained within given time windows. The
information generated in social networks is
constantly changing in function of new topics
and trends that arise and disappear very
quickly, so the most valuable social data that
must be kept are the most current.
5. When an indicator is defined or updated, a new
cube of social measures will be generated for it
and its population will start from zero.
3 ANALYTICAL PATTERNS FOR
SOCIAL BI
The main BI patterns identified for conducting the
social analysis are summarized in Figure 1 (Berlanga
et al., 2015). The links represent the relationship
between the social data and the corporate data. The
analysis patterns on the corporate data side
correspond to the traditional models of a typical DW.
While the patterns represented alongside the social
data represent the multidimensional structures for
social analysis. Facts are labelled with "F",
dimensions with "D" and their levels "L". Facts
directly involved in Social BI are: Opinion, Post and
Social Facts.
Figure 1: SLOD-BI Analysis Patterns.
Opinion Facts are observations based on types of
feelings (e.g. positive or negative) expressed by users
concerning specific facets (e.g. design) of an item of
interest (e.g. a car brand). Post Facts are observations
on the data of a particular post (e.g. reviewer, item
reviewed, date reviewed), which may be related to a
series of Opinion facts. Social Facts provide relevant
information about users and their opinions in the
context of the community to which they belong
(Berlanga et al., 2015). The large volume of data
generated around these patterns makes it difficult to
interpret them in a timely manner, so it is necessary
to define accurate aggregate mechanisms with
different granularity in terms of space and time, as
Defining Dynamic Indicators for Social Network Analysis: A Case Study in the Automotive Domain using Twitter
223
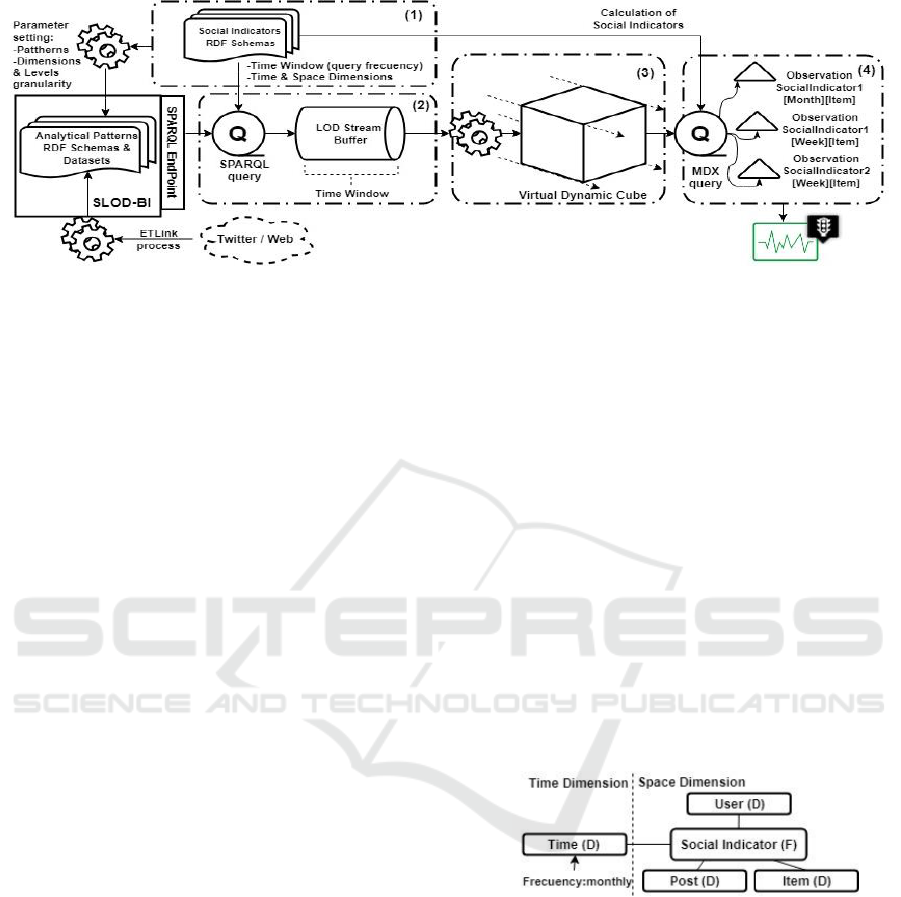
Figure 2: New Framework based on SLOD-BI infrastructure.
well as indicators to consolidate them into useful
information. For this purpose we introduce a new
high-level pattern: the social indicator, whose values
will be dynamically derived from measures of the
social patterns described above.
One of the main objectives of the infrastructure is
to facilitate data integration by defining data bridges
between corporate elements and social data (shown in
the figure as dashed lines). Data bridges represent the
process that allow to perform analysis operations that
combine corporate and social data.
4 PROPOSED FRAMEWORK
The objective of the proposed framework is to allow
the definition and derivation of social indicators for
the analysis of social networks in streaming. The aim
is to load the value of each social indicator into the
strategic business model in order to help in the
decision-making process. A social indicator is a new
data pattern that is part of a layer that is above the
SLOD-BI data infrastructure. Seen from top to down,
the definition of a social indicator determines which
data will be captured from social networks and how
often they will be collected.
The proposed framework is summarized in Figure
2. It extends the previous SLOD-BI infrastructure
with four new modules, namely: specification of the
social indicators and dimensions of analysis (1),
querying linked data patterns (2), construction of the
Virtual Dynamic Cube (VDC) (3) and estimation of
the social indicators facts (4).
Specification of Social Indicators and Dimensions.
Key Performance Indicators (KPI) are typically
expressed in technical terms using languages like
MDX (MultiDimensional eXpressions) or SQL. As
most social data in SLOD-BI are expressed as RDF
(Resource Description Framework) triplets, we use
OWL for describing social indicators formulas and
dimensions. A social indicator is defined primarily by
its name, formula and dimensions of analysis. The
formula of a social indicator can be composed of
social metrics and/or other indicators. It is also
necessary to establish the periodicity of data
collection. In Section 5 we present the semantics and
rules for modeling social indicators.
In the model we define two main categories of
dimensions: "Space Dimension" and "Time
Dimension". The Space dimensions represent the
context of the social data retrieved, e.g. domain, topic,
item, user, location, and so on. The granularity of the
time dimension will be determined by the frequency
with which the different observations must be
collected. Figure 3 shows the different dimensions
characterizing a social indicator, which can be
organized in hierarchies of analysis.
Figure 3: Analysis Dimensions.
Querying Linked Data Patterns. The SLOD-BI
infrastructure must be parameterized with the metrics
and dimensions (associated with each indicator) to be
extracted from the social network. Social data will be
captured during an ETLink process (Extraction,
Transformation and publication of data in LOD). The
SLOD-BI data service layer allows us to query the
datasets through a SPAQRL endpoint. For each
defined social indicator, a continuous query is
defined, specifying its metrics, dimensions and time
window (query periodicity). The result of the process
is a stream buffer of linked facts for each social
KDIR 2018 - 10th International Conference on Knowledge Discovery and Information Retrieval
224

indicator, which comprises the last date range
associated with its time window.
Optionally, this output can be semantically
enriched by adding new attributes extracted from the
data itself. For example, using NLP techniques we can
classify the texts of post facts in spam or not spam.
VDC Construction. Streamed linked social data will
be transformed into a new multidimensional scheme
that we call VDC inspired by the traditional OLAP data
cube. Unlike traditional DWs where facts and measu-
res are historically stored on disk, in our proposal the
dimensional structures will be modelled "virtually"
(they do not exist physically nor they are stored on
disk, they are generated and processed on the fly). The
"virtualized" data will materialize from the stream in
the appropriate buffer and will have a temporary
character. Measures or events must be generated
periodically and their availability will be determined
by the specified time window (e.g. last month) or by a
number of previous observations (e.g. last 10 observa-
tions). To transform linked data into a multidimen-
sional model there are several methods in the literature
that can be applied (Nebot and Berlanga, 2016).
Dynamically generated data can be connected to
external systems, such as: Exploration Tools,
Predictive Models, Corporate DW or a Decision
Support System.
Social Indicators and Facts Estimation. The
numerical value of an indicator corresponds to an
observation determined by the dimensions of the
indicator and the observation date. The process of
calculating a social indicator begins with an MDX
query for the selection and aggregation of measures
from the dynamic cube, and ends with the evaluation
of its formula. Resulting values can be displayed in
real time on a dashboard or a balanced scorecard.
Optionally observations can be stored in a
datawarehouse for historical analysis.
The indicators will exhibit a dynamic behaviour
since their multidimensional structures may vary over
time (e.g., adding or eliminating dimensions or
measures). In this case, resulting observations could
have different dimensional structures that must be
taken into account when storing them.
5 MODELLING AND DERIVING
SOCIAL INDICATORS
Similar to a KPI, a social indicator is defined by a
mathematical expression or a specific value. Its basic
properties are: name, definition, measuring objective,
calculation periodicity, associated dimensions, unit of
measurement, aggregate function, weight
(importance), threshold, best and worst expected
value. These last three properties will allow us to
create visual alerts about the observations.
In this Section we propose an ontology to model
social indicators. This extension corresponds to a
high-level ontology within the SLOD-BI data
schema. Figure 4 shows the main classes of the social
indicators ontology. Table 1 shows the main OWL
properties of the more general class
"SocialIndicator". Letter “C” indicates the cardinality
of the property.
Figure 4: Class hierarchy for social indicators.
Table 1: Main properties of the SocialIndicator class.
Class
C
Property
Range
Social
Indicator
>0
hasDimension
Item, User, Post
=1
hasTime
Time
=1
hasAggFunction
Sum,Avg,Max
A social indicator can be composite or atomic
depending on the way it is calculated. In our model
the atomic indicators are those that do not need a
formula to be calculated, as their values are directly
obtained from facts of SLOD-BI (e.g. number of post
likes). On the other hand, the calculation of a
composite indicator will depend on other predefined
indicators.
It is important to clearly differentiate between two
types of indicators that we often find in BI and we
formalize in this study: absolute and relative
indicators.
An “Absolute” indicator represents a numerical
amount collected at a given time. This type of
indicator can be either atomic or compound. An
“Atomic” indicator represents a concrete measure
directly obtained from the social network (e.g.
number likes). On the other hand, a
“AbsoluteComposite” indicator can be expressed as a
mathematical expression whose arguments
correspond to other “Absolute” indicators, either
atomic or compound. The component indicators must
have the same dimensional structures. Table 2 shows
the properties and ranges that define the classes
derived from the “Absolute” indicators.
Defining Dynamic Indicators for Social Network Analysis: A Case Study in the Automotive Domain using Twitter
225

Table 2: Main properties of Absolute Indicators Classes.
Class
C
Property
Range
Absolute
Atomic
=1
hasMetric
SocialMetric
Absolute
Composite
=1
hasBinary
Operator
Binary
Operator
Binary
Operator
=1
hasMath
Operator
Plus, Minus,
Product
=1
hasArgument1
hasArgument2
Absolute
Indicator
Relative indicators are composite indicators whose
values correspond to a ratio between two absolute
indicators separated either in time or space. In case of
space-related indicators, their calculation consists of
a proportion (division). “Time Related” indicators
imply a subtraction operation. Table 3 shows the main
properties of the “Relative Indicator” class.
Table 3: Main properties of Relative Indicators Classes.
Class
C
Property
Range
Relative
Indicator
=1
hasBinary
Operator
BinaryOperator
Binary
Operator
=1
hasMathOp
Minus, Division
=1
hasArgument1
hasArgument2
AbsoluteIndicator
The class “SpaceRelated” is differentiated by the
constraint: given two absolute indicators involved in
the formula, the analysis dimension "A" of the first
indicator must be a subset of the analysis dimension
"B" of the second indicator (A B).
The class “TimeRelated” is defined by the
following constraint: given two absolute indicators
involved in the formula, the time dimension “T1” of
the first indicator must be disjoint from the time
dimension “T2” of the second indicator (T1 ≠ T2) and
in turn must be structurally equivalent.
As examples, definitions 1 and 2 represent the
social indicators Likes and Interactions respectively,
while Figure 5 shows the properties of the
Engagement indicator.
Likes≡ hasMetric.LikeMetric ∩
hasDimension.Item ∩
hasAggregationFunction.SUM
(1)
Interactions≡ hasBinaryOperator.(
hasMathOperator.SUM ∩
hasArgument1.Likes ∩
hasArgument2.Retweets)
(2)
In the previous formulas we assume that all
restrictions are functional (= 1).
Figure 5: Example of Engagement social indicator.
6 EXPERIMENTAL STUDY
With the purpose of validating the proposed
framework to derive dynamic indicators, we have
developed a prototype to address a use case in the car
domain.
6.1 Case Study: Social Analysis in the
Car Domain
The fundamental objective of any car rental company
is to provide its customers with quality services and
achieve effective sales. In addition to the traditional
analytical queries that involve corporate data, there is
a need to have a deeper insight of the business
marketing processes in real time in order to react
more efficiently. For a successful analytical
experience, the company must specify the most
important domains of analysis with the items
(products or services) to be monitored.
In the context of the use case, the goal is to study
the popularity of different car brands by tracking the
“user’s Engagement" in a given period.
6.2 Implementation of a Prototype
To populate the VDCs with real data we use a dataset
of 2,625.186 tweets crawled using Twitter's
streaming API from November 2014 to February
2017.
The developed workflow is based on the model
explained in Section 4. The social indicators defined
are: Engagement, Interactions (described in Section
5) and onDomain tweets (number of posts about the
car brand). The metrics and dimensions that define
each indicator are the input parameters for the SLOD-
BI infrastructure to populate its datasets.
Once SLOD-BI is configured for the car rental
domain, the sentiment data can be consumed via the
data service layer to produce the required data. Table
4 shows the workflow of the implemented process,
the operators involved and their corresponding
input/output data.
KDIR 2018 - 10th International Conference on Knowledge Discovery and Information Retrieval
226
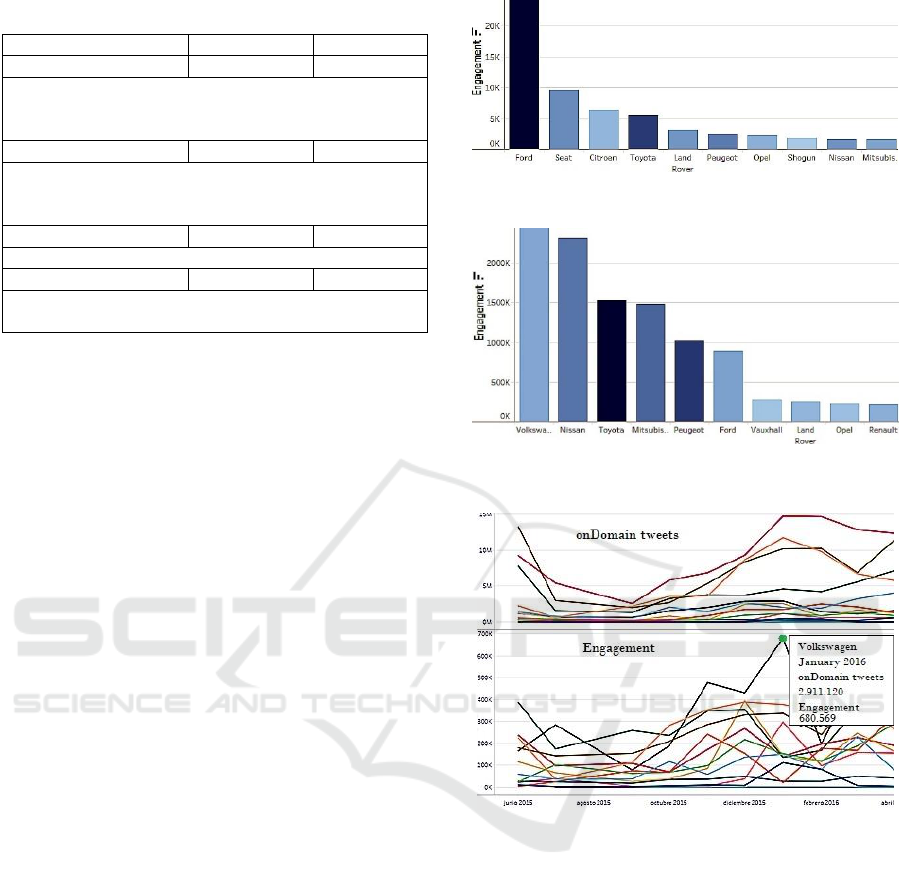
Table 4: Proposed workflow and operator types.
Operator Type
Input
Output
QuerySparql
Sparql query
RDFStream
Continuously extracts the union/intersection of RDF
social data bounded by the dimensions and time window
of the social indicator.
DataEnrichment
RDFStream
RDFStream
Optionally, predictive models can be applied to the output
data (e.g. determine whether or not a post is spam) and the
RDF can be enriched with new predicates.
VDC construction
RDFStream
MDXStream
VDC construction from streamed linked data.
IndicatorCalculation
QueryMDX
Value
Evaluates the mathematical operations in the MDX query.
The query frequency is determined by indicator.
In our simulation, the indicator facts table was saved
in a CSV file for viewing it in the Tableau tool.
6.3 Visualization and Analysis
Below are a series of examples of interesting
analytical queries to monitor the interest that the
company arouses in the social network users.
The analyst wants to check if a Twitter marketing
campaign was effective. For this purpose, it is
necessary to analyze the response of users in the
corresponding period through the defined social
indicators. Figures 6 and 7 show the values of the
Engagement indicator for different cars brands for the
whole period. The first one shows the result for all
users of the dataset (spammers included), while the
second one shows only the values for non-spammers
users in which we check a more linear result. For this
segmentation we use the entire dataset for train a
Spam classifier with a Linear SVM. The classifier
was implemented in Python with the Anaconda
framework (Pandas and Scikit-Learn packages).
After applying the Spam Classifier, the number of
events is reduced by around 40%.
The analyst wants to check the impact on
Volkswagen car rentals, after the controversy
generated when the Environmental Protection
Agency revealed in September 2015 that the
manufacturer had manipulated the emissions
detection software.
Figure 8 shows the result of the onDomain tweets
and Engagement indicators for different brands of
interest during the period of dispute. The graph shows
clearly the high impact of Volkswagen brand posts.
Figure 6: Engagement indicator with all users included.
Figure 7: Engagement indicator without spammer’s users.
Figure 8: Engagement and onDomain tweets indicators.
7 CONCLUSIONS
In this article, a novel approach has been presented
for the definition and monitoring of social indicators
on the linked and open data infrastructure called
SLOD-BI. The proposal offers the possibility of
exploring the measures captured from social
networks interactively over different
multidimensional contexts and in real time.
We propose a framework that makes use of the
principles of LOD data to define and publish as
semantic data the definitions of social indicators. On
the other hand, the indicator measurements are
calculated on the fly from a linked social data stream
modelled like an OLAP cube, but keeping only the
Defining Dynamic Indicators for Social Network Analysis: A Case Study in the Automotive Domain using Twitter
227

most recent information. It is important to highlight
the dynamism of the cube as it supports the
continuous inclusion of new measures and
dimensions.
Among the main benefits of this framework is the
fact that the indicators are directly linked to the social
measures, so that it is possible to easily identify the
origin of the values of these indicators. On the other
hand, the fact that the indicators are also semantic
data, makes it possible to apply validation techniques
during their definition and derivation.
As future work will be studied the automatic
creation of descriptions and queries associated with
the calculation of social indicators, as well as the
discovery of appropriate metrics to evaluate strategic
objectives of the organization. Due to the dynamism
of the cubes, the volume and fluctuating character of
the data, makes it impracticable to store historical
data, so it is necessary to establish the appropriate
mechanisms to find the right time window to apply
predictive algorithms and compare measurement
trends.
ACKNOWLEDGEMENTS
This work has been financed by the Ministry of
Economy and Trade with the project of the National
R&D Plan with contract number TIN2017-88805-R.
We also have the support of the Universitat Jaume I
pre-doctoral scholarship programme
(PREDOC/2017/28).
REFERENCES
Barone, D., Jiang, L., Amyot, D. and Mylopoulos, J., 2011.
Composite Indicators for Business Intelligence.
Conference on Conceptual Modeling ER 2011. Lecture
Notes in Computer Science, 6998, pp. 448–458.
Berlanga, R. and Nebot, V., 2015. Context-Aware Business
Intelligence. Business Intelligence. Lecture Notes in
Business Information Processing, 253, pp. 87-110.
Berlanga, R., García-Moya, L., Nebot, V., Aramburu, M.,
Sanz, I. and Llidó, D., 2015. SLOD-BI: An Open Data
Infrastructure for Enabling Social Business
Intelligence. International Journal on Data
Warehousing and Data Mining, 11(4), pp. 1-28.
Chae, B. K., 2015. Insights from hashtag# supplychain and
Twitter analytics: Considering Twitter and Twitter data
for supply chain practice and research. International
Journal of Production Economics, 165, pp. 247-259.
Dai, W., Han, D., Dai, Y. and Xu, D., 2015. Emotion
recognition and affective computing on vocal social
media. Information & Management, 52(7), pp. 777-
788.
Diamantini, C., Potena, D. and Storti, E., 2016. SemPI: A
semantic framework for the collaborative construction
and maintenance of a shared dictionary of performance
indicators. Future Generation Comp. Syst., 54, pp. 352-
365.
Fan, W. and Gordon, M. D., 2014. The Power of Social
Media Analytics. Communications of the ACM, 57(6),
pp. 74-81.
Feng, W., Zhang, C., Zhang, W., Han, J., Wang, J.,
Aggarwal, C. and Huang, J., 2015. STREAMCUBE:
Hierarchical spatio-temporal hashtag clustering for
event exploration over the Twitter stream. IEEE 31st
International Conference on Data Engineering, pp.
1561-1572.
García-Moya, L., 2016. Modeling and analyzing opinions
from customer reviews. Tesis Doctoral, Departamento
de Lenguajes y Sistemas Informáticos, Universitat
Jaume I, Castellón.
He, W., Wu, H., Yan, G., Akula, V. and Shen, J., 2015. A
novel social media competitive analytics framework
with sentiment benchmarks. Information &
Management, 52(7), pp. 801-812.
Liu, X., Tang, K., Hancock, J., Han, J., Song, M., Xu, R.,
and Pokorny, B., 2013. A Text Cube Approach to
Human, Social and Cultural Behavior in the Twitter
Stream. International Conference on Social
Computing, Behavioral-Cultural Modeling and
Prediction, pp. 321-330.
Maté, A., Trujillo, J. and Mylopoulosb, J., 2017.
Specification and derivation of key performance
indicators for business analytics: A semantic approach.
Data & Knowledge Engineering journal, pp. 30–49.
Nebot, V. and Berlanga, R., 2016. Statistically-driven
generation of multidimensional analytical schemas
from linked data. Knowledge-Based Systems, 110, pp.
15-29.
Popova, V. and Sharpanskykh, A., 2011. Formal modelling
of organisational goals based on performance
indicators. Data & Knowledge Engineering, 70(4), pp.
335-364.
Wang, G. A., Jiao, J., Abrahams, A. S., Fan, W. and Zhang,
Z., 2013. ExpertRank: A topic-aware expert finding
algorithm for online knowledge communities. Decision
Support Systems, 54(3), pp. 1442-1451.
Yan, Z., Xing, M., Zhang, D. and Ma, B., 2015. EXPRS:
An extended pagerank method for product feature
extraction from online consumer reviews. Information
& Management, 52(7), pp. 850-858.
Zhou, M., Lei, L., Wang, J., Fan, W. and Wang, A. G.,
2015. Social Media Adoption and Corporate
Disclosure. Journal of Information Systems, 29(2), pp.
23-50.
KDIR 2018 - 10th International Conference on Knowledge Discovery and Information Retrieval
228
