
Theatrical Genre Prediction using Social Network Metrics
Manisha Shukla
1
, Susan Gauch
1
and Lawrence Evalyn
2
1
Department of Computer Science and Engineering, University of Arkansas, Fayetteville, AR, U.S.A.
2
Department of English, University of Toronto, Toronto, ON, Canada
Keywords: Social Networks, Genre Prediction, Relationship Mining, Social Network Analysis, Network Theory.
Abstract: With the emergence of digitization, large text corpora are now available online which provide humanities
scholars an opportunity to perform literary analysis leveraging the use of computational techniques. Almost
no work has been done to study the ability of mathematical properties of network graphs to predict literary
features. In this paper, we apply network theory concepts in the field of literature to explore correlations
between the mathematical properties of the social networks of plays and the plays’ dramatic genre. Our goal
is to find metrics which can distinguish between theatrical genres without needing to consider the specific
vocabulary of the play. We generated character interaction networks of 36 Shakespeare plays and tried to
differentiate plays based on social network features captured by the character network of each play. We were
able to successfully predict the genre of Shakespeare’s plays with the help of social network metrics and hence
establish that differences of dramatic genre are successfully captured by the local and global social network
metrics of the plays. Since the technique is highly extensible, future work can be applied larger groups of
plays, including plays written by different authors, from different periods, or even in different languages.
1 INTRODUCTION
In literary studies, the three key areas of research
could be defined as philology (the study of words),
bibliography (the study of books as objects), and
criticism (the evaluation or interpretation of literary
meaning). Our paper presents a distant reading
method which may aid in the task of literary criticism,
using network graph analysis on social networks
generated from the scripts of plays.
Particularly since the advent of New Criticism,
“the basic task of literary scholarship has been close
reading of texts” (Moretti, 2011), which builds textual
interpretations from the precise study of specific
words. Computational approaches to literature offer
an alternate methodology for the work of literary
study without close reading. “Distant reading”
(Moretti, 2011) takes many forms, including
statistical topic models (Jockers and Mimno, 2013),
character profiling (Flekova and Gurevych, 2015),
character frequency analysis (Sack, 2011), and
sentiment analysis (Elsner, 2015), as mentioned in
Grayson et al. (2016). For computational methods to
produce new literary insights, they must provide
information about literary texts which is not easily
accessible by reading them and must do so for more
texts than it is feasible for a person to read. The social
networks we examine are implicit in the texts, and
thus difficult to access through simple reading, and
our technique can easily be applied to more texts than
a person may read, allowing our method to contribute
novel insights to literary analysis.
Social network analysis is well-established to
study social groups. Some scholars have applied
social network analysis to literary works for e.g. plot
analysis (Grayson et al., 2016), or for discovering
character communities (Watts, 2001), wherein nodes
represent characters, and edges represent interaction
between pairs of characters for plot analysis. Because
these graphs are handmade for a very small number
of plays, however, almost no work has been done to
study the ability of mathematical properties of
network graphs to predict literary features at scale.
We address this gap by exploring correlations
between the mathematical properties of networks and
dramatic genre. We are particularly interested to see
which measures are the most effective predictors, to
form the basis of literary analysis of the role of social
relationships in plays.
In this paper, we study the social networks of
Shakepeare’s plays to establish a correlation between
social network metrics and genre identification. We
Shukla, M., Gauch, S. and Evalyn, L.
Theatrical Genre Prediction using Social Network Metrics.
DOI: 10.5220/0006935002290236
In Proceedings of the 10th International Joint Conference on Knowledge Discovery, Knowledge Engineering and Knowledge Management (IC3K 2018) - Volume 1: KDIR, pages 229-236
ISBN: 978-989-758-330-8
Copyright © 2018 by SCITEPRESS – Science and Technology Publications, Lda. All rights reserved
229

distinguish between the three Early Modern theatrical
genres of tragedy, comedy, and history, following the
identifications provided in the first collection of
Shakespeare’s works, the First Folio. Using our
generated character networks of Shakespeare’s plays,
we found that combinations of some of the global and
local network metrics (Watts, 2001) were indeed able
to distinguish plays belonging to different genres.
This work has been used for literary analysis of the
ambiguous genre of Shakepeare’s “problem plays”
(Evalyn, et al., 2018).
2 RELATED WORK
2.1 Social Network Analysis
A social network graph is a set of vertices and edges
(called a sociogram) where vertices represent social
actors and edges represent social relations among the
vertices. However, a social network is more than just
a set of vertices and lines, as its structure contains
implicit information about the social actors and their
relationships. The graph representation of a social
network offers a systematic and mathematical method
for investigating these structures. Social network
analysis is the process of investigating social network
structures and ties through the use of network and
graph theory concepts.
As Billah and Gauch (2015, p. 4) observe, “Social
network analysis (SNA) is not a formal theory, but
rather a wide strategy for investigating social structu-
res”. These strategies borrow core concepts from
sociometry, group dynamics, and graph theory (Watts,
2001; Scott, 2000; Wasserman and Faust, 1994).
In social network analysis of human activities, the
nodes can be connected by many kinds of ties, such
as “shared values, visions, and ideas; social contacts;
kinship; conflict; financial exchanges; trade; joint
membership in organizations; and group participation
in events, among numerous other aspects of human
relationships” (Serrat, 2017). However, regardless of
the nature of the connection, “the defining feature of
social network analysis is its focus on the structure of
relationships” (Serrat, 2017). The central assumption
in SNA methodologies is that relationships between
nodes are of central importance (Serrat, 2017).
Social network analysis has been used in a wide
variety of fields, with applications as diverse as
disintegration models based on social network
analysis of terrorist organizations (Anggraini et al.,
2015), collaboration of scholars in graduate education
(Chuan-yi, et al., 2016), football team performance
based on social network analysis of relationships
between football players (Trequattrini, et al., 2015),
money laundering detection (Dreżewski, et al., 2015),
and stress disorder symptoms and correlations in U.S.
military veterans (Armour et al. 2017). In this paper
we explore the applications of social networks in
literary analysis. Specifically, we look for social
network metrics that can identify genre without
relying on the specific language of the play, which
will enable future extension to groups of plays in
different languages.
2.2 Literary Analysis with SNA
Because dramatic performances enact social
encounters, social network analysis translates
surprisingly well to fictional societies. Stiller et al.
have shown that the social networks in Shakespeare’s
plays mirror those of real human interactions,
particularly in size, clustering, and maximum degrees
of separation (Stiller, et al., 2003).
Surveying the field of literary analysis using SNA,
Moretti categorizes several types of analyses: “an
empirical, quantitative and hierarchical description of
literary characters (Jannidis et al., 2016), corpus-
based analyses exploring options for historical
periodisation of literature (Trilcke et al., 2015) and
types of aesthetic modelling of social formations in
and by literary texts (Stiller, et al., 2003; Stiller and
Hudson, 2005; Trilcke et al, 2016).” Moretti himself
uses social networks to examine the plots of three
Shakespearean tragedies, and to contrast a few
chapters of English and Chinese novels (Moretti,
2011). Work following Moretti has focused on
historical periodization, as in Algee-Hewitt’s
examination of 3,439 plays looking only at the Gini
Coefficient of each play’s eigenvector centrality to
track ensemble casts from 1500 to 1920 (Algee-
Hewitt, 2017).
Our project focuses on a novel application, the
classification of literary genre. When scaled up to a
corpus covering a wider historical time span, our
approach to genre could also provide insight on the
historic periodization of literature.
Moretti also identifies that, in the application of
SNA to literature, “methods for the automated
extraction of network data (named entity recognition,
co-reference resolution) and their evaluation are of
particular importance,” (Moretti, 2011), which we
accomplish in this paper.
2.3 Gephi Toolkit
Gephi is an open source software for graph and
network analysis, which allows for fast visualization
KDIR 2018 - 10th International Conference on Knowledge Discovery and Information Retrieval
230
and manipulation of large networks. As a generalist
tool, “it provides easy and broad access to network
data and allows for spatializing, filtering, navigating,
manipulating and clustering” (Bastian, Heymann and
Jacomy, 2009). Gephi also calculates a wide range of
mathematical features for each graph, which we use
as the basis for our mathematical analysis (as
discussed in more detail in 3.3).
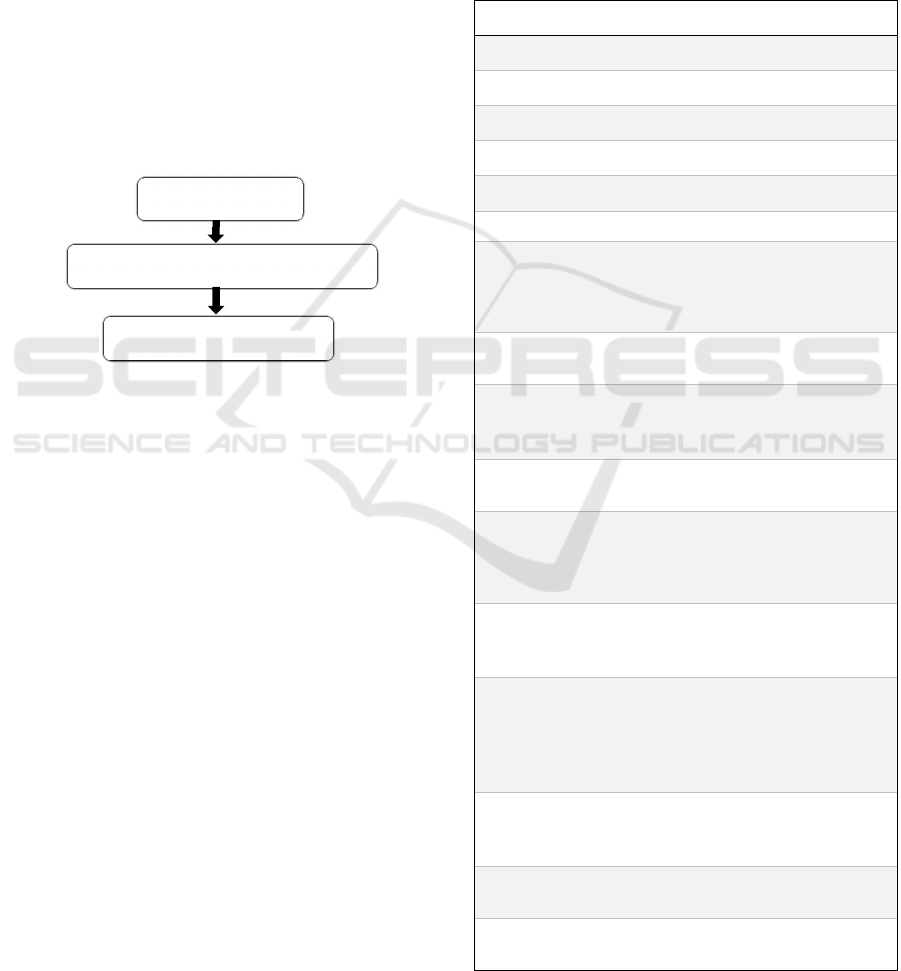
3 OUR DESIGN
Our system for identifying genre consists of three
building blocks: the Play Parser, the Social Network
Generator and the Genre Predictor. Figure 1 shows
the main components of the system architecture,
which are discussed in more detail in the following
subsections.
Figure 1: Block diagram of our system.
3.1 Play Parser
The main purpose of this component is to
automatically parse TEI encoded XML format play to
extract basic information such as the total number of
characters, the name and role of each character, and
the total number of acts and scenes in a play. For each
scene, we used our parsed information to determine
which characters were present in the scene (using
stage directions to
account for entrances and exits
during a scene), and how many lines and words were
spoken by each character. We also extracted some
“Play Features” (shown in Table 1) which were
incorporated into our analysis.
3.2 Social Network Metric Calculator
This component creates each play’s social network
graph using the information generated by the play
parser described in 3.1 and then calculates its network
features. We used the Gephi API to generate graph
files. Each file maps characters as node and
communication between characters as an edge. Each
character stores as an attribute total number of lines
and words spoken by that character in the play. After
this mapping, each edge is weighted with the sum of
total number of words
spoken by the two characters
in their shared scenes. Once the basic structure is
ready, using inbuilt functions of Gephi
API we
calculate 16
metrics of graph and node features.
These are the “Networks Features” of our extracted
features, as shown in Table 1.
Table 1: All Extracted Features from Shakespeare’s plays.
Here g represents a play graph, c a character node in a
graph, and e an edge in graph.
Play Features
1. tot_characters = total number of characters in g
2. tot_edges = total number of edges in g
3. tot_lines = total number of lines spoken by c in g
4. tot_words = total number of words spoken by c in g
Network Features
5. Degree = set of adjacent nodes of c in the graph
6. Criticality = A k-critical graph is a critical graph
with chromatic number k; a graph G with chromatic
number k is k-vertex-critical if each of its vertices is a
critical element.
7. Eigenvector = A measure of c’s importance in a
network based on c’s connections.
8. Eccentricity = The eccentricity of a node c in a
connected graph is the maximum graph distance
between it and any other node.
9. Closeness Centrality = The average distance from a
given node c to all other nodes in the network.
10. Harmonic Centrality = In a (not necessarily
connected) graph, the harmonic centrality reverses the
sum and reciprocal operations in the definition of
closeness centrality.
11. Betweeness Centrality = Node Betweenness
Centrality measures how often a node appears on
shortest paths between nodes in the network.
12. Clustering Coefficient = The clustering coefficient,
when applied to a single node, is a measure of how
complete the neighborhood of a node is. When applied
to an entire network, it is the average clustering
coefficient over all nodes in the network.
13. Density = Measures how close the network is to
complete. A complete graph has all possible edges and
density equal to 1.
14. Diameter = The maximal distance between all pairs
of nodes.
15. Path Length = The average graph-distance between
all pairs of nodes.
Social Network Metric Calculator
Genre Predictor
Pla
y
Parse
r
Theatrical Genre Prediction using Social Network Metrics
231

Table 1: All Extracted Features from Shakespeare’s plays.
Here g represents a play graph, c a character node in a
graph, and e an edge in graph (cont.).
Network Features
16. Connected Components: A connected component is
a maximal set of nodes such that each pair of nodes is
connected by a path.
17. Modularity = Measures how well a network
decomposes into modular communities.
18. Weighted Degree = for node c, the sum of the
weights of its edges.
19. Average Degree = for graph g, the sum of the
degrees of all the nodes in the graph divided by the
total number of nodes in the graph.
20. Average Weighted Degree = For graph g, the sum
of the weighted degrees of all the nodes in the graph
divided by the total number of nodes in the graph.
21. Radius = The radius of a graph is the minimum
graph eccentricity of any node in the graph.
3.2.1 Extracted Features
As extracted features, we chose to use most simple
and easily quantifiable metrics, such as the total
number of characters in the play (see Table 1). As our
results in 4.3.1 and 4.3.3 demonstrate, despite their
simplicity as features, the number of edges and the
number of words spoken in a play can play a crucial
role in identifying the genre.
3.2.2 Network Features
We compute the network features of the graph using
the Gephi library. For features that describe an
individual node, such as degree or eigenvector, we
calculated the network centralized value using the
following network level centralization index
(Newman, 2010):
=
∑
[
∗
]
∑
[
∗
]
(1)
Where,
c
*
= maximum value for all the nodes in the graph and
c
i
= value of current node.
Denominator is the maximum of the summation over
all the possible networks. This method normalizes
across the graphs, allowing us to use node metrics as
graph metrics for evaluation purposes.
3.3 Genre Predictor
The genre predictor is a support vector machine binary
classifier. Support Vector Machines (SVMs) are a
popular machine learning method for classification,
regression, and other learning tasks. Since our
classification problem had more than two classes, we
combined SVM with One vs One (OvO) classification.
This works as follows: choose a pair of classes from a
set of n classes, which in our case is three (comedy,
history and tragedy) and develop a binary classifier for
each pair. Create all possible combinations of pairs of
classes from n and then for each pair develop a binary
SVM. The final class is assigned to each unseen play
based on the class chosen by maximum number of
binary SVM classifiers. By using OvO, our SVM is
much less sensitive to the problems of unbalanced
datasets, which is particularly helpful given the
different sizes of each of our three classes and our small
overall sample size (Chang and Lin, 2011).
4 EXPERIMENTS
4.1 Dataset
Our dataset is comprised of 36 plays by Shakespeare,
in TEI encoded XML files. XML format was chosen
as it was much easier to fetch required information
from the plays along with maintaining accuracy in the
extraction. The dataset is that of the WordHoard
Shakespeare, downloaded from the website
showcases.exist-db.org. It consists of comedies (All’s
Well That Ends Well, As You Like It, A Midsummer
Night’s Dream, Love’s Labour’s Lost, Measure for
Measure, Much Ado About Nothing, The Comedy of
Errors, The Merchant of Venice, The Merry Wives of
Windsor, The Taming of the Shrew, The Tempest,
The Winter’s Tale, Twelfth Night or What You Will,
Two Gentlemen of Verona), histories (The First Part
of King Henry the Fourth¸ The First Part of King
Henry the Sixth, The Life and Death of King John,
The Life of King Henry the Eighth, The Life of King
Henry the Fifth, The Second Part of King Henry the
Fourth¸ The Second Part of King Henry the Sixth¸
The Third Part of King Henry the Sixth¸ The Tragedy
of King Richard the Second, The Tragedy of King
Richard the Third) and tragedies (Antony and
Cleopatra, Coriolanus, Cymbeline, Hamlet Prince of
Denmark, Julius Caesar, King Lear, Macbeth¸
Othello the Moor of Venice, Romeo and Juliet,
Timon of Athens, Titus Andronicus, Troilus and
Cressida).We split the dataset into five subsets,
evenly balancing each genre in each subset. These
were then used to perform five-fold cross validation.
KDIR 2018 - 10th International Conference on Knowledge Discovery and Information Retrieval
232

4.2 Experimental Setup
Our generated network graphs are then used to test our
central question: whether the social network of
characters in a play can be used as a proxy for features
of the play’s narrative content. Can we use social
network metrics to distinguish between the dramatic
genres of tragedy, comedy, and history? We used 21
different mathematical features as mentioned in Table
1 to test our hypothesis. We first tested how well
individual features were able to distinguish between
different genres. Our second test considered of all
combinations of pairs of extracted and network
features, and the third test used combinations of three,
four and five feature sets to see if adding on more
features would increase accuracy of classifier’s genre
prediction. Section 4.3 discusses the result of each test.
4.3 Results
The following table shows the calculated average
value for each network metric per genre.
Table 2: Average feature value for each genre.
Features Comedy History Tragedy
Characters 23.14 44 38.333
Edges 132 233 217.75
Words 22426.42 27238.2 27050.58
Lines 2586.5 3070.2 3215
Criticality 0.03 0.022 0.020
Eigenvector 0.34 0.59 0.52
Eccentricity 8.63 19.11 13.01
Closeness 9.28 27.42 24.95
Harmonic 0.19 0.31 0.29
Betweenness 0.01 0.010 0.011
Clustering
Coefficient
0.84 0.82 0.83
Graph Density 0.52 0.25 0.34
Diameter 2.85 4.3 3.08
Path Length 1.516 2.02 1.71
Connected
Components
1.07 1.7 1.5
Degree 0.37 0.46 0.52
Modularity 0.14 0.25 0.16
Weighted Degree 1306.85 1022.02 1457.85
Average Degree 11.31 10.39 11.38
Average Weighted
Degree
11353.31 7349.09 9136.53
Radius 1.78 1.3 1.33
4.3.1 Single Feature Accuracy
Our first test attempted to identify genre using only
single feature at a time. However, no single feature
was independently sufficient to identify the genre. Of
the features tested, path length provided the greatest
accuracy (66.43%) for genre identification. Even
though this metric does not achieve 100%, it is much
better than random, which would be 33.3%.
Table 3: Genre prediction accuracy using a single feature.
Feature Accuracy
Path Length 66.43
Graph Density 61.07
Diameter 58.57
Characters 55.71
Eigenvector 55.71
Eccentricity 55.71
Harmonic 55.71
Average Weighted Degree 55.71
Lines 55.36
Degree 55.36
Closeness 52.50
Connected Components 50.35
Modularity 50.00
Words 47.50
Edges 47.14
Radius 47.14
Weighted Degree 44.28
Criticality 41.43
Clustering Coefficient 38.93
Average Degree 33.21
Betweenness 27.85
4.3.2 Pair of Features Accuracy
However, when features were used in pairs, the
network graphs achieved greater accuracy in
identifying the genre of Shakespeare plays. Table 4
shows the pairs of metrics which were able to identify
genre with accuracy higher than the maximum
individual feature accuracy for genre prediction.
Theatrical Genre Prediction using Social Network Metrics
233
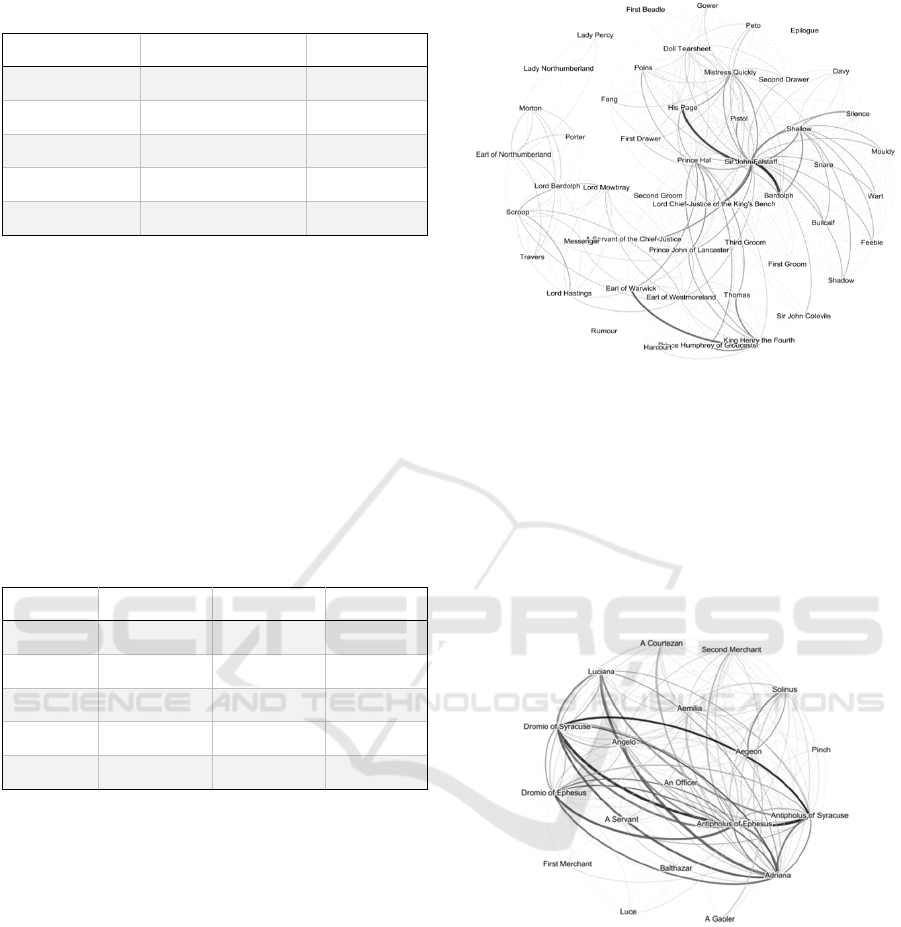
Table 4: Pairs which provided above 70% accuracy.
Feature 1 Feature 2 Accuracy
Harmonic Diameter 72.50
Harmonic Path Length 72.50
Graph Density Diameter 72.50
Graph Density Path Length 72.50
Lines Path Length 72.14
4.3.3 Multiple Features Accuracy
If we combine three features, the network graphs
again achieve 10% higher accuracy in genre
identification. Table 5 shows the triads which were
able to identify genre with more than 80% accuracy.
Adding additional features continued to increase
accuracy. The highest observed accuracy was
88.93%, using five metrics that are a combination of
play characteristics (Words and Lines) and SNA
features (Closeness, Graph Density, and Average
Weighted Degree).
Table 5: Triples which provided above 80% accuracy.
Feature 1 Feature 2 Feature 3 Accuracy
Words Characters Lines 83.57
Words Lines Eigenvector 83.21
Words Lines Closeness 81.07
Lines Eigenvector Path Length 80.71
Lines Harmonic Path Length 80.71
4.3.4 Discussion
The relevance of path length and graph density in
distinguishing genres is visually obvious when
individual comedy and history networks are
compared.
Our networks reveal that histories feature highly
dispersed networks, with large numbers of very minor
characters, such as “First,” “Second,” and “Third”
members of groups like soldiers and ambassadors
(Figure 2). Characters in histories form social
subgroups, joined through chains of acquaintance.
Comedies, in contrast, feature networks with far
fewer characters, in which nearly everybody speaks
to nearly everybody else at some point (Figure 3).
These basic findings offer novel support for literary
research on Early Modern histories and comedies
(Evalyn, Gauch and Shukla, 2018).
Figure 2: Network graph of The Second Part of King Henry
The Fourth, a history.
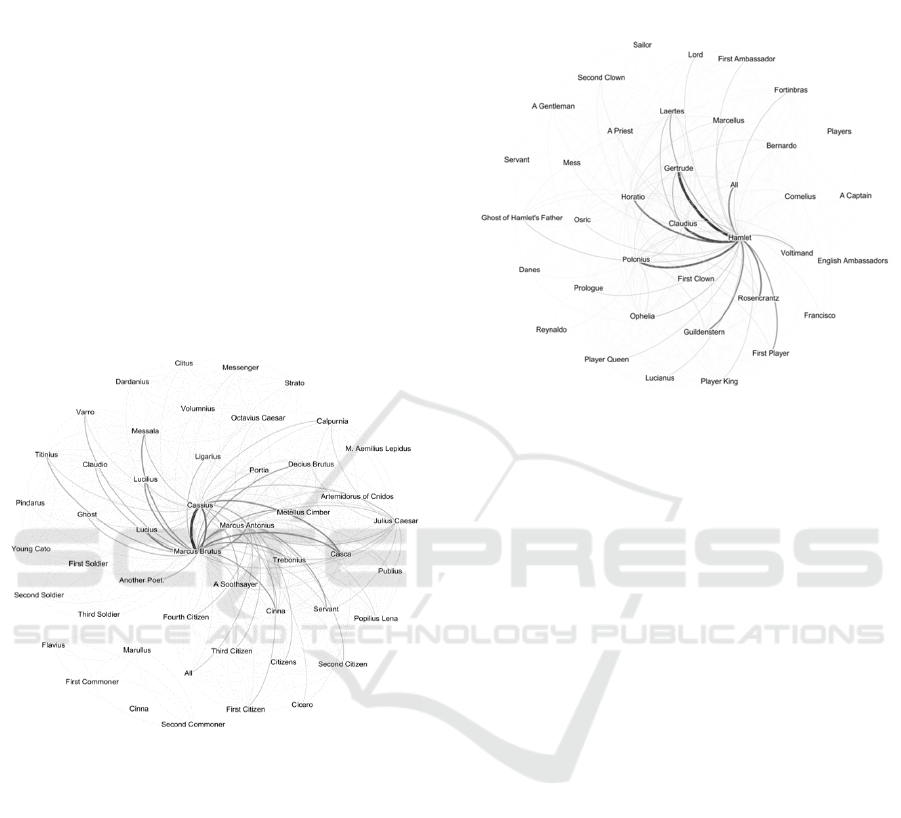
Tragedies are more difficult to distinguish. It is of
interest to literary scholars to discover that tragedies
appear not to have a formula for their social
relationships. They feature networks somewhere
between history and comedy in their density and
show more variety overall (Figures 4 and 5).
Therefore, more complex metrics are needed in
combination to accurately identify all three genres.
Figure 3: Network graph of The Comedy of Errors, a
comedy.
A comparison of Table 4 and Table 5 shows that
the sets of three factors which provide higher
accuracy do not necessarily always include the
features which were able to provide better accuracy
as pairs. Many of the pairs, for example, include
graph density or path length as one of the two
identifying features, but none of the triples include
graph density as a feature for maximizing the
accuracy, and the triples instead include the number
of words and lines as the most commonly useful
feature.
KDIR 2018 - 10th International Conference on Knowledge Discovery and Information Retrieval
234
Each metric thus seems to capture a specific kind
of information about the play which are more relevant
in combination with different other metrics.
Closeness, for example, is only able to provide 52.5%
accuracy alone, but reaches 88.9% when combined
with lines, words, graph density and average
weighted degree. Similarly, the harmonic centrality
only provides 55.7% accuracy alone, but when
considered alongside pairs of other features, the
combination is more informative.
Specifically, it seems that classification is most
successful when metrics of the play’s size (words,
characters, lines) are combined with metrics of the
interconnectedness of its social network (density,
path length, harmonic or closeness centrality,
eigenvector). The non-SNA features of play size are
insufficient to identify genre alone but provide useful
context for SNA metrics for classification.
Figure 4: Network graph of Julius Caesar, a tragedy.
5 CONCLUSIONS
In this paper, we successfully classify plays based on
their genre without using the actual words of the
plays. Our networks of the well-studied works of
Shakespeare can provide a baseline against which to
contextualize similar studies of other plays. The
network graphs themselves provide a new insight into
the plays, revealing the hidden shape of social
relationships between characters. The application of
mathematical graph analysis to these networks
provides a dramatically faster and more scalable way
to determine important information about them, in
this case their genre.
To apply these findings to literary research, we
have explored in more detail the genre attributions of
Shakespeare’s romances and problem plays (Evalyn,
Gauch and Shukla, 2018). We have also made the
network graphs and selected mathematical features
available online at text.csce.uark.edu/SNAPlays.html.
Figure 5: Network graph of Hamlet, a tragedy.
6 FUTURE WORK
Since the parser is highly extensible and can be used
with any plays encoded in TEI, future work applying
these methods to literary analysis does not need to be
restricted to plays that are similar to Shakespeare’s
but could be used to compare plays over a long period
of time. Future work doesn’t even need to be
restricted to plays written in English; one future
application in development, for example, will study
eighteenth century plays written in English, French,
and German. As we develop our website, we will add
functionality for others to upload their own TEI
encoded plays and download the resulting Gephi file,
enabling broad applicability of our methods to new
literary research problems.
Future refinements to the social network
generator could make edges between nodes
directional, to better capture imbalanced relationships
between characters; this level of detail was not
necessary to distinguish between Shakespeare’s
plays, but might be important for different
identification tasks. Natural Language Processing
(NLP) could also be integrated into the parser to more
accurately identify the targets of speech, to capture
instances where characters are on stage but cannot
hear what is being said or are not being spoken to.
These kinds of improvements would reduce “false
positives” in the creation of edges between nodes,
perhaps enabling better analysis of larger or more
complicated groups of literary plays.
Theatrical Genre Prediction using Social Network Metrics
235

REFERENCES
Algee-Hewitt, M. (2017). Distributed Character:
Quantitative Models of the English Stage, 1500-1920.
In Digital Humanities 2017: Book of Abstracts.
Montreal: McGill University and Université de
Montréal, pp. 119–21.
Anggraini, D., Madenda, S., Wibowo, E. P. and
Boumedjout, L. (2015). Network Disintegration in
Criminal Network. In 11th International Conference on
Signal-Image Technology & Internet-Based Systems
(SITIS), Bangkok, pp. 192-199.
Armour, C., Fried, E. I., Deserno, M. K., Tsai, J. and
Pietrzak, R. H. (2017). A network analysis of DSM-5
posttraumatic stress disorder symptoms and correlates
in U.S. military veterans. In Journal of Anxiety
Disorders, Volume 45, 2017, Pages 49-59.
Bastian, M., Heymann, S. and Jacomy, M. (2009). Gephi:
An Open Source Software for Exploring and
Manipulating Networks. In International AAAI
Conference on Web and Social Media, North America.
Billah, S. M. and Gauch. S. (2015). Social network analysis
for predicting emerging researchers. In 7th IC3K,
Lisbon.
Chang, C. C. and Lin, C. J. (2011). LIBSVM: A library for
support vector machines. ACM Trans. In Intell. Syst.
Technol. 2, 3, Article 27, 27 pages.
Chuan-yi, W., Xiao-hong, L. and Yi, C. (2016). An
empirical study on the collaboration of scholars in
graduate education: based on the social network
analysis. In ICIIP '16. ACM, New York, NY, USA,
Article 36, 7 pages.
Dreżewski, R., Sepielak, J. and Filipkowski, W. (2015).
The application of social network analysis algorithms
in a system supporting money laundering detection. In
Information Sciences, Volume 295, 2015, Pages 18-32,
ISSN 0020-0255.
Elsner, M. (2015). Abstract Representations of Plot
Struture. LiLT (Linguistic Issues in Language
Technology), 12(5).
Evalyn, L., Gauch S. and Shukla, M. (2018). Analyzing
Social Networks of XML Plays: Exploring
Shakespeare’s Genres. https://dh2018.adho.org/en/
analyzing-social-networks-of-xml-plays-exploring-
shakespeares-genres/.
Fischer, F., Göbel, M., Kampkaspar, D. and Trilcke, P.
(2015). Digital Network Analysis of Dramatic Texts. In
Digital Humanities 2015 Conference Abstracts.
University of Western Sydney.
Flekova and Gurevych, I. (2015). Personality Profiling of
Fictional Characters using Sense-Level Links between
Lexical Resources. In Proc. Conference on Empirical
Methods in Natural Language Processing, pages 1805–
1816.
Grayson, S., Wade, K., Meaney, G., Rothwell, J., Mulvany
M. and Greene, D. (2016). Discovering structure in
social networks of 19th century fiction. In Proceedings
of the 8th ACM Conference on Web Science. ACM, New
York, NY, USA, 325-326.
Jannidis, F., Reger, I., Krug, M., Weimer, L.,
Macharowsky, L. and Puppe, F. (2016). Comparison of
Methods for the Identification of Main Characters in
German Novels. In Digital Humanities Conference
Abstracts, Jagiellonian University & Pedagogical
University, Kraków, pp. 578–82.
Jockers, M. L. and Mimno, D. (2013). Significant themes
in 19th-century literature. In Poetics, 41(6):750–769.
Moretti, F. (2011). Network Theory, Plot Analysis. New
Left Review, 68:80–102.
Newman, M. E. J. (2010). Networks: An Introduction.
Oxford, UK: Oxford University Press.
Sack, G. (2011). Simulating plot: Towards a generative
model of narrative structure. In 2011 AAAI Fall
Symposium Series.
Scott, J. (2000). “Social Network Analysis: A Handbook”,
2
nd
ed., Sage Publications, London.
Serrat, O. (2017). Social network analysis. In Knowledge
solutions (pp. 39-43). Springer, Singapore.
Stiller, J. and Hudson, M. (2005). Weak Links and Scene
Cliques within the Small World of Shakespeare. In
Journal of Cultural and Evolutionary Psychology 3, pp.
57–73.
Stiller, J., Nettle, D. and Dunbar, R. I. M. (2003). The Small
World of Shakespeare's Plays. In Human Nature, 14(4):
397–408.
Trequattrini, R., Lombardi, R. and Battista, M. (2015).
Network analysis and football team performance: a first
application. In Team Performance Management: An
International Journal, Vol. 21 Issue: 1/2, pp.85-110.
Trilcke, P., Fischer, F., Göbel, M. and Kampkaspar, D.
(2015). In 200 Years of Literary Network Data.
Trilcke, P., Fischer, F., Göbel, M., Kampkaspar, D. and
Kittel, C. (2016). Theatre Plays as 'Small Worlds'
Network Data on the History and Typology of German
Drama, 1730–1930. In Digital Humanities 2016
Conference Abstracts. Jagiellonian University &
Pedagogical University, Kraków, pp. 385–87.
Wasserman, S. and Faust, K. (1994). “Social Network
Analysis: Methods and Applications”, Cambridge
University Press.
Watts, D. (2001). “Small Worlds: The Dynamics of
Networks between Order and Randomness”, Princeton
University Press.
KDIR 2018 - 10th International Conference on Knowledge Discovery and Information Retrieval
236
