
PrCP: Pre-recommendation Counter-Polarization
Mahsa Badami
1
, Olfa Nasraoui
1
and Patrick Shafto
2
1
Knowledge Discovery and Web Mining Lab, Computer Science and Computer Engineering Department,
University of Louisville, Louisville, KY, U.S.A.
2
Department of Mathematics and Computer Science, Rutgers University - Newark, Newark, NJ, U.S.A.
Keywords:
Recommender System, Polarization, Controversy, Big data, Algorithmic Bias.
Abstract:
Personalized recommender systems are commonly used to filter information in social media, and recommen-
dations are derived by training machine learning algorithms on these data. It is thus important to understand
how machine learning algorithms, especially recommender systems, behave in polarized environments. We
investigate how filtering and discovering information are affected by using recommender systems. We study
the phenomenon of polarization within the context of the users interactions with a space of items and how
this affects recommender systems. We then investigate the behavior of machine learning algorithms in such
environments. Finally we propose a new recommendation model based on Matrix Factorization for existing
collaborative filtering recommender systems in order to combating over-specialization in polarized environ-
ments toward counteracting polarization in human-generated data and machine learning algorithms.
1 INTRODUCTION
The growing popularity of Recommender Systems
(RS) to help filter data to the users, has led to a dyna-
mic interplay between the information that users can
discover and the algorithms that filter such informa-
tion (Badami et al., 2018; Sun et al., 2018). This
has given rise to several side effects, such as algo-
rithmic biases (Dandekar et al., 2013; Baeza-Yates,
2016), filter bubbles (Liao and Fu, 2014), and human-
algorithm iterated bias (Shafto and Nasraoui, 2016)
and polarization (Badami et al., 2017). Recent re-
search has studied different types of biases genera-
ted due to algorithms, including bias and fairness
in machine learning (Hardt et al., 2016; Fish et al.,
2016); as well as algorithmic bias(Hajian et al., 2016;
Lambrecht and Tucker, 2018), and assimilation bias
(Zhang et al., 2017). Polarization around controver-
sial issues have arguably affected recommender sys-
tems (and vice-versa) (Garimella et al., 2016b). An
effective and efficient recommender system should
be able to provide the most suitable recommenda-
tion method even in the presence of a set of polarized
items. When such issues emerge on social media, we
often observe the creation of echo chambers or “Filter
Bubbles”, where there is greater interaction between
like-minded people who reinforce each others opinion
(Garimella et al., 2016b). These individuals do not get
exposed to the views of the opposing side, and this in
turn exacerbates polarization (Dandekar et al., 2013).
Allowing users to discover different viewpoints could
allow them to develop unique tastes and diverse per-
spectives (Knijnenburg et al., 2016).
In order to give the users a choice to see more
items, we believe that a recommender system should
enables users to discover novel items whose discovery
may become hindered as a result of the users continu-
ous engagement with a system This is not necessa-
rily the same as recommending a random item by trial
and error or by diversifying the recommendation list,
to increase diversity and serendipity. It is important to
note that recommender systems that improve diversity
and serendipity are not the same as polarization aware
recommender systems. This is because the former ge-
nerally require diversity in the actual description or
nature of items, which in turn requires content data.
Our work primarily focuses on items that can cross
polarization boundaries, where polarization is based
on how users interact with the items (via ratings) and
not their content.
Research on polarization in recommender systems
has emerged rapidly, in recent years, as an important
interdisciplinary topic (Dandekar et al., 2013; Gari-
mella et al., 2016b; Mejova et al., 2014; Nasraoui
and Shafto, 2016; Abisheva et al., 2016; Matakos and
Tsaparas, 2016; Garimella et al., 2016a), with some
efforts trying to decrease online polarization (Gari-
mella et al., 2016b; Liao and Fu, 2014; Garimella et
282
Badami, M., Nasraoui, O. and Shafto, P.
PrCP: Pre-recommendation Counter-Polarization.
DOI: 10.5220/0006938702820289
In Proceedings of the 10th International Joint Conference on Knowledge Discovery, Knowledge Engineering and Knowledge Management (IC3K 2018) - Volume 1: KDIR, pages 282-289
ISBN: 978-989-758-330-8
Copyright © 2018 by SCITEPRESS – Science and Technology Publications, Lda. All rights reserved

(a) Φ
i
= 1 (b) Φ
i
= 0 (c) Φ
i
= 0 (d) Φ
i
= 0
(e) Φ
i
= 0
Figure 1: Polarization scores for different rating histograms.
al., 2016a; Badami et al., 2017) However, most cur-
rent work on polarization has either been limited to
simple problems (Dandekar et al., 2013), has relied
on textual content to detect sentiment and then po-
larization, or has been confined to specific domains
within the context of political (or other controversial
domain) news and blogs. In this paper, we are more
interested in studying the emergence and aggravation
of polarization as a result of using collaborative filte-
ring recommender systems.
Aiming toward alleviating the important problems
of over-specialization and concentration bias, especi-
ally in a polarized environment, we propose a new
approach to generating recommendation lists based
on a modified Non-Negative Matrix Factorization ap-
proach. We formulate theoretically-grounded scena-
rios for polarization which will allow a simulation-
based analysis of the emergence of polarization, as
well as designing new counter-polarization strategies
for recommender systems. Our proposed approach al-
ters only the input ratings based on the automatically
detected polarization of the items and the users pre-
specified tolerance for discovery. The proposed mo-
del aims to achieve a trade-off between accurate per-
sonalized recommendations and expanding the space
of items that can be discovered, hence escaping a fil-
ter bubble. Whether humans prefer to discover more
or less is beyond the scope of this paper. The propo-
sed pre-recommendation approach is useful for other
applications where a dataset should be either publis-
hed by an online recommender system provider or by
researchers. In addition, we propose an Interactive
Recommender System (IRS) inspired by (Dandekar
et al., 2013) to assess the effect of the proposed stra-
tegy on the diversity of recommendations in a polari-
zed environment. We see the proposed simulation ap-
proach as a complementary method to investigate the
performance of a recommendation process in a pola-
rized environment in an experimental setting.
The remainder of this paper is organized as fol-
lows. Section 2 presents our proposed methods, fol-
lowed by experiments in Section 3. Finally, we make
our conclusions in Section 4.
2 PROPOSED METHOD
In this section, we propose a strategy that can coun-
teract population polarization, independent of a RS
algorithm. This means that it can later be employed
in a pre-filtering stage along with any recommender
system algorithm. Our proposed approach can be
used to handle polarization without compromising too
much on relevance-based (i.e. pure rating) predictive
accuracy. This is a useful strategy since most online
system providers are using a RS as a black box; hence,
it is difficult to look into the inner workings of the al-
gorithm to modify it.
One might also think of alternatives such as a
straightforward counter-polarization approach, con-
sisting of just including some randomly selected items
from the opposite view. Temporarily, this would seem
to solve the filter bubble problem and increase the di-
versity of the recommended list. However it would
cause much information loss which leads to recom-
mending irrelevant items and eventually risks redu-
cing user satisfaction with the system. In addition,
such a remedy is not able to solve the filter bubble
problem for a long period.
Finally, our proposed approach works in the con-
text of the classical collaborative filtering (CF) Re-
commender system algorithm, however, unlike these
recommender systems, our proposed algorithm al-
lows each user to control how much information to
see from opposite views. Similar to CF recommen-
der systems, we also use latent factor models, spe-
cifically Non-negative Matrix (NMF), to characterize
both items and users based on a set of factors inferred
from user-item rating patterns. However, the propo-
sed approach is not specific to NMF and can be easily
extended to any RS method. The goal of our propo-
sed recommender system is to avoid guiding the user
toward the most popular items and rather to include
items that help users become aware of other items that
they are not able to discover on their own.
PrCP: Pre-recommendation Counter-Polarization
283

2.1 Problem Definition
We start with our definition of polarization and then
define the problem of polarization-aware collabora-
tive filtering (CF).
In the absence of polarization, the distribution of
opinions is either J-shaped as in figure 1d and
figure 1e, or bell shaped, as in figure 1c. However,
as polarization emerges, the resulting distribution
shifts to a U-shaped distribution, see figure 1a, with
two peaks emerging around the two dominant and
confronted opinions at the extreme sides of the rating
scale (Badami et al., 2017; Matakos and Tsaparas,
2016). There are some cases with a flat distribution,
1-b, which represent diverse opinions toward an item.
Different examples of such distributions are shown in
figure 1
1
.
Definition 1 - Polarization:
Given an environment G = (U, I, R), user u ∈ R
1×n
had rated item i ∈ R
m×1
with rating r
ui
∈ R
m×n
on
a scale of x to y. Item i’s polarization score φ
i
is a
measure that captures the presence of a gap between
opposite concentration poles or opposite polarity
peaks of the histogram of all users’ ratings r
i
, when
such poles exist. We say the item is polarized if
φ
i
≥ δ. This definition is subjective and tries to define
an intuitive but data-driven notion of polarization.
Instead of using an explicit formula to calculate this
score, we compute it using a data driven machine
learning model that learns to automatically assign
a polarization score to any rating histogram after
training the model on real item rating histograms
that have been manually labeled according to their
polarization level (Badami et al., 2017)
Definition 2 - Polarization-aware Collaborative
Filtering Recommendation:
Given a set of ratings R ∈ R
m×n
collected from a set
of users U ∈ R
1×n
for a set of items I ∈ R
m×1
, the
problem of polarization-aware collaborative filtering
recommendation (CF) can be modeled by the triplet
(U, I, R), in a way that a recommender system should
recommend a ranked item set i
1
, ..., i
t
∈ I according to
1) the relevance of the item to the user’s interest, and
2) the item’s polarization score. As a realization from
definition 2, (U, I, R) can be denoted by (u, i, r) which
means that user u rated item i with value r.
1
Each distribution belongs to a movie crawled from
IMDb by (Badami et al., 2017) with polarization score, φ,
calculated by the method presented in the paper.
2.2 Pre-recommendation: Countering
Polarization (PrCP)
In this step, we aim to transform the source data in
such a way that it mitigates extreme ratings that make
an item polarized. By doing this, we still keep the
user’s relative preferences, yet make it more moderate
so that no extreme recommendation can be generated
from a standard recommender system algorithm. We
perform a controlled distortion of the training data ba-
sed on which a recommender system is trained to help
the users receive more useful recommendations, in the
presence of polarization. This transformation is based
both on the user’s willingness to discover more items
and on the item’s polarization score.
The proposed solution to counteract polarization
by making the training dataset less polarized, employs
a stochastic mapping function as defined below:
f : (U,I, R) → (U, I,R
0
) with probability p
(1)
The function transforms a user-item rating, r
ui
(for
user u on item i) into rating r
0
ui
, based on the rating
itself, population average rating, item’s polarization
score and user’s chosen discovery factor, as follows.
r
0
ui
= r
ui
− λ
u
× (¯r +
g
i
g
max
) × Φ
λ
u
+r
ui
i
if r
ui
≥ δ
r
0
ui
= r
ui
+ λ
u
× (¯r −
g
i
g
max
) × Φ
λ
u
+r
ui
i
if r
ui
< δ
(2)
where λ
u
∈ [0, 1] is the user’s selected discovery
factor. At one extreme, it is 1 when the user indi-
cates that s/he is interested in discovering more items,
especially from the opposite view. At the opposite ex-
treme, if the user sets λ = 0, the result reduces to using
only the classical recommendation algorithm which
aims to minimize the squared error on the set of raw
ratings. Note that if a user expresses an interest in
considering items from the opposite view, it does not
necessary mean that s/he would definitely like or pur-
chase those items. The goal here, is to simply give an
option to the users to be able to burst out of their fil-
ter bubbles. Φ
i
∈ [0, 1] is the polarization score which
is computed using the Polarization Detection Classi-
fier (Badami et al., 2017). g
i
∈ [0, 1] indicates the gap
between the two rating extreme ranges for a polari-
zed item, in other words it measures how polarized
the user population’s ratings are for item i. We define
the gap g
i
as the difference between an item’s typical
minimum rating when it is liked and its typical max-
imum rating when it is disliked. In other words, the
gap g
i
captures the difference between extreme opini-
ons regarding an item. We define g
i
as
KDIR 2018 - 10th International Conference on Knowledge Discovery and Information Retrieval
284

(a) g and r
ui
(b) λ and r
ui
(c) Φ and r
ui
Figure 2: Correlation between user discovery factor (λ), polarization score (Φ), rating (r
ui
) and gap (g) in the pre-
recommendation style counter-polarization approach.
g
i
=
max
u∈Liked(i)
(r
ui
) − min
u∈U nliked(i)
(r
ui
)
max
u
(R
u
) − min
u
(R
u
)
(3)
where Liked(i) is the set of users who liked item(i)
(i.e. r
ui
≥ δ) and Unliked(i) is the set of users who
didn’t like item(i) (i.e. r
ui
< δ).
Note that the denominator normalizes the gap by
the extremes of the population ratings. g
max
is simply
the difference between the maximum and minimum
rating that a typical user can provide for any item,
using the system’s rating scale. The more polarized a
population gets, the higher g
i
gets. δ indicates which
ratings are considered as liked versus disliked.
3 EXPERIMENTS
In order to evaluate the impact of our proposed
counter-polarization approach, we will take a deeper
look at the view space coverage and effects of polari-
zation on the algorithms.
To empirically validate our proposed pre-
recommendation scheme, we first studied how factors
λ
u
, Φ
i
, g
i
would affect the mapping function from
section 1. Figures 2a-2c show how the difference
among extreme values affects the initial rating r
i j
in a polarized environment if a user u has a high
discovery factor λ. In figure 2a, we assume that
ratings are on a scale of 1 to 10 and that all items
have the same polarization score, ∀i ∈ I,φ
i
= 0.9.
As mentioned before, g
i
represents the difference
between extreme opinions of an item
2
. Similarly,
figure 2b indicates how the transformation affects
the initial ratings for an arbitrary item i, where
g
i
= 2 and the user discovery factor λ is 1. Finally,
2
For example if g
i
= 2, item i has received two diverging
sets of ratings from users. Users who liked this item rated
it 10,9,8,7, while those who did not enjoy the item as much
had given ratings in the range of 1 to 4. So there is a 2-gap
between the given ratings; hence, the item ratings histogram
looks like figure 3
we study the effect of the user’s chosen discovery
factor on transforming the source data. Here, we
assumed that g
i
= 2 and that the item is polarized,
with φ
i
= 0.9. As shown in figure 2c, we performed a
controlled distortion of the training data from which
a recommender system is learned to help the users
receive more recommendations in the presence of
polarization. By doing this, we still keep the users’
preferences, yet make it more moderate so that, less
extreme recommendations are generated when using
a conventional recommender system algorithm.
3.1 Experimental Settings
Most data publishers provide information regarding
the data collection process, yet there are often hidden
biases which affect the recommendation process (Ba-
dami et al., 2017; Nasraoui and Shafto, 2016; Baeza-
Yates, 2016). Hence, we study the effect of pola-
rization on recommender systems on multiple users
in a fixed environment, inspired by (Dandekar et al.,
2013).
We evaluate the performance of our approach in
terms of rating prediction accuracy, using the Mean
Squared Error (MSE) (Koren et al., 2009). As part
of studying polarization. We also define the Oppo-
site View Hit Rate (OVHR) ratio based on the ratio of
the number of items from the opposite view to the to-
tal number of recommended items. Considering each
user, if any of the items from the opposite view is in-
cluded in the recommendation list, then a hit occur-
red.
3.2 Simulating the Interactive
Recommendation Process
We consider the following simple environment: Let
G = (U, I, R) be an environment where user u ∈ U
can rate item i ∈ I with rating r
ui
∈ R on a scale of
x to y. The item could be a book, web page, news
article, movie, etc. We define a recommender system
PrCP: Pre-recommendation Counter-Polarization
285

Figure 3: Rating histograms of the items in environment G with polarization ratio 0.25.
algorithm as follows:
Definition 3: Let the number of users, |U| = n and
number of items, |I| = m. A recommender system al-
gorithm takes environment G as input along with a
user u ∈ U, and outputs a set of items i
1
, ..., i
k
t
∈ I.
Thus, given an environment G, representing which
users have rated which items and a specific user u,
a recommender system algorithm’s output is a list of
items to be recommended to u. We assume that u has
to pick only one item from the recommendation list
and that s/he then provides a rating r
ui
for the selected
item.
We generate a rating environment with 50 users
and 200 items where items are evenly divided in two
opposite viewpoint sets that we refer to as red items
and blue items. Users are also divided into two groups
based on whether they like Red or Blue items
3
. Each
user u ∈ U rates half of the items of I, in such a way
that the rating r
ui
is greater than δ
4
if s/he likes item
i, and less than δ if s/he does not like it. This pro-
cess forms environment G. We also assume that users
are rational and are truly expressing their preferen-
ces with ratings on a scale of 1 to 10. In order to
make the environment polarized, we assume that user
u
a
∈ GroupA likes red items more than blue ones, and
hence all of his/her ratings for the red items are hig-
her than all of his/her ratings for the blue ones. Si-
milarly, we assume that user u
b
∈ GroupB likes blue
items more than red ones and hence all of his/her ra-
tings for the blue items are higher than all of his/her
ratings for the red ones. Finally, we generated envi-
ronment G with different values of Gap, g and user’s
discovery factor, λ
u
.
In order to understand the Interactive Recommen-
der System (IRS), we start by showing some experi-
ments that illustrate examples of how such a system
works in environment G. In all of the examples, we
3
These labels are purely for the purpose of analysis and
they obviously do not affect the recommender system algo-
rithms.
4
For concreteness, we assumed δ = 5.
set the number of factors in the latent space, k
f
, to 5
and we compute the list of top k
t
= 5 items to be re-
commended to each user. The user will give a rating
for only one of the selected items and we take this
rating value from the true source of ratings, i.e. the
ground-truth data. We repeat this procedure 100 times
(there are 100 unrated items for each user) to simulate
an interactive recommender system scenario. In each
iteration, we measure MSE from the training and tes-
ting phases. We also keep track of the items to which
a user decided to react by providing a rating.
Figure 4 shows traces from the interactive recom-
mendation system for user u ∈ GroupA, which me-
ans s/he likes red items more. We generate environ-
ment G considering for example that gap g
i
of 2 me-
ans that 7 ≤ r
ui
≤ 10 if u ∈ GroupA likes item i while
1 ≤ r
ui
≤ 4 if u ∈ GroupA does not like item i. Fi-
gure 3 shows the rating histogram of items and we
can clearly see that the difference between the range
of the two sub-populations of ratings given to an item
is 2. Figure 4, upper row, shows that a classic state
of the art recommender system, in our case NMF, is
always going to recommend red items, to which the
user had previously shown more interest. Although
the red items are relevant, the user Red is trapped in
a filter bubble that does not allow him/her to explore
any items from the opposite color/view, at least not
before the user has seen all of the Red items, the num-
ber of which may be enormous in a real life setting.
This finding is in line with finding in most of the lite-
rature (Lord et al., 1979; Flaxman et al., 2016; Dan-
dekar et al., 2013). The second row shows the testing
MSE error for user u
a
. MSE decreases as the user pro-
vides ratings in each iteration; hence, there are fewer
unrated items for the user. We repeated the same ex-
periment for user u
b
∈ GroupB who likes blue items
more than red items and we observed the same pattern
as user u
a
but with Blue items.
Figure 5 shows the results of applying our propo-
sed pre-recommendation counter polarization (PrCP)
strategy on the traditional NMF-based algorithm in
environment G for user u
a
. As we can see, the user
KDIR 2018 - 10th International Conference on Knowledge Discovery and Information Retrieval
286
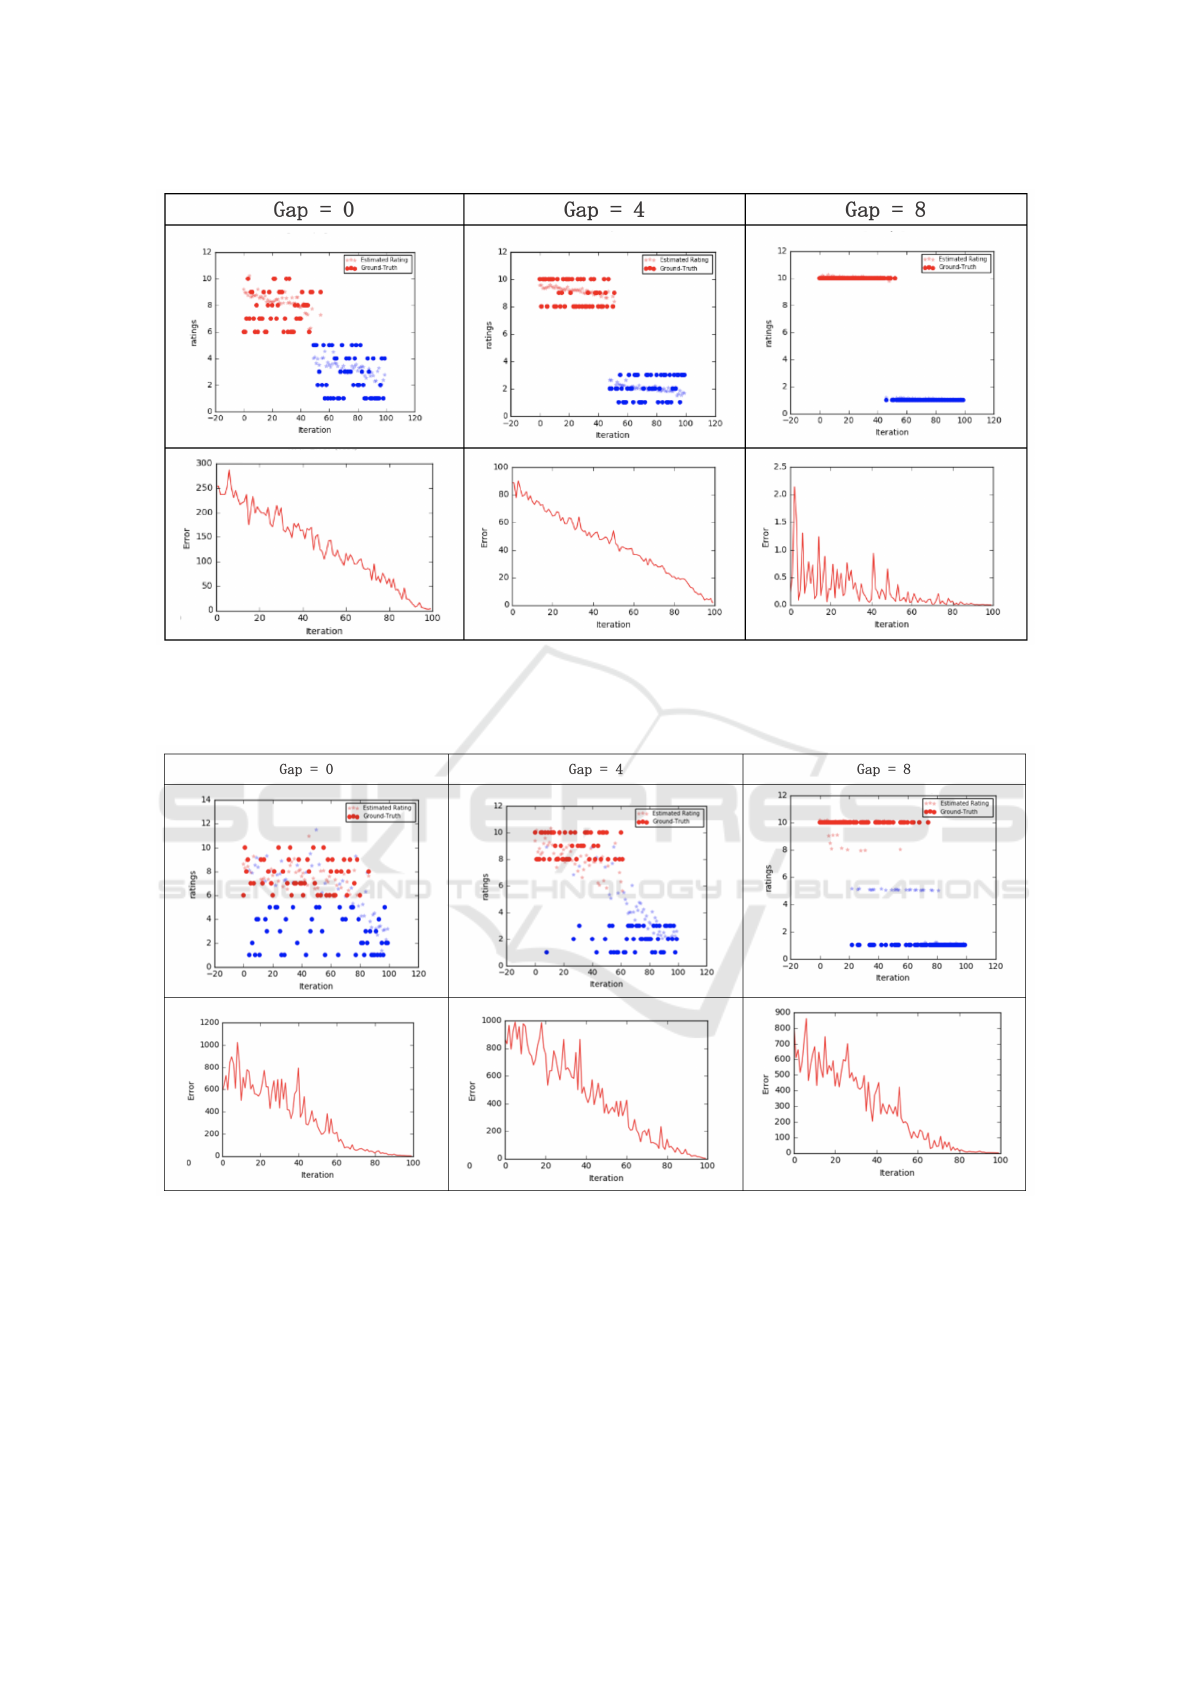
Figure 4: Traces of the Interactive Recommendation process with the classical NMF-based CF recommendation algorithm in
environment G with different polarization ratio and gap values, for user u
a
who had liked red items more. Although the red
items are relevant, the user Red is trapped in a filter bubble that does not allow him/her to explore any items from the opposite
color/view, at least not before the user has seen all of the Red items.
Figure 5: Traces of the Interactive Recommendation process when applying the pre-recommendation counter polarization
(PrCP) strategy for user u
a
. As we can see, the user gets to see items from different a color/view even in a very polarized
environment.
gets to see items from a different color/view even in
a very polarized environment. The second row shows
the testing MSE error for user u
a
which follows the
same trend as before since PrCP doesn’t change the
updating function.
To make a more comprehensive evaluation of per-
formance of the proposed counter-polarization appro-
aches, we repeat the experiment with varying the pa-
rameter λ for the proposed counter-polarization met-
hodology. We consider two scenarios: (a) All users
have the same λ, i.e. λ
u
= c ∀u ∈ U, where c is a
constant ∈ [0, 1]. (b) User u has his/her own unique
λ, λ
u
= c
u
for user u and λ
u
= 0 ∀u ∈ U − u, where
c
u
∈ [0, 1], is a user defined constant.
PrCP: Pre-recommendation Counter-Polarization
287

Table 1: Comparison of the counter-polarization methodologies with the classical NMF-based Recommender system in terms
of accuracy (on training and testing set, respectively) and opposite view ratio (OV HR
u
,OV HR
k
t
). There are two scenarios:
Scenario (a): same λ for all users and Scenario (b): only user u has λ
u
6= 0.
Opposite View Ratio MSE
Train
MSE
Test
OV HR
u
OV HR
k
t
mean, std mean, std mean, std mean, std
Classic NMF 0.0 ± 0.00 22.02 ± 5.27 138.96 ± 12.55
PrCP
Scenario (a)
λ
u
= 0.2 4.8% ± 0.06 25.0% ± 0.035 126.57 ± 38.13 807.30 ± 70.51
λ
u
= 0.5 4.8% ± 0.07 28.0% ± 0.41 122.38 ± 37.16 805.33 ± 71.77
λ
u
= 1.0 5.0% ± 0.06 2.9% ± 0.21 120.14 ± 34.40 800.23 ± 64.91
Scenario (b)
λ
u
= 0.2 5.4% ± 0.073 4.9% ± 0.021 123.92 ± 36.76 813.01 ± 36.76
λ
u
= 0.5 6.2% ± 0.075 5.2% ± 0.042 122.56 ± 39.081 804.01 ± 75.88
λ
u
= 0.7 7.0% ± 0.075 5.8% ± 0.033 120.97 ± 35.19 803.65 ± 64.65
The intuition behind this experiment is to study
the effect of a user population on recommending
items to a single user and to all users. We run the
experiments for different λ ∈ [0.2, 0.7, 1] in environ-
ment G with gap = 2. Then, we compute MSE
test
,
MSE
train
and OV HR for each user and then take an
average over all 50 users. In order to have a compre-
hensive comparison, we compute OV HR in two ways:
(a) OV HR
u
: Compute the ratio of number of items
from the opposite view to what the user has picked
from the recommendation list. (b) OV HR
k
t
: the ratio
of number of items recommended to the user from an
opposite view.
Table 1 shows that the effects of the two metrics
strongly vary depending on the chosen recommenda-
tion algorithm and strategy. Trends in varying para-
meters, show that the higher the user-defined para-
meter λ, the more she will be recommended items
from the opposite view, as desired by the user. When
comparing the traditional NMF-based RS with our
polarization-aware RS, we see that the traditional
NMF-based algorithm achieves good accuracy in ra-
ting prediction, yet it is not able to recommend any
item from the opposite view. In contrast, Our pro-
posed pre-recommendation scheme can be added to
a traditional NMF-based RS and the Polarization-
Aware RS would recommend significantly more items
(p ≤ 0.05) from the opposite view compared to the
baseline approach, for all the degrees of user-defined
discovery factors. These differences between diffe-
rent recommendation processes would go unnoticed
if only accuracy measures were considered.
In addition, table 1 shows that having the same
user discovery factor for all users has less effect com-
pared to increasing the user discovery factor for a spe-
cific user. As we can see in Scenario (b), having
an enthusiastic population does not always result in
counter-polarization. This effect is even more severe
in the polarization-aware strategy where the users do
not see any item from the opposite view even when
the user population has λ
u
= 0.5 ∀u ∈ U.
Finally, by looking at the number of recommended
items over time in figure 5, we can see our proposed
methodology succeeds to cover items from the oppo-
site view after a few iterations and broadens the vie-
wpoint spectrum even faster if the user is more inte-
rested in discovering items from different viewpoints.
4 CONCLUSIONS
In this paper, we investigated the mechanism of filte-
ring and discovering information while using recom-
mender systems. We found that environments with
different polarization degrees engender different pat-
terns. We proposed a counter-polarization methodo-
logy that succeeds to cover items from the opposite
view after a few iterations and can broaden the vie-
wpoint spectrum even faster if the user is more inte-
rested in discovering items from different viewpoints.
The ability of the user to tune the degree of discovery
into the opposite viewpoint is an important feature in
a polarization-aware recommender system because it
allows the users to make decisions about their explo-
ration space. This also contributes to the transparency
of a RS algorithm.
ACKNOWLEDGEMENTS
This research was supported by NSF Grant NSF IIS-
1549981.
KDIR 2018 - 10th International Conference on Knowledge Discovery and Information Retrieval
288

REFERENCES
Abisheva, A., Garcia, D., and Schweitzer, F. (2016). When
the filter bubble bursts: collective evaluation dynamics
in online communities. In Proceedings of the 8th ACM
Conference on Web Science, pages 307–308. ACM.
Badami, M., Nasraoui, O., Sun, W., and Shafto, P. (2017).
Detecting polarization in ratings: An automated pi-
peline and a preliminary quantification on several ben-
chmark data sets. In Big Data (Big Data), 2017 IEEE
International Conference on. IEEE.
Badami, M., Tafazzoli, F., and Nasraoui, O. (2018). A case
study for intelligent event recommendation. Interna-
tional Journal of Data Science and Analytics, pages
1–20.
Baeza-Yates, R. (2016). Data and algorithmic bias in the
web. In Proceedings of the 8th ACM Conference on
Web Science, pages 1–1. ACM.
Bobadilla, J., Ortega, F., Hernando, A., and Guti
´
errez, A.
(2013). Recommender systems survey. Knowledge-
based systems, 46:109–132.
Bozdag, E. (2013). Bias in algorithmic filtering and per-
sonalization. Ethics and information technology,
15(3):209–227.
Caliskan, A., Bryson, J. J., and Narayanan, A. (2017). Se-
mantics derived automatically from language corpora
contain human-like biases. Science, 356(6334):183–
186.
Dandekar, P., Goel, A., and Lee, D. T. (2013). Biased as-
similation, homophily, and the dynamics of polariza-
tion. Proceedings of the National Academy of Scien-
ces, 110(15):5791–5796.
Fish, B., Kun, J., and Lelkes,
´
A. D. (2016). A confidence-
based approach for balancing fairness and accuracy.
In Proceedings of the 2016 SIAM International Con-
ference on Data Mining, pages 144–152. SIAM.
Flaxman, S., Goel, S., and Rao, J. (2016). Filter bubbles,
echo chambers, and online news consumption. Public
Opinion Quarterly, page nfw006.
Garimella, K., De Francisci Morales, G., Gionis, A., and
Mathioudakis, M. (2016a). Quantifying controversy
in social media. In Proceedings of the Ninth ACM In-
ternational Conference on Web Search and Data Mi-
ning, pages 33–42. ACM.
Garimella, K., Morales, G. D. F., Gionis, A., and Mathiou-
dakis, M. (2016b). Balancing opposing views to re-
duce controversy. arXiv preprint arXiv:1611.00172.
Hajian, S., Bonchi, F., and Castillo, C. (2016). Algorithmic
bias: From discrimination discovery to fairness-aware
data mining. In Proceedings of the 22nd ACM
SIGKDD international conference on knowledge dis-
covery and data mining, pages 2125–2126. ACM.
Hardt, M., Price, E., Srebro, N., et al. (2016). Equality of
opportunity in supervised learning. In Advances in
neural information processing systems, pages 3315–
3323.
Isenberg, D. J. (1986). Group polarization: A critical review
and meta-analysis. Journal of personality and social
psychology, 50(6):1141.
Kamishima, T., Akaho, S., and Sakuma, J. (2011). Fairness-
aware learning through regularization approach. In
Data Mining Workshops (ICDMW), 2011 IEEE 11th
International Conference on, pages 643–650. IEEE.
Kirkpatrick, K. (2016). Battling algorithmic bias: How do
we ensure algorithms treat us fairly? Communications
of the ACM, 59(10):16–17.
Knijnenburg, B. P., Sivakumar, S., and Wilkinson, D.
(2016). Recommender systems for self-actualization.
In Proceedings of the 10th ACM Conference on Re-
commender Systems, pages 11–14. ACM.
Koren, Y., Bell, R., and Volinsky, C. (2009). Matrix factori-
zation techniques for recommender systems. Compu-
ter, 42(8).
Lambrecht, A. and Tucker, C. E. (2018). Algorithmic bias?
an empirical study into apparent gender-based discri-
mination in the display of stem career ads.
Liao, Q. V. and Fu, W.-T. (2014). Can you hear me now?:
mitigating the echo chamber effect by source position
indicators. In Proceedings of the 17th ACM confe-
rence on Computer supported cooperative work & so-
cial computing, pages 184–196. ACM.
Lord, C. G., Ross, L., and Lepper, M. R. (1979). Bi-
ased assimilation and attitude polarization: The ef-
fects of prior theories on subsequently considered evi-
dence. Journal of personality and social psychology,
37(11):2098.
Matakos, A. and Tsaparas, P. (2016). Temporal mechanisms
of polarization in online reviews. In Advances in So-
cial Networks Analysis and Mining (ASONAM), 2016
IEEE/ACM International Conference on, pages 529–
532. IEEE.
Mejova, Y., Zhang, A. X., Diakopoulos, N., and Castillo,
C. (2014). Controversy and sentiment in online news.
arXiv preprint arXiv:1409.8152.
Melville, P. and Sindhwani, V. (2011). Recommender sy-
stems. In Encyclopedia of machine learning, pages
829–838. Springer.
Morales, A., Borondo, J., Losada, J. C., and Benito,
R. M. (2015). Measuring political polarization:
Twitter shows the two sides of venezuela. Chaos:
An Interdisciplinary Journal of Nonlinear Science,
25(3):033114.
Munson, S. A. and Resnick, P. (2010). Presenting diverse
political opinions: how and how much. In Procee-
dings of the SIGCHI conference on human factors in
computing systems, pages 1457–1466. ACM.
Nasraoui, O. and Shafto, P. (2016). Human-algorithm inte-
raction biases in the big data cycle: A markov chain
iterated learning framework. CoRR, abs/1608.07895.
Shafto, P. and Nasraoui, O. (2016). Human-recommender
systems: From benchmark data to benchmark cogni-
tive models. In Proceedings of the 10th ACM Con-
ference on Recommender Systems, pages 127–130.
ACM.
Sun, W., Nasraoui, O., and shafto, P. (2018). Iterated algo-
rithmic bias in the interactive machine learning pro-
cess of information filtering. In Proceedings of the
10th Of the Knowledge Discovery and Information
Retrieval conference.
Zhang, X., Zhao, J., and Lui, J. C. (2017). Modeling the
assimilation-contrast effects in online product rating
systems: Debiasing and recommendations. In Procee-
dings of the Eleventh ACM Conference on Recommen-
der Systems, RecSys ’17, pages 98–106, New York,
NY, USA. ACM.
PrCP: Pre-recommendation Counter-Polarization
289
