Running Video Matching Algorithm Focusing on the Periodicity and
Linearity of Running Motion
Yoshiteru Yamamoto
1
, Keisuke Doman
1
, Yoshiya Hotta
2
and Yoshito Mekada
1
1
Graduate School of Engineering, Chukyo University, Japan
2
Graduate School of Health and Sport Sciences, Chukyo University, Japan
1 OBJECTIVES
For track-and-field runners, the running form is a ma-
jor factor that affects his/her performance. The per-
formance deeply depends on several points: the angle
of an ankle when a foot touches the ground, the angle
of a knee when a foot pushes the ground, the distance
from the ground to the hand when swinging the arm,
the speed of its swing motion and so on (Blazevich,
2010). It is, however, difficult for runners to improve
their running form relying on experience and sense.
Athletes and their coaches actually need an efficient
way of finding running form issues for performance
improvement, although they visually check their run-
ning form through performance videos.
Some useful systems using motion sensors or iner-
tial measurement units have been developed for run-
ning form analysis (Philpott et al., 2014; Sascha et al.,
2016). They, however, require large-scale devices,
expensive devices or laboratory environments, which
may constraint the subject’s movement and then pre-
vent the subjects from performing as usual. This rese-
arch aims at supporting form analysis using cameras
without any physical constraints. Note that we focus
on short-distance run (100-meter) considering the sig-
nificance of running form to the time record.
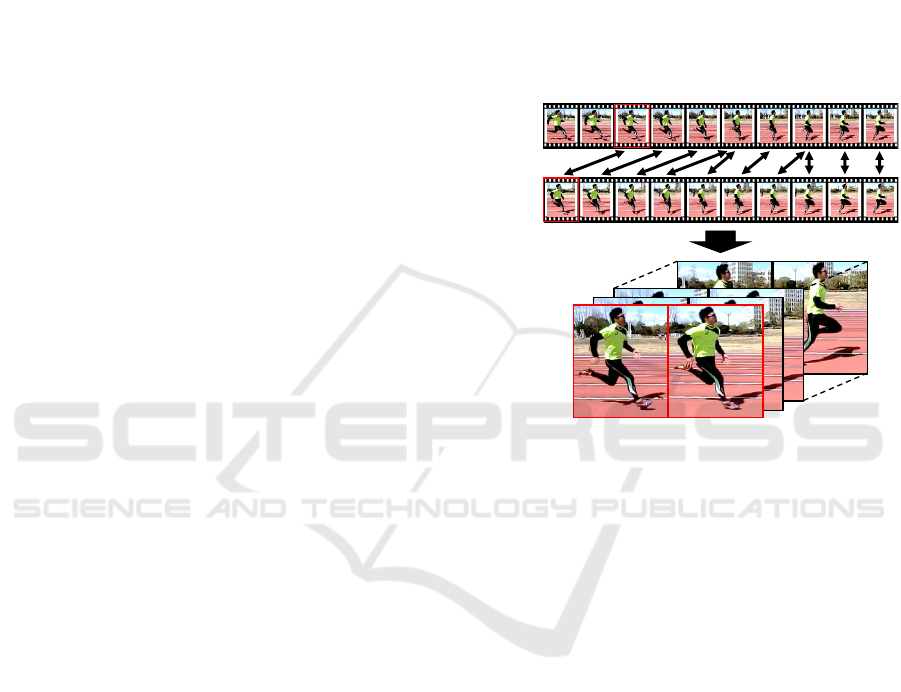
So far, we proposed a method for time sequence
matching in order to make the running form com-
parison between the videos easier (Yamamoto et al.,
2017). The method matched performance videos
frame by frame using a dynamic time warping (DTW)
framework (Myers and Rabiner, 1981) based on the
similarity of running form, as shown in Fig. 1. The
matching accuracy of the method should be improved
for practical use, although its framework is effective.
The major problem to be solved was that the method
could not accurately evaluate the running form. The
method calculated the running form similarity based
on the runner’s gait silhouette, which represents only
the outline of a running form. Another problem was
that the entire of an input performance video could not
be used for matching due to the limitation of a DTW
Matching
result
Video 1
Video 2
Figure 1: Time-sequence matching toward automatic run-
ning form analysis.
scheme. It is necessary that the matched videos are
long enough to visually check a running form. The
longer the matched video, the higher probability of
finding a running form issue.
In this paper, we propose a more accurate and use-
ful matching framework for time sequence matching
focusing on 1) the periodicity of running motion and
2) the linearity of running speed.
2 METHODS
As shown in Fig. 2, running motion in general should
be periodic and uniform linear motion. In the case
that a performance video contains two cycles of run-
ning motion, each phase in the running motion should
appear twice in the video. The proposed method ma-
tches two performance videos frame by frame focu-
sing on the periodicity and the linearity of running
motion. The method supposes that each input video
contains more than one cycle of running motion and
the videos are captured by fixed cameras placed at dif-
ferent points (50m vs. 90m).
The method is composed of four steps: 1) pose es-
timation, 2) correspondent phase detection, 3) linear
24
Yamamoto, Y., Doman, K., Hotta, Y. and Mekada, Y.
Running Video Matching Algorithm Focusing on the Periodicity and Linearity of Running Motion.
In Extended Abstracts (icSPORTS 2018), pages 24-28
Copyright © 2018 by SCITEPRESS – Science and Technology Publications, Lda. All rights reserved
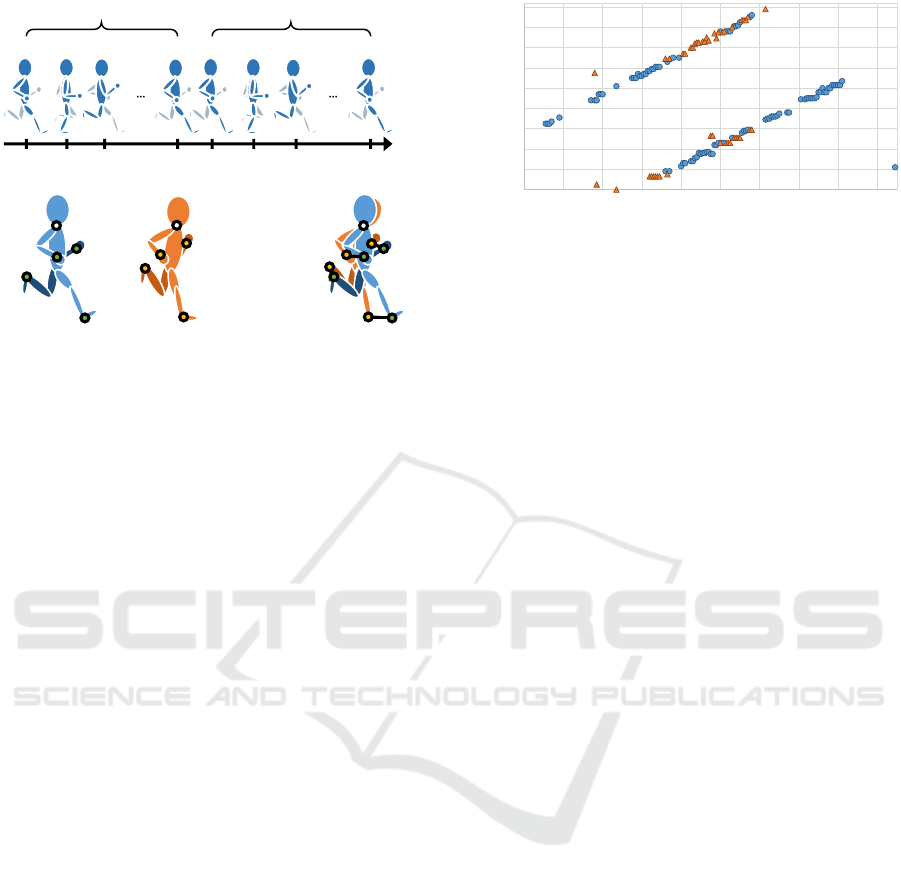
phase
1st cycle
A
(1)
C
(1)
A
(2)
frame
B
(1)
B
(2)
C
(2)
2nd cycle
D
(1)
D
(2)
Figure 2: Periodic and uniform linear running motion.
(a) Running form at two points (b) Dissimilarity
Figure 3: Distance calculation for running form: Average
Euclidean distance between body keypoints.
matching, and 4) expansion matching. The details of
each step are described below.
2.1 Pose Estimation
The method applies OpenPose (Cao et al., 2017), a 2D
pose estimation technique, to each input video, and
then detects several body keypoints (joints) of the run-
ner in each video frame. Here, OpenPose detects all
of the people that appear in the videos, and does not
track them. The method regards that a person with the
longest hip-to-neck distance as the runner of interest
for each frame.
2.2 Correspondent Phase Detection
2.2.1 Distance Measure
The method defines the dissimilarity of running form
as the average Euclidean distance between the four
keypoints: the left and the right wrists, and the left
and the right ankles, as shown in Fig. 3. That is, the
smaller the distance is, the more similar the running
form is. The distance is calculated based on the coor-
dinates of the wrists and the ankles which are repre-
sented with a neck-based relative coordinate system.
This leads to ignore the scale difference of the run-
ner’s body in each frame.
2.2.2 Correspondent Frame Pair Detection
The method finds the correspondent timing of the run-
ning motion for each frame. For example in Fig. 2, the
phase A
(1)
in the first cycle and the phase A
(2)
in the
second cycle are correspondent. To do that, we intro-
duce the following two-way detection scheme consi-
dering that the failure of pose estimation for a video
y: Number of frames (V
2
)
x: Number of frames (V
1
)
0
20
40
60
80
100
120
140
160
180
0 20 40 60 80 100 120 140 160 180
Figure 4: Example of the result of correspondent frame pair
detection (The blue circle and the orange triangle indicate
the pairs with the 1st and the 2nd minimum distances).
frame results in the failure of distance calculation. Let
us denote each of the performance videos by V
1
and
V
2
. The method first finds the frame with the mini-
mum distance f
(2)
min
in V
2
for each frame f
(1)
src
in V
1
(V
1
to V
2
), and then finds the frame with the minimum
distance f
(1)
min
in V
1
for each f
(2)
min
as a reverse check
(V
2
to V
1
). It is accepted if the two-way detection re-
sult agrees, that is, the frame index difference between
f
(1)
src
and f
(1)
min
is less than a threshold θ. Similarly, the
method finds the second minimum frame pairs in V
1
and V
2
. The example of a detection result is shown
in Fig. 4. Note that, in this case, the two videos con-
tain more than one and less than two cycles of running
motion.
2.3 Linear Matching
2.3.1 Binary Clustering
Let x and y be respectively the frame indices in V
1
and
V
2
. The method first projects the points onto a line
y = ax, and then clusters into two subclusters based on
discriminant analysis (Otsu, 1979). Here, we uses a =
−1 for simplicity considering that the running motion
is almost a uniform linear motion and its speed does
not change greatly between the input two videos.
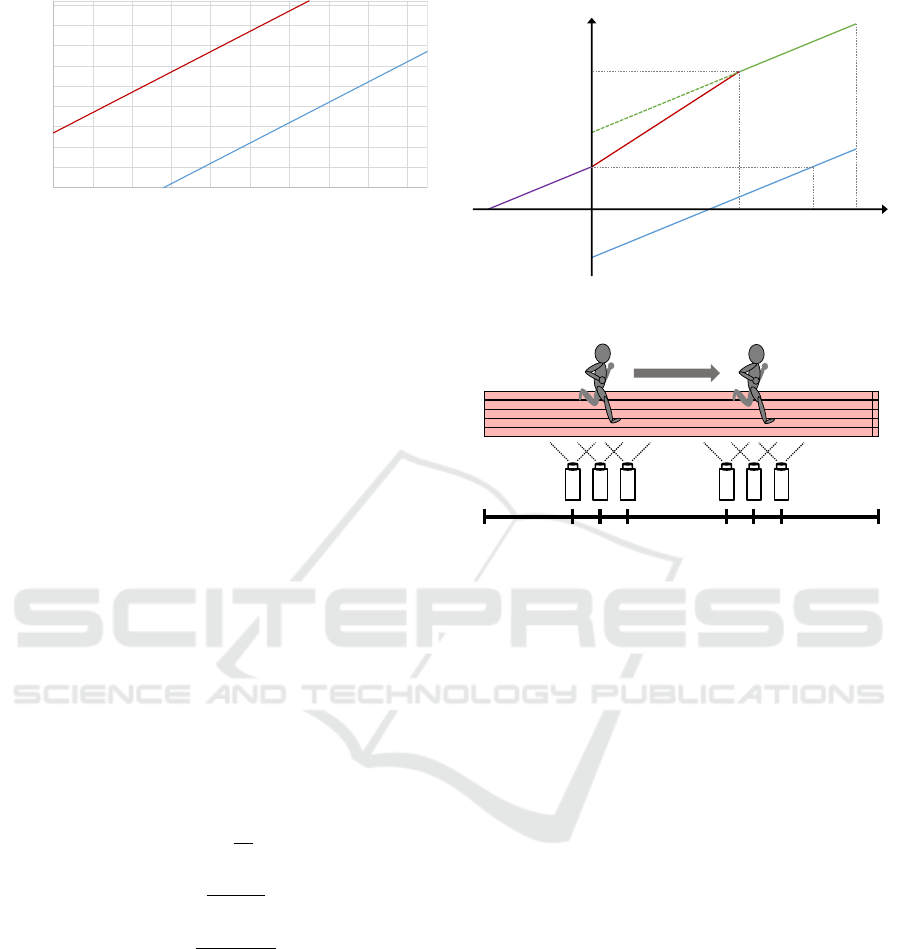
2.3.2 Line Fitting with RANSAC
We can see in Fig. 4 two linear distributions with a
few outliers misdetected through the two-way check.
This is because the pose estimation is failed and the
coordinates of misdetected body keypoints are acci-
dentally similar. To deal with such a situation, the
method applies a RANSAC algorithm (Fischler and
Bolles, 1981) for robust line fitting to each subcluster.
The estimated line should represent the global opti-
mal matching between the frames in V
1
and V
2
. The
result of the line fitting to the data is shown in Fig. 5.
The great advantage to our previous method (Yama-
Running Video Matching Algorithm Focusing on the Periodicity and Linearity of Running Motion
25
y ( semarf fo rebmuN : V
2
)
x: Number of frames (V
1
)
0
20
40
60
80
100
120
140
160
180
0 20 40 60 80 100 120 140 160 180
l
1
: y = 0.993x + 53.62
l
2
: y = 0.925x - 48.93
Figure 5: Result of line fitting to the data Fig. 4.
moto et al., 2017) is that the above approach is ro-
bust to the error of body keypoint detection. The met-
hod can accurately match the videos frame by frame
if body keypoints are misdetected for some video fra-
mes. Note that more than one frame in V
2
may cor-
respond to the frame in V
1
due to the multiple cycles
of running motion, as shown in Fig. 5 (between the
frame range of [56,130] in V
1
).
2.4 Expansion Matching
Let I and J be respectively the total number of frames
in V
1
and V
2
. Let l
1
: y = a
1
x +b
1
and l
2
: y = a
2
x + b
2
be the two estimated lines for the subclusters 1 and 2,
respectively. The method expands the video sections
in both V
1
and V
2
, and then matches each frame in V
1
with one frame in V
2
based on the following formula:
y =
a
2
x + b
1
(x
0
5 x < 0)
a
1
x + b
1
(0 5 x 5 x
3
)
a
2
x + b
3
(x
3
< x < I)
(1)
where
x
0
= x
1
− x
2
(2)
x
1
= −
b
2
a
2
(3)
x
2
=
b
1
− b
2
a
2
(4)
x
3
=
J − 1 − b
1
a
1
(5)
b
3
= J − 1 − a
2
x
3
. (6)
As shown in Fig. 6, the method selects the frame
pairs based on the three lines: l
0
2
, l
1
and l
00
2
if the videos
contains less than two cycles of running motion. The
frames between the x-axis range [x
0
, 0) are the copy of
those between the x-axis range [x
1
, x
2
). Similarly, the
frames after the (J − 1)th y-axis index are the copy of
those corresponding to the x-axis range [x
3
, I). By this
expansion matching, all of the frames in both V
1
and
V
2
are used for matching, which enables us to analyze
the running form at all of the frames in V
1
and V
2
. This
is another advantage of the method.
I−10
x
1
x
2
x
3
b
3
b
1
J−1
x
0
b
2
y
x
l
1
: y = a
1
x + b
1
l
2
: y = a
2
x + b
2
l''
2
: y = a
2
x + b
3
l'
2
: y = a
2
x + b
1
Figure 6: Expansion of the matched video section (The x-
axis is the frame number of V
1
and y-axis is that of V
1
).
50m
0m
90m 100m
Figure 7: Camera setup in the experiment.
3 RESULTS
We evaluated the effectiveness and the usefulness of
the proposed method through experiments.
3.1 Method
We captured one 100m run per runner at two points
using six cameras as shown in Fig. 7. Here, the
50m and the 90m points were selected considering the
maximum speed phase and the deceleration phase, re-
spectively. The runners were five males (Runners A
to E) and one female (Runner F) sprinters who were
members of the track-and-field team in our university.
The resolution and the framerate of the videos were
640×480 and 120 fps, respectively. We concatenated
the videos captured by the three cameras into one for
each point so as to contain more than one cycle of run-
ning motion. As shown in Table 1, we finally obtained
six concatenated video pairs for each runner, and used
them as experimental videos.
We applied the proposed method to each experi-
mental video pair (50m vs. 90m), and then evaluated
the matching accuracy based on the three measures:
1) the average matching error (the phase shift of run-
ning motion between a matched frame pair), 2) the
icSPORTS 2018 - 6th International Congress on Sport Sciences Research and Technology Support
26

Table 1: Experimental videos.
Runner
#Frames Cycle
50m 90m 50m 90m
A 138 151 1.3 1.4
B 152 162 1.5 1.5
C 160 161 1.6 1.5
D 149 165 1.3 1.4
E 160 177 1.6 1.7
F 191 185 1.6 1.7
Table 2: Experimental result: Previous method (Yamamoto
et al., 2017) vs. Proposed method.
Runner
Avg. (Max.) #Matched
Error Frames
Prev. Proposed Prev. Proposed
A 0.93 (4) 0.93 (2) 98 189
B 1.89 (7) 0.68 (2) 140 196
C 3.87 (9) 1.07 (4) 116 176
D 2.70 (9) 1.41 (3) 117 179
E 1.04 (6) 1.48 (6) 142 242
F 2.76 (4) 1.69 (3) 129 245
maximum matching error, and 3) the number of ma-
tching frames. Here, we used θ = 15 for the corre-
spondent frame pair detection considering the video
framerate and the speed of running motion. Also,
we compared the matching accuracy of our previous
method (Yamamoto et al., 2017), which was based on
the similarity of the runner’s gait silhouette within a
DTW-based framework (Myers and Rabiner, 1981).
3.2 Matching Results
Experimental results are shown in Table 2. An ex-
ample of the matching result by the proposed method
for each runner is shown in Fig. 8. The proposed
method outperformed the previous one (Yamamoto
et al., 2017) in both the average and the maximum
matching error except for Runner E. Also, the greater
number of matched frames were obtained by the pro-
posed method. The coach of our track-and-field team
confirmed that the matching result was accurate and
enough to visual comparison of running form. The
coach also commented that a seamless video contai-
ning the whole cycle of running motion helped to ana-
lyze the running motion. In this regard, such a video
pair can be easily created from the matching result of
the proposed method. We confirmed the effectiveness
and the usefulness of the proposed method.
4 DISCUSSION
We discuss the effectiveness of the proposed method
in terms of 1) the robustness of pose estimation error
and 2) the accuracy of video matching.
4.1 Robustness to Pose Estimation
Error
For Runner C: The matching error of the previous
method was 3.87 (the worst among all the runners),
whereas that of the proposed method was 1.07. Ex-
amples of the pose estimation results for Runner C
are shown in Fig. 9. The body keypoints were so-
metimes misdetected, which significantly affected the
running form similarity in the previous method. In
contrast, the proposed method estimated the global
optimal matching by line fitting with RANSAC re-
gardless of some pose estimation failure. This was
why the proposed method could achieve the accurate
matching for all of the videos (runners).
4.2 Accuracy of Video Matching
For Runner B: Examples of the pose estimation
results are shown in Fig. 10. The average and the
maximum matching error of the proposed method for
Runner B were 0.68 and 2, respectively. It was the
most accurate matching among all the runners. The
running motion of Runner B was more uniform and
linear than that of the others at each 50m and 90m
point, which is ideal for better time record. The pro-
posed method can perfectly perform in such an ideal
case. Incidentally, it may happen that the running
speed changes within the range of the camera’s field
of view due to fatigue. We will thus study the combi-
nation with a DTW framework, and/or polygonal line
fitting.
For Runner E: The matching error of the proposed
method was larger than that of the previous one. The
result of the correspondent frame pair detection for
Runner E is shown in Fig. 11. No frame pairs were
detected between the x-axis range of [0,23] due to
the failure of the two-way detection. The successive
lack of inliers leads to decrease the line fitting accu-
racy, although outliers should be ignored by RAN-
SAC scheme. We consider that increasing the data
point can solve this problem, for example, by finding
not only the frame pairs of the first minimum dis-
tant frame f
(1)
min
but also those of the N-th minimum
( f
(1)
min2
, f
(1)
min3
, . . .) for the source frame f
(1)
src
.
Running Video Matching Algorithm Focusing on the Periodicity and Linearity of Running Motion
27
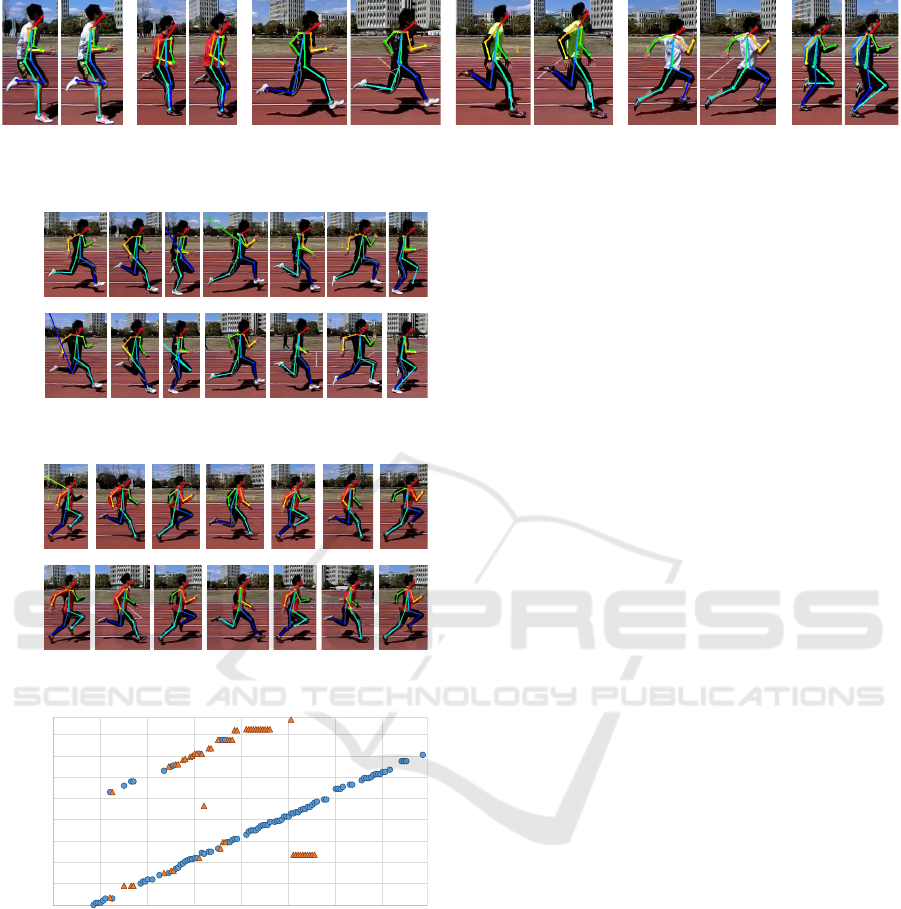
40 56
C
2980
A
86 30
F
81 112
D
122134
E
13 59
B
Figure 8: Examlple of the matching result for each runner (The number indicates the frame index).
1288 98 34 49 81 113
97655028155 130
50m
90m
Figure 9: Examples of the pose estimation result for Runner
C (The number indicates the frame index).
4 28 52 7678 104 128
25 49 74 99 123 152 76
50m
90m
Figure 10: Examples of the pose estimation result for Run-
ner B (The number indicates the frame index).
0
20
40
60
80
100
120
140
160
0 20 40 60 80 100 120 140
y: Number of frames (V
2
)
x: Number of frames (V
1
)
Figure 11: Result of the correspondent frame pair detection
for Runner E (The blue circle and the orange triangle indi-
cate the pairs with the 1st and the 2nd minimum distances).
5 CONCLUSION
This paper proposed a method for frame-by-frame
video matching of running motion toward automa-
tic running form analysis. Experimental results sho-
wed that the effectiveness and the usefulness of the
proposed method. The future work includes the in-
troduction of the combination of a DTW framework
and/or polygonal line fitting, and the improvement of
the correspondent frame pair detection. Also, we will
develop a system that can automatically diagonose a
running form issue based on matching results for per-
formance improvement.
REFERENCES
Blazevich, A. J. (2010). Sports Biomechanics. The basics:
Optimising human performance. Bloomsbury Publis-
hing, 2nd edition.
Cao, Z., Simon, T., Wei, S., and Sheikh, Y. (2017). Real-
time multi-person 2d pose estimation using part affi-
nity fields. In Proc. 2017 IEEE Conf. on Computer
Vision and Pattern Recognition, pages 7291–7299.
Fischler, M. A. and Bolles, R. C. (1981). Random sample
consensus: A paradigm for model fitting with appli-
cations to image analysis and automated cartography.
(6):381–395.
Myers, C. S. and Rabiner, L. R. (1981). A comparative
study of several dynamic time-warping algorithms for
connected-word recognition. (7):1389–1409.
Otsu, N. (1979). A threshold selection method from gray-
level histograms. pages 62–66.
Philpott, L., Weaver, S., Gordon, D., Conway, P. P., and
West, A. A. (2014). Assessing wireless inertia mea-
surement units for monitoring athletics sprint perfor-
mance. In Proc. IEEE Sensors 2014, pages 2199–
2202.
Sascha, K., Buchecker, M., Pfusterschmied, J., Szekely,
C., and M
¨
uller, E. (2016). Effects of a body-weight
supporting kite on sprint running kinematics in well-
trained sprinters. J. Strength and Conditioning Rese-
arch, (1):102–108.
Yamamoto, Y., Doman, K., Hotta, Y., and Mekada, Y.
(2017). Running form analysis based on time-
sequense matching. In Proc. Int. Workshop on Ad-
vanced Image Technology 2017, number 4B-4.
icSPORTS 2018 - 6th International Congress on Sport Sciences Research and Technology Support
28
