
The Influence of Input Data Standardization Methods on the Prediction
Accuracy of Genetic Programming Generated Classifiers
Amaal R. Al Shorman
1
, Hossam Faris
1
, Pedro A. Castillo
2
, J. J. Merelo
2
and Nailah Al-Madi
3
1
Business Information Technology Department, King Abdullah II School for Information Technology,
The University of Jordan, Amman, Jordan
2
Department of Computer Architecture and Computer Technology, ETSIIT and CITIC,
University of Granada, Granada, Spain
3
Computer Science Department, Princess Sumaya University for Technology, Amman, Jordan
Keywords:
Classification, Genetic Programming, Preprocessing, Standardization Methods.
Abstract:
Genetic programming (GP) is a powerful classification technique. It is interpretable and it can dynamically
build very complex expressions that maximize or minimize some fitness functions. It has a capacity to model
very complex problems in the area of Machine Learning, Data Mining and Pattern Recognition. Nevertheless,
GP has a high computational complexity time. On the other side, data standardization is one of the most
important pre-processing steps in machine learning. The purpose of this step is to unify the scale of all input
features to have equal contribution to the model. The objective of this paper is to investigate the influence of
input data standardization methods on GP, and how it affects its prediction accuracy. Six different methods of
input data standardization were checked in order to determine which one allows to achieve the most accurate
result with lowest computational cost. The simulations have been implemented on ten benchmarked datasets
with three different scenarios (varying the population size and number of generations). The results showed
that the computational efficiency of GP is highly enhanced when coupled with some standardization methods,
specifically Min-Max method for scenario I and Vector method for scenario II, and scenario III. Whereas,
Manhattan and Z-Score methods had the worst results for all three scenarios.
1 INTRODUCTION
Data classification techniques deal with creating clas-
sifiers which allocate a label to data. These techniques
use the existing data in order to produce these classi-
fiers, and once created, the classifiers are applied to
new unseen data. Various techniques have been ap-
plied to data classification, including statistical met-
hods such as Bayesian and regression methods, and
evolutionary algorithms such as genetic programming
algorithms.
Genetic programming is inspired by nature. It has
often been used to solve data classification problems
and has been successful in producing good classifiers
(Jabeen and Baig, 2010). Despite the large number
of studies which have addressed data classification by
using genetic programming, it is apparent from the
literature that there are still certain areas of research
which have not been explored. These areas represent
the rationale behind this paper. The primary objective
of this paper is to investigate the influence of input
data standardization methods on the performance ge-
netic programming in the domain of data classifica-
tion.
To achieve this goal, six different input standar-
dization methods are applied on ten benchmark da-
tasets obtained from the University of California Ir-
vine (UCI), Machine Learning Repository before ap-
plying GP. The results show that applying standardi-
zation methods on data plays an important role in ef-
fecting the performance of GP, where standardization
methods encourage the high accuracy and accelerate
the learning process.
The rest of the paper is organized as follows:
Section 2 provides an overview of related research
that applies data standardization for different appli-
cations, Section 3 provides an overview about gene-
tic programming. Section 4 provides a description
of the different standardization methods that are used
through this paper. Section 5 presents and discusses
the obtained results. Finally, the conclusion is settled
in the Section 6.
Shorman, A., Faris, H., Castillo, P., Merelo, J. and Al-Madi, N.
The Influence of Input Data Standardization Methods on the Prediction Accuracy of Genetic Programming Generated Classifiers.
DOI: 10.5220/0006959000790085
In Proceedings of the 10th International Joint Conference on Computational Intelligence (IJCCI 2018), pages 79-85
ISBN: 978-989-758-327-8
Copyright © 2018 by SCITEPRESS – Science and Technology Publications, Lda. All rights reserved
79
2 RELATED WORK
Data preprocessing is a very important step that
should be done before running any data mining task.
One of these methods is data standardization, which
has an effect on the performance of applied algo-
rithms. researchers have been studying this effect
using different algorithms, and on different applica-
tions.
In (Anysz et al., 2016), the authors studied the ef-
fect of six data standardization methods applied on
data before using Artificial Neural Network (ANN) to
classify the data. The results of their research showed
that two standardization methods decreased the errors
achieved by ANN. They also suggested that similar
to tunning ANN parameters for the targeted problem,
some work should be done for data standardization to
choose the best method that suits the problem.
The authors of (Wang and Zhang, 2009) analyzed
the effect of applying four data standardization met-
hods on the results of fuzzy clustering, which were
used for analyzing the spatial distribution of water re-
sources carrying capacity of 17 regions in Shandong
Province, China. The data has four numerical featu-
res, describing the water resources. The results sug-
gest to use two methods which are: maximum value
standardization method and mean value standardiza-
tion method.
Another research that tested data standardization
with water related data was proposed in (Cao et al.,
1999). The authors used multivariate approach to ana-
lyze the river water quality. They tested two standar-
dization approaches, and found that they did not work
well for this type of problems, therefore, they propo-
sed a new data standardization methods that includes
water quality standards which achieved better results
compared to other tested approaches.
The research of (Griffith et al., 2016) compared
two standardization methods across number of sce-
narios to examine the types of heterogeneity using
three datasets. The researchers found that methods
of standardization and the population characteristics
had only a small influence on heterogeneity.
This paper is differentiated that it studies the effect
of using data standardization on GP accuracy. More-
over, it studies the effect of combining data standardi-
zation with different GP parameters (population size
and number of maximum generations). It also uses
six data standardization methods applied on ten ben-
chmarked datasets.
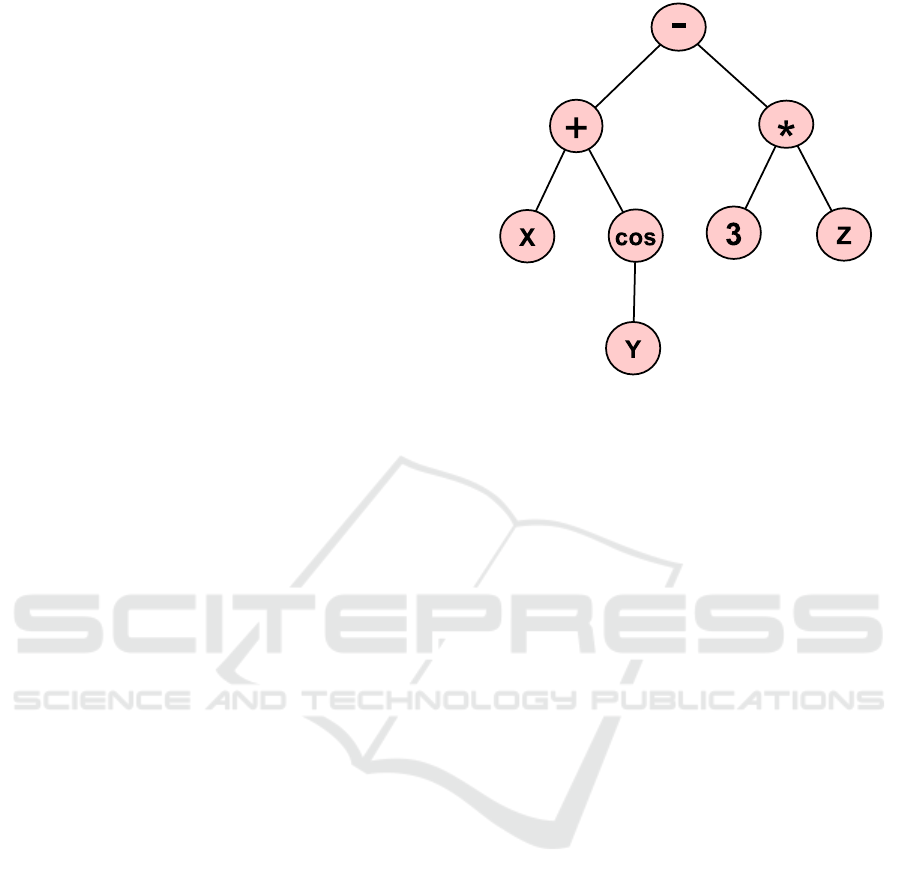
Figure 1: Example of basic tree representation in GP.
3 GENETIC PROGRAMMING
Genetic Programming (GP) is an evolutionary algo-
rithm which is inspired by the principles of Darwinian
evolution theory and natural selection (Koza, 1992).
GP is domain-independent modeling technique that
automatically solves problems without having to tell
the computer explicitly how to do it. (Koza, 1991).
GP it is commonly referred to as symbolic regression
or symbolic classification according to the task that it
performs. The concept of GP was first introduced by
John Koza in (Koza, 1991).
GP algorithms works iteratively as an evolutio-
nary cycle, evolving a population of computer pro-
grams or models represented as symbolic tree expres-
sions. Traditionally the evolved models are LISP pro-
grams. Since GP automatically evolves both the struc-
ture and the parameters of the mathematical model,
LISP gives GP more flexibility to handle data and
structures that can be easily manipulated and evalu-
ated. For example, the simple expression: ((X +
cos(Y )) − (3 × Z)) is represented as shown in Figure
1.
In Figure 2, we show the evolutionary process of
GP. In more details, the cycle is described as follows:
• Initialization: the GP cycle starts by generating
an initial population of random computer pro-
grams (also known as individuals) using a prede-
fined function set and a terminal set.
• Fitness Evaluation: the fitness value for each in-
dividual is computed based on a defined measure-
ment.
• Selection: based on the fitness values of the in-
dividual, some of these individuals are chosen for
IJCCI 2018 - 10th International Joint Conference on Computational Intelligence
80
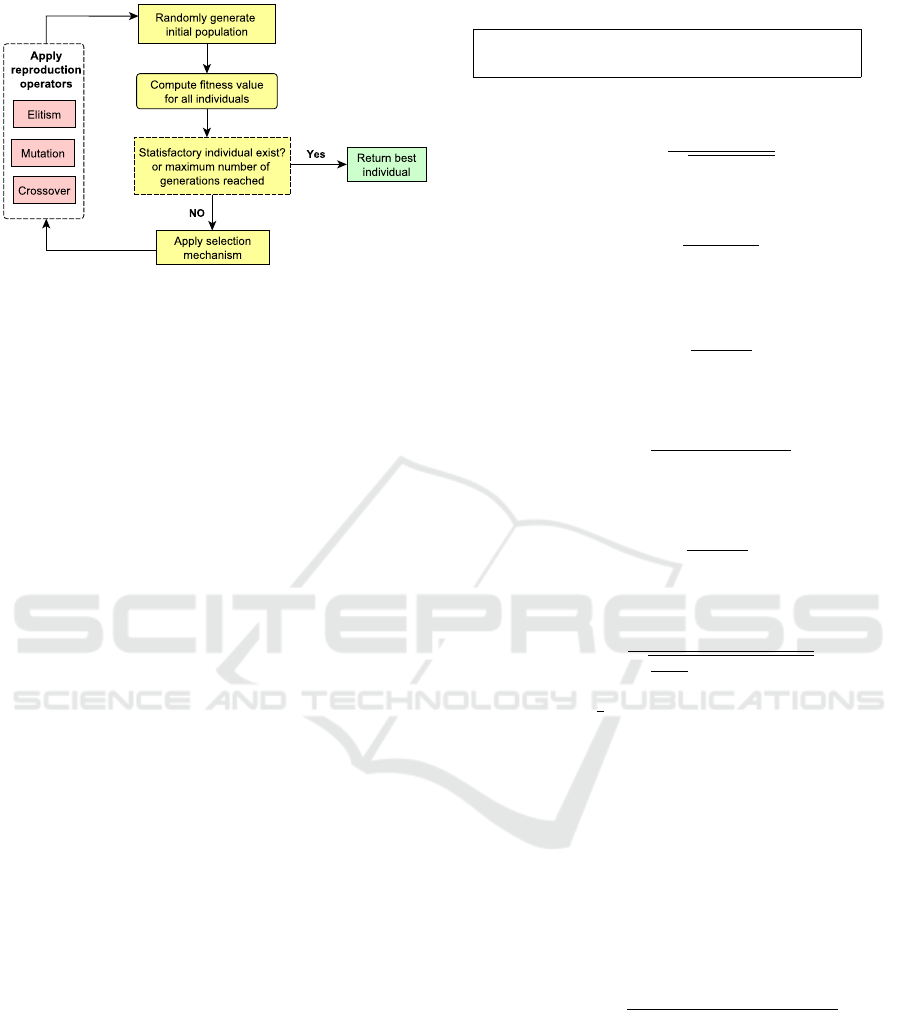
Figure 2: Main loop of the GP (Sheta et al., 2014).
reproduction. Selection is done using some se-
lection mechanism (i.e; Tournament selection).
• Reproduction:in this process, different repro-
duction operators are applied in order to generate
new individuals. These operators usually include
crossover, mutation and elitism. Crossover opera-
tor swaps two randomly chosen sub-parts in two
randomly chosen individuals. Mutation operator
selects a random point in an individual and repla-
ces the part under this point with a new genera-
ted sub-part. Elitism selects some best individuals
and copies them to next generation without any
modification.
• Termination: the evolutionary cycle of the GP
algorithm stops iterating when an individual with
a required fitness value is found or the predefined
maximum number of iterations is reached.
4 ACCURACY CALCULATION
FOR DIFFERENT
STANDARDIZATION
METHODS APPLIED FOR GP
INPUT DATA
In this section a description of the standardization
methods and an evaluation measure that are used in
this paper is provided.
4.1 Standardization Methods Applied to
GP Input Data
Six different standardization methods were applied
to original data sets (Kaftanowicz and Krzemi
´
nski,
2015; Zavadskas and Turskis, 2008; Altman, 1968).
Table 1 shows the nomenclature used in equations.
Table 1: Nomenclature.
A
i
i element of a given data type after standardization
A
oi
i element of a given data type before standardization
n number of elements of a given data type (i vary from 1 → n)
• Vector standardization
A
i
=
A
oi
p
∑
n
i=1
(A
oi
)
2
(1)
• Manhattan standardization
A
i
=
A
oi
∑
n
i=1
|A
oi
|
(2)
• Maximum linear standardization
A
i
=
A
oi
maxA
oi
(3)
• Weitendorf‘
0
s linear standardization
A
i
=
A
oi
− min A
oi
maxA
oi
− min A
oi
(4)
• Peldschus
0
nonlinear standardization
A
i
= (
A
oi
maxA
oi
)
2
(5)
• Altman Z−score standardization
A
i
=
A
oi
−
¯
E
q
1
(n−1)
∑
n
i=1
(A
oi
−
¯
E)
2
(6)
where
¯
E =
1
n
∑
n
i=1
A
oi
4.2 Accuracy Metric
Since the data sets are nearly balanced, accuracy clas-
sification rate or accuracy is the main evaluation mea-
sure that is used to assess the performance of the sym-
bolic GP on different standardization methods. Accu-
racy is defined as the sum of the number of true posi-
tives and true negatives divided by the total number of
examples (where # means ”number of”, and TP stands
for True Positive, etc.):
Accuracy =
#T P + #T N
#T P + #FP + #T N + #FN
, (7)
where the accuracy is calculated based on test part of
data only.
5 EXPERIMENTS AND RESULTS
The details of the data sets description, experiments
environment, GP parameters, and the results are dis-
cussed in the following subsections.
The Influence of Input Data Standardization Methods on the Prediction Accuracy of Genetic Programming Generated Classifiers
81

5.1 Data Sets Description
To study the effect of input data standardization met-
hods on GP, 10 binary and nearly balanced data sets
were obtained from the University of California at Ir-
vine (UCI) machine learning repository (Dheeru and
Karra Taniskidou, 2017). These data sets were se-
lected as they have varying characteristics, in order to
study the effect of the standardization methods on GP
on different scales of problem complexity. Moreover,
some of the data sets (4 out of 10) are considered large
data sets, as they have more than 10 features (Beyer
et al., 1999; Kanevski et al., 2008). It is worth menti-
oning that many of these data sets have been used in
the literature for testing symbolic GP.
The data sets are described in Table 2 in terms
of number of classes, number of features, number of
data points, and data set type after removing irreverent
features and missing values.
5.2 Experiments Environment
HeuristicLab version 3.3 is used to perform all sym-
bolic GP experiments (Wagner et al., 2014). All expe-
riments are conducted on a PC with Windows 7 Ulti-
mate 64 bit Operating System, an Intel(R) Core(TM)
i7 − 4500U CPU with 8 GB RAM memory.
As a training and testing methodology, a simple
split method is used, where each data set is divided
into two parts with ratio 65% : 35% for training and
testing respectively. In order to obtain statistically
meaningful result, each experiment is repeated 30 ti-
mes independently, then the average of the results and
the standard deviation are reported.
Regarding the GP parameters which were used
throughout all the experiments in this paper, they are
listed in Table 3. These parameters were determined
empirically through trial runs.
5.3 Results
In this paper, all experiments are concerned with ap-
plying GP on 10 different data sets and using six dif-
ferent standardization methods. The experiments are
divided into three scenarios according to the popula-
tion size and the maximum generations parameters of
GP. In the first scenario, the population size and max-
imum generation are set to 50 and 100 respectively.
In the second scenario, the population size and maxi-
mum generation are changed to 100 and 200 respecti-
vely. The population size and maximum generation
are modified to 200 and 500 respectively in the third
scenario. The details of all scenarios are given in the
following
Scenario I
Table 4 shows the average accuracy and standard de-
viation for GP based on six different data standardi-
zation methods when the population size is 50 and
maximum generation is 100. It is noticeable that the
results of GP based on standardization methods show
higher accuracy and smaller standard deviation values
for most of the data sets (nine out of ten) than wit-
hout standardization which supports the stability and
robustness of GP based on standardization methods.
It is clear that, there is a significance difference in
average accuracy when using the standardization met-
hods. Moreover, the accuracy decreases when using
Manhattan and Z-score methods.
Rank test was used to provide an overall summary
for the influence of different standardization methods
on GP. It is used to rank the different standardization
methods applied to 10 data sets. Table 5 shows the
results of the rank test. It shows that the GP based on
Min-Max obtains the best rank (lower is better). This
confirms the ability of the GP based on Min-Max to
obtain better accuracy with less number of iterations.
Scenario II
Table 6 shows the average accuracy and standard de-
viation for GP based on six different data standardi-
zation methods when the population size is 100 and
maximum generation is 200. It is noticeable that the
the results of GP based on standardization methods
show higher accuracy and smaller standard deviation
values for most of the data sets (eight out of ten),
which supports the stability and robustness of GP ba-
sed on standardization methods. It is clear that, the
effect of standardization methods on GP was redu-
ced. Moreover, the accuracy decreases when using
Manhattan and Z-score.
Rank test was used to provide an overall summary
for the influence of different standardization methods
on GP. It is used to rank the different standardiza-
tion methods applied to 10 data sets. Table 7 shows
the results of the rank test. It shows that the GP ba-
sed on Vector obtains the best rank (lower is better).
This confirms the ability of the GP based on Vector to
obtain better accuracy with less number of iterations.
Scenario III
Table 8 shows the average accuracy and standard de-
viation for GP based on six different data standardi-
zation methods when the population size is 200 and
maximum generation is 500. It is clear that, the effect
of standardization methods on GP is not noticeable.
IJCCI 2018 - 10th International Joint Conference on Computational Intelligence
82

Table 2: List of used data sets.
Dataset No. of classes No. of features No. of data points No. of objects in each class Dataset Type
Breast Cancer Wisconsin 2 9 683 444-239 Integer
Ionosphere 2 34 351 255-126 Integer, Real
Parkinsons 2 22 195 147-48 Real
Indian Liver Patient 2 8 583 416-167 Integer, Real
Blood Transfusion Service Center 2 4 748 570-178 Real
Haberman‘s Survival 2 3 306 255-81 Integer
Mammographic Mass 2 5 830 427-403 Integer
MONK‘s Problems 2 6 432 228-204 Categorical
Connectionist Bench 2 60 208 111-97 Real
Australian Credit Approval 2 14 690 383-307 Categorical, Integer, Real
Table 3: GP Parameters.
GP Parameter Value
Elites 1
Population Size 50, 100, 200
Maximum Generations 100, 200, 500
Mutation Probability 15%
Internal Crossover Point Probability 90%
Maximum Symbolic Expression Tree Depth 15
Maximum Symbolic Expression Tree Length 15
Solution Creator Probabilistic Tree Creator
Parent Selection Method Tournament selection, size 5
Symbolic Expression Tree Grammar
Addition, Subtraction, Multiplication, Division, Sine, Cosine, Tangent, Exponential, Logarithm,
Root, Power, GreaterThan, LessThan, And, Or, Not, IfThenElse
Table 4: Accuracy results of different standardization methods for scenario I (Population size=50, Maximum generati-
ons=100).
Dataset Maximum Manhattan Min-Max Peldschus Vector Z-score Original
Breast Cancer Wisconsin 0.934 ± 0.028 0.912 ± 0.026 0.939 ± 0.019 0.923 ± 0.027 0.938 ± 0.023 0.931 ± 0.016 0.928 ± 0.019
Ionosphere 0.763 ± 0.071 0.708 ± 0.117 0.778 ± 0.063 0.789 ± 0.037 0.745 ± 0.062 0.768 ± 0.057 0.730 ± 0.124
Parkinsons 0.872 ± 0.036 0.791 ± 0.115 0.836 ± 0.017 0.819 ± 0.029 0.804 ± 0.045 0.769 ± 0.069 0.784 ± 0.068
Indian Liver Patient 0.657 ± 0.115 0.542 ± 0.200 0.677 ± 0.104 0.701 ± 0.020 0.701 ± 0.020 0.694 ± 0.037 0.704 ± 0.032
Blood Transfusion Service Center 0.760 ± 0.007 0.501 ± 0.255 0.728 ± 0.109 0.703 ± 0.142 0.755 ± 0.009 0.700 ± 0.081 0.742 ± 0.070
Haberman‘s Survival 0.737 ± 0.011 0.542 ± 0.235 0.613 ± 0.197 0.550 ± 0.228 0.705 ± 0.077 0.683 ± 0.145 0.502 ± 0.247
Mammographic Mass 0.794 ± 0.010 0.776 ± 0.057 0.781 ± 0.016 0.760 ± 0.013 0.805 ± 0.014 0.831 ± 0.028 0.830 ± 0.011
MONK‘s Problems 0.855 ± 0.069 0.732 ± 0.180 0.812 ± 0.060 0.821 ± 0.137 0.738 ± 0.116 0.790 ± 0.049 0.526 ± 0.176
Connectionist Bench 0.668 ± 0.053 0.644 ± 0.097 0.726 ± 0.041 0.614 ± 0.070 0.609 ± 0.068 0.562 ± 0.063 0.685 ± 0.066
Australian Credit Approval 0.818 ± 0.008 0.841 ± 0.076 0.858 ± 0.006 0.884 ± 0.002 0.839 ± 0.054 0.852 ± 0.036 0.856 ± 0.048
(The best values are marked in bold)
Table 5: Ranks for different standardization methods for scenario I (Population size=50, Maximum generations=100).
Dataset Maximum Manhattan Min-Max Peldschus Vector Z-score Original
Breast Cancer Wisconsin 3 7 1 6 2 4 5
Ionosphere 4 7 2 1 5 3 6
Parkinsons 1 5 2 3 4 7 6
Indian Liver Patient 6 7 5 3 2 4 1
Blood Transfusion Service Center 1 7 4 5 2 6 3
Haberman‘s Survival 1 6 4 5 2 3 7
Mammographic Mass 4 6 5 7 3 1 2
MONK‘s Problems 1 6 3 2 5 4 7
Connectionist Bench 3 4 1 5 6 7 2
Australian Credit Approval 7 5 2 1 6 4 3
Rank sum 31 60 29 38 37 43 42
Also, using the Manhattan and Z-score standardiza-
tion methods does not improve the accuracy of GP.
Moreover, the accuracy decreases when using Man-
hattan and Z-score.
Rank test was used to provide an overall summary
for the influence of different standardization methods
on GP. It is used to rank the different standardiza-
tion methods applied to 10 data sets. Table 9 shows
the results of the rank test. It shows that the GP ba-
sed on Vector obtains the best rank (lower is better).
This confirms the ability of the GP based on Vector to
obtain better accuracy with less number of iterations.
Overall, the results showed that the GP based on
Vector and Min-max standardization methods are the
best. This confirms the ability of the GP based on
Vector and Min-Max to obtain better accuracy with
The Influence of Input Data Standardization Methods on the Prediction Accuracy of Genetic Programming Generated Classifiers
83

Table 6: Accuracy results of different standardization methods for scenario II (Population size=100, Maximum generati-
ons=200).
Dataset Maximum Manhattan Min-Max Peldschus Vector Z-score Original
Breast Cancer Wisconsin 0.954 ± 0.015 0.925 ± 0.020 0.946 ± 0.029 0.956 ± 0.027 0.939 ± 0.023 0.935 ± 0.024 0.936 ± 0.021
Ionosphere 0.813 ± 0.051 0.776 ± 0.069 0.814 ± 0.052 0.594 ± 0.320 0.682 ± 0.176 0.789 ± 0.111 0.749 ± 0.196
Parkinsons 0.807 ± 0.013 0.810 ± 0.031 0.787 ± 0.023 0.851 ± 0.048 0.848 ± 0.033 0.801 ± 0.078 0.834 ± 0.033
Indian Liver Patient 0.677 ± 0.029 0.667 ± 0.092 0.704 ± 0.064 0.685 ± 0.027 0.693 ± 0.035 0.692 ± 0.054 0.711 ± 0.014
Blood Transfusion Service Center 0.767 ± 0.013 0.690 ± 0.160 0.693 ± 0.156 0.733 ± 0.112 0.747 ± 0.009 0.675 ± 0.099 0.733 ± 0.093
Haberman‘s Survival 0.721 ± 0.032 0.735 ± 0.095 0.730 ± 0.015 0.668 ± 0.081 0.754 ± 0.014 0.704 ± 0.120 0.706 ± 0.129
Mammographic Mass 0.826 ± 0.014 0.777 ± 0.027 0.802 ± 0.013 0.789 ± 0.027 0.776 ± 0.021 0.814 ± 0.009 0.784 ± 0.032
MONK‘s Problems 0.860 ± 0.099 0.776 ± 0.128 0.835 ± 0.100 0.911 ± 0.077 0.866 ± 0.076 0.812 ± 0.066 0.722 ± 0.187
Connectionist Bench 0.677 ± 0.024 0.657 ± 0.071 0.708 ± 0.070 0.726 ± 0.075 0.728 ± 0.072 0.579 ± 0.087 0.741 ± 0.051
Australian Credit Approval 0.830 ± 0.007 0.848 ± 0.010 0.854 ± 0.004 0.884 ± 0.007 0.866 ± 0.015 0.849 ± 0.007 0.845 ± 0.008
(The best values are marked in bold)
Table 7: Summarization of ranks for different standardization methods for scenario II (Population size=100, Maximum gene-
rations=200).
Dataset Maximum Manhattan Min-Max Peldschus Vector Z-score Original
Breast Cancer Wisconsin 2 7 3 1 4 6 5
Ionosphere 2 4 1 7 6 3 5
Parkinsons 5 4 7 1 2 6 3
Indian Liver Patient 6 7 2 5 3 4 1
Blood Transfusion Service Center 1 6 5 3 2 7 4
Haberman‘s Survival 4 2 3 7 1 6 5
Mammographic Mass 1 6 3 4 7 2 5
MONK‘s Problems 3 6 4 1 2 5 7
Connectionist Bench 5 6 4 3 2 7 1
Australian Credit Approval 7 6 3 1 2 4 5
Rank sum 36 54 35 33 31 50 41
Table 8: Accuracy results of different standardization methods for scenario III (Population Size=200, Maximum Generati-
ons=500).
Dataset Maximum Manhattan Min-Max Peldschus Vector Z-score Original
Breast Cancer Wisconsin 0.941 ± 0.021 0.928 ± 0.022 0.950 ± 0.018 0.940 ± 0.007 0.960 ± 0.019 0.938 ± 0.032 0.939 ± 0.022
Ionosphere 0.846 ± 0.043 0.826 ± 0.024 0.820 ± 0.043 0.792 ± 0.045 0.792 ± 0.038 0.755 ± 0.204 0.836 ± 0.120
Parkinsons 0.841 ± 0.020 0.851 ± 0.023 0.869 ± 0.035 0.851 ± 0.037 0.852 ± 0.026 0.841 ± 0.050 0.852 ± 0.035
Indian Liver Patient 0.693 ± 0.028 0.686 ± 0.079 0.722 ± 0.010 0.701 ± 0.014 0.692 ± 0.029 0.695 ± 0.034 0.707 ± 0.028
Blood Transfusion Service Center 0.776 ± 0.013 0.750 ± 0.053 0.750 ± 0.023 0.760 ± 0.030 0.763 ± 0.025 0.740 ± 0.058 0.753 ± 0.047
Haberman‘s Survival 0.736 ± 0.014 0.748 ± 0.016 0.731 ± 0.017 0.707 ± 0.065 0.757 ± 0.012 0.750 ± 0.018 0.725 ± 0.024
Mammographic Mass 0.802 ± 0.019 0.808 ± 0.014 0.822 ± 0.023 0.782 ± 0.029 0.829 ± 0.015 0.789 ± 0.020 0.827 ± 0.013
MONK‘s Problems 0.913 ± 0.095 0.822 ± 0.081 0.905 ± 0.071 0.936 ± 0.073 0.853 ± 0.089 0.845 ± 0.095 0.912 ± 0.070
Connectionist Bench 0.716 ± 0.035 0.709 ± 0.085 0.716 ± 0.046 0.730 ± 0.083 0.764 ± 0.035 0.638 ± 0.067 0.730 ± 0.030
Australian Credit Approval 0.854 ± 0.026 0.847 ± 0.006 0.875 ± 0.009 0.855 ± 0.006 0.852 ± 0.010 0.851 ± 0.010 0.840 ± 0.005
(The best values are marked in bold)
Table 9: Summarization of ranks for different standardization methods for scenario III (PopulationSize=200, MaximumGe-
nerations=500).
Dataset Maximum Manhattan Min-Max Peldschus Vector Z-score Original
Breast Cancer Wisconsin 4 7 3 5 2 6 1
Ionosphere 1 3 4 6 5 7 2
Parkinsons 5 7 1 3 6 4 2
Indian Liver Patient 6 5 1 4 2 7 3
Blood Transfusion Service Center 1 6 5 3 2 7 4
Haberman‘s Survival 4 3 5 7 1 2 6
Mammographic Mass 5 4 3 7 1 6 2
MONK‘s Problems 2 7 4 1 5 6 3
Connectionist Bench 4 6 5 2 1 7 3
Australian Credit Approval 3 6 1 2 4 5 7
Rank sum 35 54 32 40 29 57 33
fewer number of iterations. As a conclusion, The fac-
tors that influence the performance of GP at lower po-
pulation size and lower maximum number of genera-
tions are the size of the data set and standardization
method. Also, GP requires more iterations and lar-
ger population size if no standardization method was
applied.
IJCCI 2018 - 10th International Joint Conference on Computational Intelligence
84

6 CONCLUSIONS
The goal of this paper is to investigate the influence of
data standardization on the accuracy of GP classifica-
tion. To achieve this goal, three scenarios have been
implemented and tested using six different standardi-
zation methods based on ten datasets. The three sce-
narios differ in the number of population and number
of maximum generation, where scenario I has small
settings and scenario III has the largest settings.
The results of the simulations showed that by
using data standardization with GP can achieve hig-
her accuracy rates than GP without data standardiza-
tion. More specifically, by using standardization met-
hods, GP managed to achieved higher results with fe-
wer iterations and smaller population size. The best
results are obtained when using Min-Max and Vector
methods. Whereas, Manhattan and Z-Score methods
achieved worst accuracy results. Based on the three
scenarios, it can be inferred that data standardization
improve the classification accuracy of the generated
GP trees.
Our future work includes testing the effect of ot-
her GP parameters in combination with data standar-
dization, and testing the usage of GP for specific real
problems with data standardization and without.
ACKNOWLEDGEMENTS
This work has been supported in part by: Ministerio
espa
˜
nol de Econom
´
ıa y Competitividad under pro-
ject TIN2014-56494-C4-3-P (UGR-EPHEMECH),
TIN2017-85727-C4-2-P (UGR-DeepBio) and
SPIP2017-02116.
REFERENCES
Altman, E. I. (1968). Financial ratios, discriminant analy-
sis and the prediction of corporate bankruptcy. The
journal of finance, 23(4):589–609.
Anysz, H., Zbiciak, A., and Ibadov, N. (2016). The in-
fluence of input data standardization method on pre-
diction accuracy of artificial neural networks. Proce-
dia Engineering, 153:66–70.
Beyer, K., Goldstein, J., Ramakrishnan, R., and Shaft, U.
(1999). When is
¨
nearest neighbor
¨
meaningful? In
International conference on database theory, pages
217–235. Springer.
Cao, Y., Williams, D. D., and Williams, N. E. (1999). Data
transformation and standardization in the multivariate
analysis of river water quality. Ecological Applicati-
ons, 9(2):669–677.
Dheeru, D. and Karra Taniskidou, E. (2017). UCI machine
learning repository.
Griffith, L. E., Van Den Heuvel, E., Raina, P., Fortier, I.,
Sohel, N., Hofer, S. M., Payette, H., Wolfson, C.,
Belleville, S., Kenny, M., et al. (2016). Comparison
of standardization methods for the harmonization of
phenotype data: an application to cognitive measures.
American journal of epidemiology, pages 1–9.
Jabeen, H. and Baig, A. R. (2010). Review of classification
using genetic programming. International journal of
engineering science and technology, 2(2):94–103.
Kaftanowicz, M. and Krzemi
´
nski, M. (2015). Multiple-
criteria analysis of plasterboard systems. Procedia
Engineering, 111:364–370.
Kanevski, M., Pozdnukhov, A., and Timonin, V. (2008).
Machine learning algorithms for geospatial data. ap-
plications and software tools.
Koza, J. R. (1991). Evolving a computer program to gene-
rate random numbers using the genetic programming
paradigm. In ICGA, pages 37–44. Citeseer.
Koza, J. R. (1992). Genetic Programming: On the Pro-
gramming of Computers by Means of Natural Se-
lection. MIT Press, Cambridge, MA.
Sheta, A. F., Faris, H., and
¨
Oznergiz, E. (2014). Improving
production quality of a hot-rolling industrial process
via genetic programming model. International Jour-
nal of Computer Applications in Technology, 49(3-
4):239–250.
Wagner, S., Kronberger, G., Beham, A., Kommenda, M.,
Scheibenpflug, A., Pitzer, E., Vonolfen, S., Kofler, M.,
Winkler, S., Dorfer, V., and Affenzeller, M. (2014).
Advanced Methods and Applications in Computatio-
nal Intelligence, volume 6 of Topics in Intelligent En-
gineering and Informatics, chapter Architecture and
Design of the HeuristicLab Optimization Environ-
ment, pages 197–261. Springer.
Wang, H. and Zhang, J. (2009). Analysis of different data
standardization forms for fuzzy clustering evaluation
results’ influence. In Bioinformatics and Biomedi-
cal Engineering, 2009. ICBBE 2009. 3rd Internatio-
nal Conference on, pages 1–4. IEEE.
Zavadskas, E. K. and Turskis, Z. (2008). A new logarithmic
normalization method in games theory. Informatica,
19(2):303–314.
The Influence of Input Data Standardization Methods on the Prediction Accuracy of Genetic Programming Generated Classifiers
85
