
Empirical Evaluation of the Potential of Low-cost and Open Source
“On-the-Person” ECG for Cardiopathy Pre-screening
H´elio B. M. Lourenc¸o
1,2
, V´ıctor Sanfins
3
, S´ılvia Ala
4,5,6
, Francisco Barros
2,5
, Hugo P. Silva
7
and Manuel J.C.S. Reis
2,8
1
Ace Centre, Abingdon, OX14 1RG, U.K.
2
University of Tr´as-os-Montes e Alto Douro, Quinta de Prados, 5000-801 Vila Real, Portugal
3
Hospital de Guimar˜aes, Servic¸o de Cardiologia/Laborat´orio de Arritmologia, Pacing e Electrofisiologia, Portugal
4
Instituto Polit´ecnico de Braganc¸a, Departamento de Ciˆencias Sociais e Gerontologia, Portugal
5
Inst. Inves. Sanitaria Galicia Sur—Grupo de Investigaci´on en Neurociencia y Enfermedades Psiqui´atricas, Spain
6
Neurosciences and Clinical Psychology, University of Vigo, Spain
7
IT—Instituto de Telecomunicac¸ ˜oes, EST/IPS—Escola Superior de Tecnologia do Instituto Polit´ecnico de Set´ubal, Portugal
8
IEETA/Department of Engineering, Portugal
Keywords:
On-the-Person ECG, Low-cost, Open Source, Dynamic Applications, QTc, Heart Rate Variability.
Abstract:
Electrocardiographic (ECG ) data analysis can reveal crucial information about the cardiovascular physiologi-
cal phenomenon, which is modulated by the Autonomic Nervous System. Hereupon, beyond cardiovascular
diagnosis, ECG markers can also reflect workload levels, or even physical and mental performance, through
Heart Rate Variabilit y (HRV) analysis. Building upon previous work found within the stat e-of-t he-art, this pilot
research explores the potential of using a low-cost device f or cardiopathy pre-screening, through ECG signal
analysis. With the aim of performing the rhythmical analysis, we performed empirical tests from a population
of 21 control subjects in a resting position, and an additional 2 subjects, one of them in dynamic condition, i n
the scope of an exploratory research, using ECG wave segments analysis and HRV features extraction for nu-
merical analysis. Results have demonstrated that the signal quality allows reliable ECG acquisition for f urther
rhythmical and HRV analysis, in stationary and dynamic monitoring, for the bipolar leads applied. There was
also evidence to suggest a benefit from including ECG morphological analysis wit h this hardware and software
setup for prevention and diagnosis of cardiovascular disorders, although requiring further investigation.
1 INTRODUCTION
Bio-signal analysis with open source and low-cost de-
vices has been increasingly popular in the past deca-
des, as its applications are being recognize d and ex-
tensively explored by the research and industrial en-
gineering fields. The convergence of synergies bet-
ween such diverse communities has allowed multiple
enabling technolo gies to rea ch great advances in rese-
arch and pro duct development, due to the opportunity
for experimentation given by the low-cost, configura-
bility and accuracy of the current Do-it-Yourself de-
vices. Impor tantly, the development of proof of con-
cept methodo logies or prototypes for bio-signal appli-
cations can represent a great cost and time reduction
when compared to medical devices. They ca n even
be further enhanced when allied to other are as with
the same philosophy (i.e., low-cost enablers of new
knowledge and experiences), such as 3D printing.
In the landscape of low-cost devices for biome-
dical applications, BITalino (http://bitalino.com/en/)
has been described as a viable choice (Guerreiro e t al.,
2014). Beyond the hardware features, BITalino also
presents a comp rehensive range of software resour-
ces, within which particu la r attention has been given
to the ECG (Silva et al., 2014, 2011; Nˇemcov´a et al.,
2016).
Previous research led us to furth er evaluate this
device, aiming at reinforcing the pieces of evidence to
sustain the reliability f or cardiopathy p re-screening.
As such, for the purpose of this study, the numerical
data from the low-cost device has been empirically
corroborated with the data from a gold standard de-
vice, in or der to evaluate its performance. We aim to
Lourenço, H., Sanfins, V., Ala, S., Barros, F., Silva, H. and Reis, M.
Empirical Evaluation of the Potential of Low-cost and Open Source “On-the-Person” ECG for Cardiopathy Pre-screening.
DOI: 10.5220/0006962701150122
In Proceedings of the 5th International Conference on Physiological Computing Systems (PhyCS 2018), pages 115-122
ISBN: 978-989-758-329-2
Copyright © 2018 by SCITEPRESS – Science and Technology Publications, Lda. All rights reserved
115

find evidences that support th e BITalino’s reliability
for r hythmical and HRV parameters analysis in static
and dynam ic real-world applications. Furthermore,
in the scope of our preliminar y study, the data acqui-
red also sugge st promising results for cardiopathy de-
tection through morpholo gical waveform a nalysis.
For th e se purposes, a control group of 21 subjects
have been monitored with BITalino, using a bip olar
differential lead placement, at rest in supine position,
to guarantee the same conditions that have bee n previ-
ously monitored by a medical team with a gold stan-
dard device. It was also included in this study the
monitoring from two other subjec ts: in one o f the sub-
jects, namely, Subject C2, ECG waveform abnorma-
lities were detected, as well as in one of the subjects
from the control group, designated as Subject C1 a nd
referred in Section 4.1; and the other subjec t, hereaf-
ter referred to as Subject C3, has performed both ECG
monitoring at rest and during trail run, to perform a
preliminar y assessment of the behavior of BITalino in
a dynamic and real-world condition.
The re sults from the rest monitorings point to an
accurate data acquisition. Moreover, the low-cost
device also shows up -and-coming resu lts for further
rhythm ic al and H RV parameters analysis in dynami-
cal on-the-person ECG acquisition , as shown by the
results obtained in case study 3.
2 MOTIVATION
This research builds upo n a study carried out by
Silva et al. (2015), where the authors described a
taxonomy for the practicality of ECG devices, and
performed a numerical comparison of an “off-the-
person” sensor placement with a gold standard ECG
device used in clinical practice. Here, we will add
to this evidence by using BITalin o in a n “on-the-
person” approach compa ring its outpu t with a gold
standard medical device, and also by making a pre-
liminary assessment o f its performance in dynamic
applications (as described in Section 3.1 ). In the
range of non-invasive methods, “on-the-person” ap-
plications show consistent and continuous data acqui-
sition once the system is attached to the body sur-
face, allowing many different application methods.
Portable devices, such as wearables (e.g., Zio TX,
http:// www.irhythmtech.co m/products-services/zio-
xt; ActiHeart, (https://www.camnte c h.com/p roducts/
actiheart/ actiheart-overview) or even used within the
landscape of con ductive textiles (Tong et al., 2018)
can have a great impact for certain age groups that
require a particular approach to improve their adhe-
rence, such as childre n (Z hu et al., 2015) and people
with disabilities.
Regarding ECG and HRV, several studies have
been published using open source and low-cost tools,
including BITalino-based research, revealing that the
high costs of medical and state-of-the -art d evices can
be avoided for several applications (i. e. for proof-of-
concept studies and prototyping development), due to
the accuracy of such devices.
In Alves et al. (2014), BITalino’s ECG perfo r-
mance was tested against a gold standard device —
BIOPAC (https://www. biopac.com/) — aiming to in-
troduce an electrode design for paper-based inkjet
printed electrodes. With a sampling rate of 1000Hz
and 10-bit resolution set up for both devices, the expe-
rimental results showed that the devices had compara-
ble performance in Signal-to- N oise Ratio (SNR) and
Root Mean Square Error (RMSE). Also, the heartbeat
waveform morphology measured with BITalino and
BIOPAC were very close to each oth er.
Silva et al. (2015) also presented a correlation of
ECG data, acquired from 38 voluntee rs at rest, bet-
ween a medical device (Philips PageWriter Trim III
series) and the first version of BITalino, aiming to
validate the signal a cquisition accuracy for “off-the-
person” applicatio ns. The medical device used a se-
tup that included the classical 12-lead ECG place-
ment system, whilst BITalino used a single lead, in
a setup with two dry electrodes plac ed at the index
fingers. T he comparative tests showed that the “off-
the-person” ECG data had a prec ision for R-peak de-
tection above 98%, when compared to the correspon-
ding lead in the gold standard device. Additionally,
the segmentation performance and morphological wa-
veform analysis sh owed a strong correlation between
the real-world empirical data assessed for both devi-
ces, reinforcing the potential of low-cost devices.
Concernin g HRV analysis, low-cost and open
source tools have allowed a cost effective and multi-
faceted br oad level of da ta exploitation, which is usu-
ally expensive, limited a nd too generic (Mu˜noz et al.,
2017). In addition, signal post processing and HRV
analysis to extra c t time and frequ ency parameters
through numerical methods, allow the understanding
and use of these data out of lab rooms, beca use their
representation and physiological phenomena auto de-
tection is supported by th is approach (Tarvainen et al.,
2014).
PhyCS 2018 - 5th International Conference on Physiological Computing Systems
116
3 MATERIAL AND METHODS
3.1 Exploratory Study
In order to understand wh ic h leads would best suit the
purposes of our re search (i.e., future implemen tation
in sports, stress tests, or even daily life application s),
factors such as EMG noise (Levick, 2013), lead vec-
tor acco rding to the heart’s electrical condu ctive sy-
stem (Malmivuo et a l., 1995; Dubin, 2000) and lead
sensitivity for ventricular events detection (Fletcher
et al., 2013) were considered. Thus, b ipolar Modified
Chest Leads MCL
1
, MCL
6
, CM
5
; Modified L e ads I
and II; and Conventional Lead ( CL) (Francis, 2016;
Dubin, 200 0) were tested. (1) CM
5
and (2) CL leads
were selected to be used in this stud y due to: lower
EMG artifact susceptibility during limbs m ovement,
(1) R-peak detection, explicit ventricular phe nomena;
(2) lead vector with approximate alignment to the he-
art’s electrica l vector for an overview perspective.
3.2 Volunteers
The study comprised a total of 21 athletes from one
profession al male football team, who trained twice
daily. In this grou p the average age was 21.95±3.32
years old; the average height was 181.3±5.68 cm an d
the average weight was 72.3±5.81 Kg. The athele-
tes declared that they were not under pharmacological
substance that could affect the cardiac phenomenon.
Additionally, a 34 y ear old female with a known
family history of cardiovascular disease, referred to
as subject C2, and a healthy 26 year old male, desig-
nated as subject C3 participated in the study. Results
are reported in case studies 2 and 3, respectively. Sub-
ject C2 is 158 cm height and 47 Kg and subject C3 is
174 cm height an d 70 Kg.
3.3 Experimental Protocol
As part of the Experimental Protocol, all the volun-
teers were individually informed about the procedures
and aim of this study. I n order to avoid any kind of ex-
ternal bio-electrical and ele c tromagnetic interference,
impedance issues related to the skin of the volunteers
and to prop e rly pr epare the volunteers, a ll the proce-
dures and ethical principles stated by Kligfield et al.
(2007); Crawford et al. ( 1999) and the “Helsinki De-
claration of Ethics” were fo llowed. Next, the elec-
trodes were applied in a bipolar config uration using
leads CM
5
and CL.
ECG recordin g was performe d at rest in the supine
position and took place before the morning training
and after lunch , befo re the aftern oon train ing so th at
the ECG acquisition could be per formed in basal con-
ditions. Each volunteer was submitted to one ECG
recording, with a minim um duration of 2 mins, accor-
ding to the stated procedures in ESC/AHA ( 1996) for
short-monitoring HRV analysis.
3.4 Acquisition Setup
3.4.1 Hardware
We used a BITalino (r)evolution Plugged Kit, with
two ECG sensors, and 3D printed cases w ere produ-
ced to store the whole kit. The hardware set up inclu-
ded a BITalino (r)evolution main-board, power supp-
lied by a 75 0mAh capacity and 3.7V output LiPo bat-
tery, and communication over Bluetooth to our base
station — a laptop with Windows operatin g system.
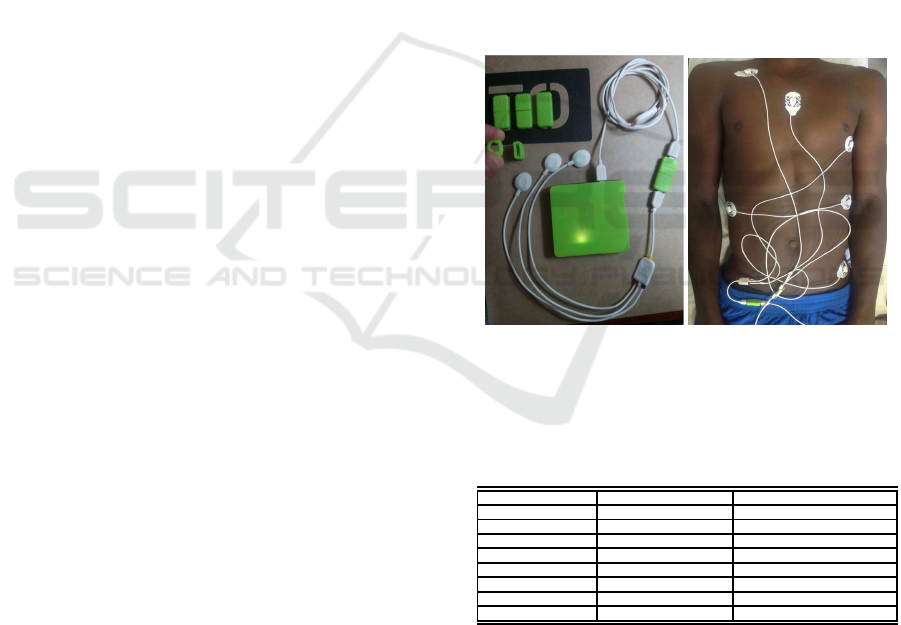
Pre-gelled Ag/AgCl elec trodes were used (see Fi-
gure 1). Tab le 1 pre sents the BITalino (r)evolution
ECG sensors specifications.
Figure 1: (left) BI Talino (r)evolution Plugged Kit (main-
board and ECG sensor connected in t he 3D printed cases);
(right) Example of the bipolar leads electrode placement in
a volunteer.
Table 1: BITalino (r)evolution ECG and BTL-08 MT PLUS
specifications.
Feature BITalino BTL-08 MT PLUS
Sampling Rate 1000Hz 2000Hz
ADC resolution 10 bit 13 bit
Gain 1100 n.a.
Range ±1.5mV (VCC = 3.3V) AC:±15.9 mV; DC:±400 mV
Bandwidth 0.5 — 40Hz 0.05 — 170Hz
Input Voltage Range ±1.65 V ±5 V
Input Impedance 7.5GΩ > 20MΩ
CMRR 86dB > 98dB
Besides our monitoring, the volunteers were sub-
mitted to ECG monitoring during the football le a gue
pre-season. This was performed using a BTL-08 MT
PLUS for the standard 12-lead ECG acquisition, in
rest.
Empirical Evaluation of the Potential of Low-cost and Open Source “On-the-Person” ECG for Cardiopathy Pre-screening
117
3.4.2 Software
BITalino’s data acquisition software was OpenSig-
nals. The recorded data was per formed at a 1 000Hz
sampling rate. The BTL-08 MT PLUS was set up for
2000Hz and had digital filters incorporated in the har-
dware — adaptable mains filter [50-60 Hz]; muscle
tremor filters for 35 Hz and 25 Hz; baselin e filters:
0.05 Hz (3.2 s), 0.11 Hz (1.5 s), 0.25 Hz (0.6 s),
0.50 Hz (0.3 s), 1. 50 Hz (0.1 s) and splin e s.
The feature extraction and automatic ECG analy-
sis for the medical device was accomplished through
the BTL CARDIOPOINT ECG C600 software, for
25 mm/s and 50 mm/s r e cording speeds and 10 mm/s
amplitude.
3.5 Data Post-processing
Although the BTL-08 MT PLUS system alre-
ady provides detailed features in the genera te d
reports, BITalino mostly performs raw data acqui-
sition, reason for which data post-processing was
needed. For raw data conversion to the correct
physical units (milliVolt), the transfer fu nction
suggested in BITalino’s manuals was imp le mented
(http://bitalino.com/datash eets/REVOLUTION ECG
Sensor Datasheet.pdf) . Further feature extraction
was performed using the BioSPPy toolbox, a set
of open source and Python -based routines for ECG
signal filtering, R-pea k detection, HR plot, waveform
template (http://biosppy.readthedocs.io/en/stable/).
The BioSPPy toolbox applies a ba nd-pass filter (3-45
Hz) and also implements Christov’s algorithm for
QRS detection (Christov, 2004). The toolbox was
adapted to obtain the standard ECG trace grid for
25mm/s recording speed and 10mm/mV amplitude,
which improves rhythmical and morphological
analysis by observation, as shown in Figure 2. For
each subject, we have extrac te d ECG traces for 5 s
and 10 s, as well as for co mplete monitoring, for raw
and filtered data, and also the segmented heartbeat
waveforms (Figures 4 & 8) an d heart rate plots
(Figure 7).
HRV feature extraction was acco mplished throu gh
OpenSignals’s add-on, from the raw data.
4 RESULTS
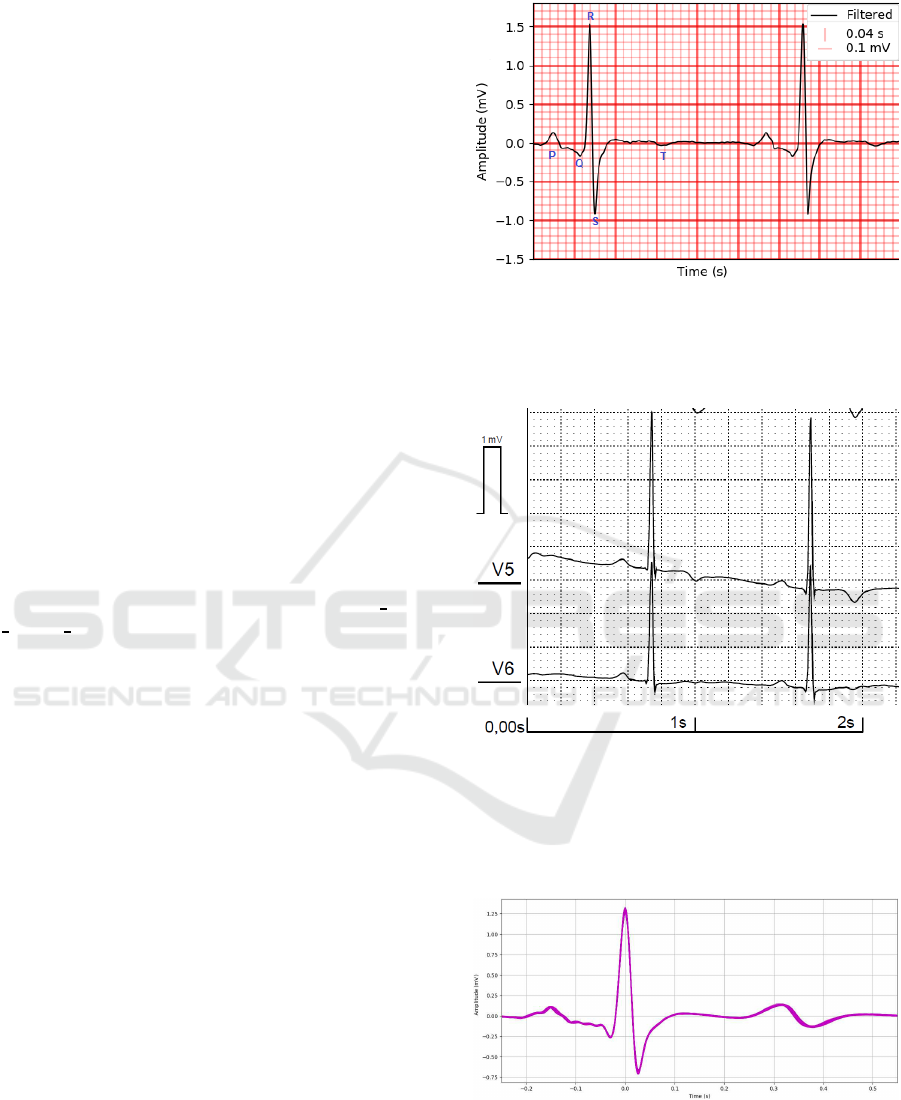
All the components of the P-QRS-T wave, segments
and intervals were detectable and the R-peaks were
explicit in all recorded ECG, as the example shown in
Figure 4.
Figure 2: Portion of the E CG trace with P-QRS-T waveform
identified in Subject C1 using lead CM
5
(Section 4.1, be-
low). The inverted T wave and ECG tr ace grid develo-
ped are also represented. Graphical representation extracted
from BioSPP y.
Figure 3: Portion of ECG trace for lead V
5
and V
6
re-
corded for Subject C1 adapted from BTL CARDIOPOINT
ECG C600 reports, with a recording speed of 25 mm/s and
10 mm/mV amplitude. This portion of the ECG tr ace evi-
dences the i nverted T wave detected by the gold standard
device.
Figure 4: Example of a set of segmented heartbeat wa-
veforms extracted from the complete ECG monitoring f or
Subject S20 (171.2 s), using lead CL. This graphical repre-
sentation, extracted from the BioSPPy toolbox, represents
the overlap of all (168) filtered P-QRS- T segments template
where the absence of artifacts can be observed.
PhyCS 2018 - 5th International Conference on Physiological Computing Systems
118
The ECG acquisition for the ath le tes was perfor-
med in d ifferent days, due to the time required by the
hardware setup procedures that would affect athele-
tes training plan, as well as the medical team availa-
bility for extra days required. Althoug h, the mon i-
toring with the low-cost device was accomplished in
following days, so the physiological condition of the
volunteers could be, theoretically, similar. For these
reasons, the data collected could not be synchronized
between both devices. Also, the medical team only
provide us the ECG reports, instead of the digital data,
which ha s restricted the d ata analysis compon e nt of
our work.
Nonetheless, further analysis of ECG traces f rom
both d evices, namely, the Corrected QT Interval
(QTc) for the heart rate was performed for all athle-
tes (Table 2). The lead selectio n for scalar absolut
QT interval measurement was accomplished accor-
ding to the clinical procedures for th e classic 12- le a d
ECG, where the selected lead re presents the wider
QT interval within the 12 leads. We have followed
the same pro cedure for the modified leads, acquired
with BITalino. Afterwards, Bazett’s correction for-
mula (QTc = QT /
√
RR [sec]) (Postema and Wilde,
2014) was implemented to return the QTc values.
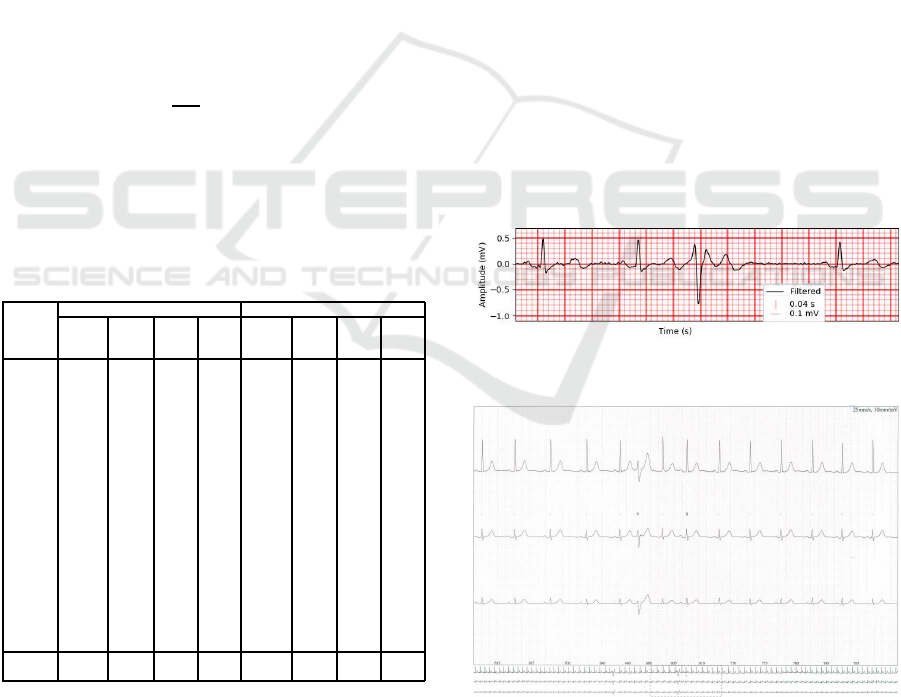
Table 2: This table presents QTc values and respective ab-
solute QT and RR intervals, through ECG trace scalar mea-
surement. As well as the average RR intervals for t he com-
plete monitoring of both devices, which was obtained f rom
OpenSiganls and BTL CARDIOPOINT ECG C600 auto-
mated extraction.
BITalino (r)evolution BTL-08 MT PLUS
Subject QT
(s)
RR
(s)
QTc
(ms)
AVG
RR
(ms)
QT
(s)
RR
(s)
QTc
(ms)
AVG
RR
(ms)
S1 0.44 1.04 431 1052 0.4 1.4 338 1333
S2 0.44 1 440 947 0.36 0.86 388 857
S3 0.42 0.92 438 887 0.38 0.86 410 845
S4 0.44 1.04 431 973 0.44 1.12 416 1053
S5 0.48 1.46 397 1433 0.44 1.4 372 1395
S6 0.46 1.16 427 1089 0.44 1.26 392 1224
S7 0.44 1.06 427 1011 0.4 0.88 426 857
S8 0.46 1.04 451 1007 0.4 0.9 422 938
S9 0.4 0.96 408 880 0.36 0.92 375 896
S10 0.44 1.16 409 1086 0.36 0.7 430 706
S11 0.44 0.98 444 940 0.44 0.94 454 1000
S12 0.48 1.2 438 1364 0.44 1.08 423 1091
S13 0.44 1.14 412 1163 0.42 1.4 355 1395
S14 0.42 0.98 424 967 0.4 1.04 392 1000
S15 0.42 1.18 387 1008 0.38 1.32 331 1224
S16 0.44 1.56 352 1434 0.42 1.52 341 1395
S17 0.5 1.22 453 1209 0.46 1.34 397 1277
S18 0.44 1.16 409 1162 0.42 1.52 341 1463
S19 0.4 1.2 365 1029 0.38 0.96 388 938
S20 0.48 1 480 1191 0.44 1 440 1034
S21 0.52 1.44 433 1313 0.44 1.3 386 1224
AVG 0.44 1.14 427 1052 0.42 1.08 392 1053
SD 0.0306 0.172 29.55 169.5 0.0314 0.248 35 .77 221.8
The following subsections describe the case stu-
dies b ased on ECG monitoring using BITalino, gui-
ded throug h the sam e protoco l and tools as the main
group of 21 volunteers, including possible cardio-
pathy events for the c ontrolled group. Even though
the aim of this study was to assess BITalino ’s reliabi-
lity for rhythmic analysis, curious evidences in wave
morphology were detected and are discussed in furt-
her detail below.
4.1 Case 1 — Inverted Polarity in T
Wave
In the ECG acquisition in one of th e athletes, Subject
C1, an abnormal waveform was detected (Figure 2).
This fact was em pirically corr oborated using the data
from the medical device, which showed that th e in-
verted pola rity of the T wave was also de tected by
BTL-08 MT PL US in precordial leads V
5
and V
6
(Fi-
gure 3), but also in lead V
4
. This evidence may sug-
gest a variety of c a rdiac disorde rs, although further
clinical an alysis ( i.e., echography) will have to be per-
formed, to accomplish a proper diagnostic and to ex-
clude ECG pattern altera tions related to different phy-
sical activities or certain age, gender or race groups
(Drezner et al., 2013; Macfarlane et al., 2014).
4.2 Case 2 — Extrasystole Detection
During the exploratory phase of this study, Lead I —
an Eithoven-like setup with two electrodes placed on
the wrists, for ECG monitoring in an upright seated
position — has been tested in Subject C2.
Figure 5: Portion of ECG strip showing extrasystole de-
tected by BITalino, on Lead I, for Subject C2.
Figure 6: Extrasystole detected during the Holt er exam, re-
corded at 25 mm/s of speed and 10 mm/mV in amplitude.
During the ECG monitoring, acquired with BITa-
lino, abnormal events were de te cted and later confir-
med by a trained physician, who advised the subject
Empirical Evaluation of the Potential of Low-cost and Open Source “On-the-Person” ECG for Cardiopathy Pre-screening
119
to be further examined at the local cardiology ser-
vice. As a result, Subject C2 has performed a Holter
exam — using a NovaCor device and HolterSoft Ul-
tima V2.4.4 software — in which the medical team
diagnosed extrasystoles. Afterwards, we investigated
the results obtained in both tests, which can be obser-
ved in Figures 5 & 6.
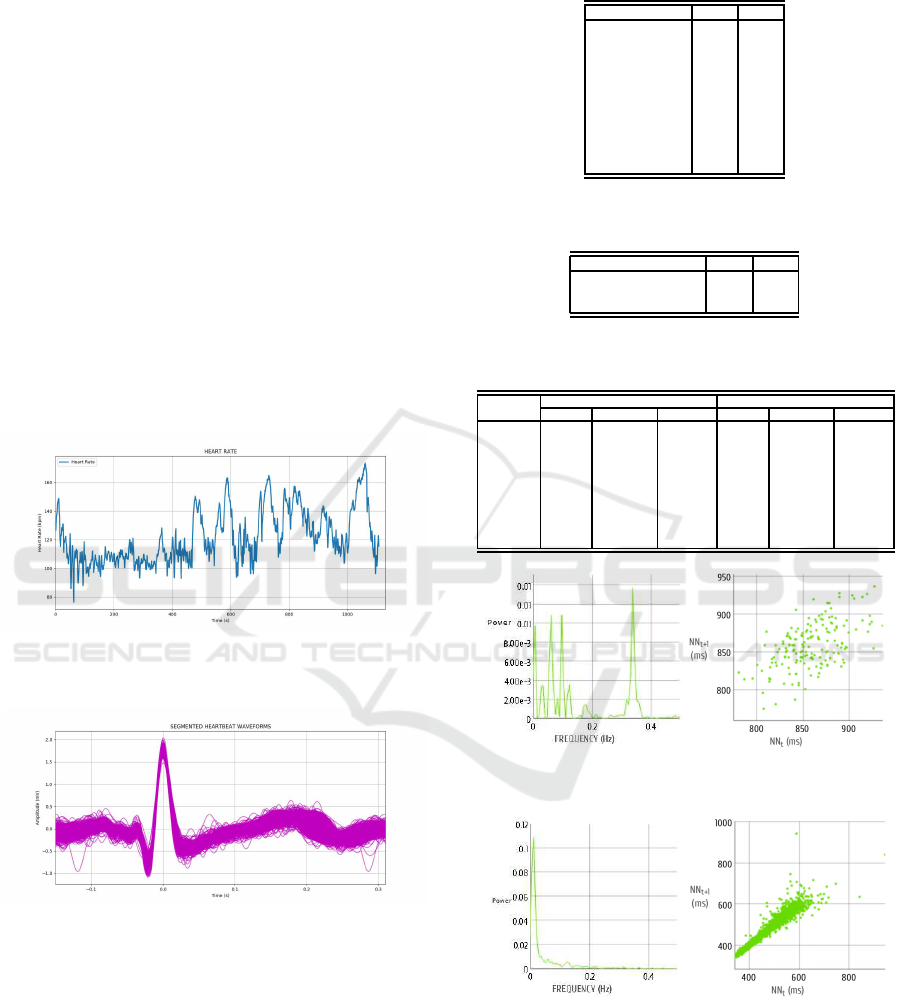
4.3 Case 3 — HRV Analysis
Subject C3 perf ormed ECG acquisition at rest and
during trail running, in the scope of the exploratory
phase of this study. T he ha rdware set up was attached
to the subject’s clothes using a 3D printed clip, and
the cables and electrodes were fixed with an elastic
net tube bandage. An Android smartphone was used
as the base station. Figure 7 represents the HR graph,
during a portion of the trail run, which coincide d with
the end of the run. In Figu re 8, the segmented in-
dividual heartbeat waveforms are represented for the
overall run.
Figure 7: Portion of approximately 18 mins (1108.4 s) for
HR analysis. Graph extracted through the BioSPPy toolbox
for Subject C3, during a trail running.
Figure 8: Segmented heartbeat waveforms for Lead
CM
5
during the tr ail running, for approximately 18 min
(1108.4 s). Signal filtered and graph generated using Bi-
oSPPy.
5 DISCUSSION
The exploratory study with Subject C3 has revealed
that even under upper limbs and trunk muscles con-
traction, as well as in the presence of perspiration
and all the evoked potentials spre a d by the muscular
groups surrounding th e electrodes, the R-peaks can be
Table 3: HRV time parameters extracted from CM
5
lead for
Subject C3.
Time parameter Rest Run
Min. NN (ms) 775 344
Max. NN (ms) 937 945
Avg. NN (ms) 858 492
SD NN (ms) 30 74
rMSSD (ms) 28 21
NN20 99 389
pNN20 (%) 58 17
NN50 11 61
pNN50 (%) 6 2
Avg. IHR (BPM) 69 121
SD IHR (BPM) 2 19
Table 4: HRV non-linear parameters extracted from CM
5
lead for Subject C3.
Non-linear parameter Rest Run
SD1 (ms) 20 15
SD2 (ms) 39 104
SD1/SD2 0.51 0.14
Table 5: HRV frequency parameters extracted from CM
5
Lead for Subject C3.
Parameter
Rest Run
VLF LF HF VLF LF HF
Frequency
(Hz)
0–0.04 0.04–0.15 0.15–0.4 0–0.04 0.04–0.15 0.15–0.4
Peak
(Hz)
0.007 0.062 0.338 0.012 0.06 0.152
Power
(ms
2
)
122 307 300 1890 472 227
Power
(%)
17 42 41 73 18 9
Power
(n.u.)
– 51 49 – 68 32
Figure 9: Power spectral density (PSD) (left) and Poincar´e
(right) plots for S ubject C3 during rest.
Figure 10: Power spectral density (PSD) (left) and Poincar´e
(right) plots for S ubject C3 during trai l run.
effectively detected by Lead CM
5
for long dynamic
monitoring, as shown in Figures 7 & 8.
Regarding the QTc measuremen t, procedures
found in the state-of-ar t and clinical practice stipu-
late tha t this measurements sho uld be performe d by
using the classic 12-lead ECG analysis. However, the
PhyCS 2018 - 5th International Conference on Physiological Computing Systems
120

results from the modified leads show approx imated
values. Further investigation is needed to evaluate if
a range of appropriate cut-off values allows ac c urate
diagnosis from QTc values obtained from modified
leads.
Even though there is a historical non-consensual
objectivity for HRV p arameters analysis (Trimmel
et al., 2015), there are emerging pieces of evidence
that support its use for prevention and/or monitoring
of mental, phy sical and physio logical health c onditi-
ons (Hughes e t al., 2010; Taelman et al., 200 9), as
well as in sports for physical and mental performance
improvement (Pec¸anh a et al., 2013; Dong, 2016).
HRV parameters for th e control group (Table 6),
the overall average values for rest acquisition sugge -
sted a good level of parasympathetic predominance.
However, there were some cases th at would have gre -
atly benefited from continuous monitoring to improve
the sympathovagal balance , and further physical per-
formance improvemen t. It is important to note that
the measures were acquired in the beginnin g of the
football season, which meant that some of the athle-
tes were just restarting their professional training an d
the physical performance was n ot at its peak. HRV
analysis must be regular, so the data can support con-
sistent results and avoid events that can change the
physiological phenomena.
Table 6: The overall average values of HRV parameters for
the control group, extracted from CL (the value of 8.1 for
the LF/HF ratio is an isolated value).
SD
NN
(ms)
AVG
IRH
(BPM)
SD
IHR
(BPM)
LH / HF
ratio
SD1/SD2
Min. 30 41 1 0.2 0.19
Max. 162 68 7 8.1 1.13
Average 79 55 3.7 1.14 0.64
By analyzing HRV parameters in rest and during
trail running (Tables 3, 4 & 5) for Subject C3, we
observed the sympa thetic predominance during exe-
rcise. The physical need s of the body during the ae-
robic exercise (i.e., oxygen a bsorption and car bon di-
oxide excretion, energy consumption, etc.) were re-
flected in LF predominance, besides HR increm e nt,
which increased the LF/HF ratio — PSD graphs in
Figures 9 & 10 present the LF predomin a nce during
exercise.
Also, the non-linear parameters showed the same
sympathovagal balance alteration. During exercise
the rMSSD had also decreased, due to the decrea-
sing parasympathetic activity. As stated by Dong
(2016), we confirmed the regularity of the heart be-
ats and sympa thetic predominance during exercise, as
demonstra te d in the Poincar´e plots in Figures 9 & 10.
6 CONCLUSIONS AND FUTURE
WORK
We have presen ted an evaluation of a low-cost and
DiY device when compar e d to a medical-grade sy-
stem to assess the potential of the f ormer for car di-
opathy pre-scr eening, by performing tests in a total
population of 23 subjects. Results have demonstrated
that the sig nal quality allows reliable ECG acquisition
for further rhythm and HRV analysis, in stationary
and dynamic monitoring, using the bipolar leads sen-
sor configuration. Also, we found evidence to support
the use of ECG morphological analysis in prevention
and diagnosis of cardiac diso rders.
From a rhythmical point of view, the low-cost
device has shown promising results. The case stu-
dies discussed and the results obtained also motivated
our team to investigate BITa lino’s potential consis-
tency for abnormal waveform pattern detection in se-
vere pathologies and d emanding environmental con-
ditions, towards its maximum usability for rhythmical
and morpholog ic al ECG analysis.
In the future, we a im to further test the reliabi-
lity of BITalino to monitor subjects with diagno sed
rhythm ic al cardiac disorders, both during rest and
stress tests. Patients will be monitored with a syn-
chronize d go ld standard device, in order to assess the
accuracy that can be achieved with BITalino. We will
evaluate the rhythmical analysis, including HRV for
continuous monitor ing, and wave morpholo gy analy-
sis in this context. With the synchronized acquisition
setup, we will also be able to determine whether a cut-
off value can be set for QTc measurement accuracy
with modified leads. I n addition, other bipolar lead s
will be explored to attain different electrical le ad vec-
tors, so the analysis of the heart atr ia can be improved,
as well as new approache s for LF/HF ratio analysis
that can better track mental and emotional states, in a
similar fashion to the method developed by von Ro-
senberg et al. (2017).
REFERENCES
Alves, A. P., Martins, J., Sil va, H. P., Lourenc¸o, A., Fred,
A., and Ferreira, H. (2014). Paper-based inkjet elec-
trodes. In Silva, H. P., Holzinger, A., Fairclough, S.,
and Majoe, D., editors, Physiological Computing Sys-
tems, pages 59–70. Springer Berlin Heidelberg.
Christov, I. I. (2004). Real time electrocardiogram QRS
detection using combined adaptive threshold. Biome-
dical engineering online, 3(1):28.
Crawford, M. H., Bernstein, S. J., Deedwania, P. C., Di-
Marco, J. P., Ferrick, K. J., Garson, A., Green, L. A.,
Greene, H. L., Silka, M. J., Stone, P. H., Tracy, C . M.,
Empirical Evaluation of the Potential of Low-cost and Open Source “On-the-Person” ECG for Cardiopathy Pre-screening
121

Gibbons, R. J., Alpert, J. S., Eagle, K. A., Gardner,
T. J., Garson, A., Gregoratos, G., Russell, R. O., Ryan,
T. J., and Smith, S. C. (1999). ACC/AHA guidelines
for ambulatory electrocardiography: Executive sum-
mary and recommendations. Circulation, 100(8):886–
893.
Dong, J.-G. (2016). The role of heart rate variability in
sports physiology. Experimental and Therapeutic Me-
dicine, 11(5):1531–1536.
Drezner, J. A., Ackerman, M. J., Anderson, J., Ashley, E.,
Asplund, C. A., Baggish, A. L., B¨orjesson, M., Can-
non, B. C., Corrado, D. , DiFiori, J. P., Fischbach, P.,
Froelicher, V., Harmon, K. G., Heidbuchel, H., Marek,
J., Owens, D. S., Paul, S., Pelliccia, A., Prutkin, J. M.,
Salerno, J. C., Schmied, C. M., Sharma, S., Stein, R.,
Vetter, V. L., and Wilson, M. G. (2013). Electrocardio-
graphic interpretation in athletes: the ‘seattle criteria’.
British Journal of Sports Medicine, 47(3):122–124.
Dubin, D. (2000). Rapid interpretation of EKG’s: an i nte-
ractive course. Cover Pub. Co, USA, 6th edition.
ESC/AHA (1996). Heart rate variability. Circulation,
93(5):1043–1065.
Fletcher, G. F., Ades, P. A., Kligfield, P., Arena, R., Balady,
G. J., Bittner, V. A ., Coke, L. A., Fleg, J. L., Forman,
D. E., Gerber, T. C., Gulati, M., Madan, K., Rhodes,
J., Thompson, P. D., and Williams, M. A. (2013). Exe-
rcise standards for testing and training. Circulation,
128(8):873–934.
Francis, J. (2016). ECG monitoring leads and special le-
ads. Indian Pacing and Electrophysiology Journal,
16(3):92 – 95.
Guerreiro, J., Lourenc¸o, A., Silva, H., and Fred, A. (2014).
Performance comparison of low-cost hardware plat-
forms targeting physiological computing applications.
Procedia Technology, 17:399 – 406. Conf. on Electro-
nics, Telecom. & Computers (CETC 2013).
Hughes, J. W., Casey, E., Doe, V. H., and Glickman, E. L.
(2010). Depression and heart rate variability in cardiac
rehabilitation patients: Exploring the r oles of physi-
cal activity and fitness. Perceptual and Motor Skills,
111(2):608–624.
Kligfield, P., Gettes, L. S., Bailey, J. J. , Childers, R., Deal,
B. J., Hancock, E. W., van Herpen, G., Kors, J. A.,
Macfarlane, P., Mirvis, D. M., Pahlm, O., Rautaharju,
P., and Wagner, G. S. (2007). Recommendations for
the standardization and interpretation of the electro-
cardiogram. Circulation, 115(10):1306–1324.
Levick, J. (2013). An Introduction to Cardiovascular Phy-
siology. Elsevier Science.
Macfarlane, P. W., Katibi, I. A., Hamde, S. T., Singh, D.,
Clark, E. B., Devine, B., Francq, B. G., Lloyd, S. A.,
and Kumar, V. (2014). Racial differences in the ECG–
selected aspects. Journal of electrocardiology, 47
6:809–814.
Malmivuo, P., Malmivuo, J., and Pl onsey, R. (1995). Bioe-
lectromagnetism: Principles and Applications of Bi-
oelectric and Biomagnetic Fields. Oxford University
Press.
Mu˜noz, J., Gouveia, E., Cameir˜ao, M., and Berm´udez i Ba-
dia, S. (2017). Physiolab - a multivariate physiological
computing toolbox for ECG, EMG and EDA signals:
a case of st udy of cardiorespiratory fitness assessment
in the elderly population. Multimedia Tools and Ap-
plications, pages 11521–11546.
Nˇemcov´a, A. , Marˇs´anov´a, L., Smisek, R., Vitek, M., and
Kol´aˇrov´a, J. (2016). Recommendations for ECG
acquisition using BITalino. In EEICT C onf., pages
543–547.
Pec¸anha, T., de Paula-Ribeiro, M., Nasario-Junior, O., and
de Lima, J. R. P. (2013). Post-exercise heart rate vari-
ability recovery: a time-frequency analysis. Acta Car-
diologica, 68(6):607–613.
Postema, P. G. and Wilde, A. A. (2014). The measure-
ment of the QT interval. Current Cardiology Reviews,
10(3):287–294.
Silva, H., Lourenc¸o, A., Fred, A. L. N ., and Martins,
R. C. M. (2014). BIT: Bi osignal igniter toolkit.
Computer Methods and Programs in Biomedicine,
115(1):20–32.
Silva, H., Lourenc¸o, A., and Paz, N. (2011). Real-time bio-
signal acquisition and telemedicine platform for AAL
based on Android OS. In Int. Living Usability Lab
Workshop on AAL Latest Solutions, Trends and Appli-
cations.
Silva, H. P., Carreiras, C., Lourenc¸o, A., Fr ed, A., Neves,
R. C., and Ferreira, R. (2015). Off-the-person elec-
trocardiography: performance assessment and clinical
correlation. Health and Technology, 4(4):309–318.
Taelman, J., Vandeput, S., Spaepen, A., and Van Huffel, S.
(2009). Influence of mental stress on heart rate and
heart rate variability. In Vander Sloten, J., Verdonck,
P., Nyssen, M., and Haueisen, J., editors, 4th Euro-
pean Conf. Int. Federation for Medical and Biological
Eng., pages 1366–1369.
Tarvainen, M. P., Niskanen, J.-P., Lipponen, J. A., Ranta-
aho, P. O., and K arjalainen, P. A. (2014). Kubios HRV
– heart rate variability analysis software. Computer
Methods and Programs in Biomedicine, 113(1):210 –
220.
Tong, W., Kan, C., and Yang, H. (2018). Sensitivity analysis
of wearable textiles for E CG sensing. In Proc. Int.
Conf. I EEE EMBS on Biomedical Health Informatics
(BHI), pages 157–160.
Trimmel, K., Sacha, J., and Huikuri, H. (2015). Heart Rate
Variability: Clinical Applications and Interaction bet-
ween HRV and Heart Rate. Frontiers Research Topics.
Frontiers Media SA.
von R osenberg, W., Chanwimalueang, T., Adjei, T., Jaffer,
U., Goverdovsky, V., and Mandic, D. P. (2017). Re-
solving ambiguities in the LF/HF ratio: LF-H F scat-
ter plots for the categorization of mental and physical
stress from HRV. Frontiers in Physiology, 8:360.
Zhu, Z., Liu, T., Li, G., Li, T., and Inoue, Y. (2015). Weara-
ble sensor systems for infants. Sensors, 15(2):3721–
3749.
PhyCS 2018 - 5th International Conference on Physiological Computing Systems
122
