
Research on Numerical Simulation and Energy Conservation
Evaluation of Wind Energy Utilization in the Atrium
Ting Chen, Shiquan He, Lixiu Yang, Fanghui Du, Chao Li, Yi Qin and Xiaoqing Zhou
*
Academy of Building Energy Efficiency of Guangzhou University, Guangzhou University, Guangzhou, China
Guangdong Provincial Key Laboratory Building Energy Efficiency and Application Technologies, Guangzhou, China
{2316705808, 407137558}@qq.com
Keywords: Numerical simulation, energy conservation evaluation, wind energy utilization, atrium.
Abstract: For the special building structure of tall atrium, the air distribution characteristics of atrium under natural
ventilation were calculated by CFD numerical simulation method, and the energy-saving rate of natural
ventilation was evaluated as well. By changing the area and position of outlet vents, the variation rules of
temperature, PMV, ventilation efficiency and air changes under different combinations of vents were
obtained. Besides, we estimated the energy-saving efficiency of natural ventilation during the transitional
season by comparing with the previous studies. And the results showed that: the higher the position or the
larger the area of the exhaust vents is, the higher the efficiency of wind energy utilization is, the more
benefits we get to improve indoor thermal environment and air quality as well as human comfort. In the
transition season, the combination of natural ventilation and air conditioning system is more conducive to
energy saving than the whole air conditioning system, and the energy-saving rate can reach more than
62.9%.
1 INTRODUCTION
Natural ventilation is a quite important air
conditioning technology. It helps reduce building
energy consumption and solve the problem of indoor
thermal environment and air quality. In natural
ventilation system, thermal pressure and wind
pressure promote ventilation of the atrium in a
building. Natural ventilation is widely used in high-
rise buildings. Due to the large and high atrium, the
influence of solar radiation on ventilation is obvious,
and compared with general small buildings, the
indoor thermal environment of high-rise buildings
has a greater instability.
Currently, the studies on the wind energy
utilization of atrium building mainly focus on the
following aspects: JK Yang (JK Yang, X Zhang,
2005) simulated the indoor temperature field of
atrium with double-glazing curtain wall and
obtained the best natural ventilation time under
different indoor loads. Y Cheng (Y Cheng, YG
Song, 2015) verified the feasibility of air
conditioning system design in a practical case by
simulating the temperature field and velocity field in
the air-conditioned area of atrium in a mall during
summer. HY Zhao (HY Zhao, CZ Meng, 2010)
studied the the relationship between natural
ventilation and window area as well as windows
position in the tall atrium with doors closed and
window opened, in order to study the best window
size and location. By comparing the indoor thermal
environment conditions of the upper side wall
opening and the top opening of the large space
building, X Wang (X Wang, C Huang, 2005) found
that the opening at the top is more conducive to the
improvement of the indoor thermal environment
during the air-conditioning season.
Thus, researches on the ventilation effect of
atrium by scholars are mostly confined to discussing
the atrium structure in the form of a single outlet
vent in the air conditioning season. For the
combined exhaust outlet under natural ventilation,
such as adopting the upper and lower exhaust
ventilation at the same time, the effects of
ventilation and energy-saving are not overstated. In
this paper, by using the PHOENICS 2016 simulation
software and the k-ɛ two-equation turbulence model,
the atrium airflow characteristics of 12 different
combinations of vents are calculated under the
condition of half-open door in natural ventilation.
The distribution of temperature, PMV, ventilation
efficiency and ventilation frequency are also be
Chen, T., He, S., Yang, L., Du, F., Li, C., Qin, Y. and Zhou, X.
Research on Numerical Simulation and Energy Conservation Evaluation of Wind Energy Utilization in the Atrium.
In 3rd International Conference on Electromechanical Control Technology and Transportation (ICECTT 2018), pages 51-58
ISBN: 978-989-758-312-4
Copyright © 2018 by SCITEPRESS – Science and Technology Publications, Lda. All rights reserved
51
analyzed to study the best wind energy utilization
effect. At the same time, the energy-saving rate of
natural ventilation in atrium in transition season is
evaluated.
2 NUMERICAL SIMMULATION
2.1 Physical Model
Located in Zhuhai, Guangdong, the building is a
children's playground with atrium, which covers an
area of 31,900m
2
with a height of 41.82m and a total
of two floors. The atrium belongs to the core atrium
with length, width and height of about
132m×88m×41m. The second floor activity area is a
circle of extensional walkways along the wall with
an area of about 8583m
2
. The center of the roof is an
arched transparent glass with a radius of 40m and a
net height of 5.85m, and the side of the glass is a
membrane material sloping roof with an area of
about 32,200m
2
. The forms of vents are the circular
vents at the top and the side vents at the junction of
glass and membrane material roof, respectively.
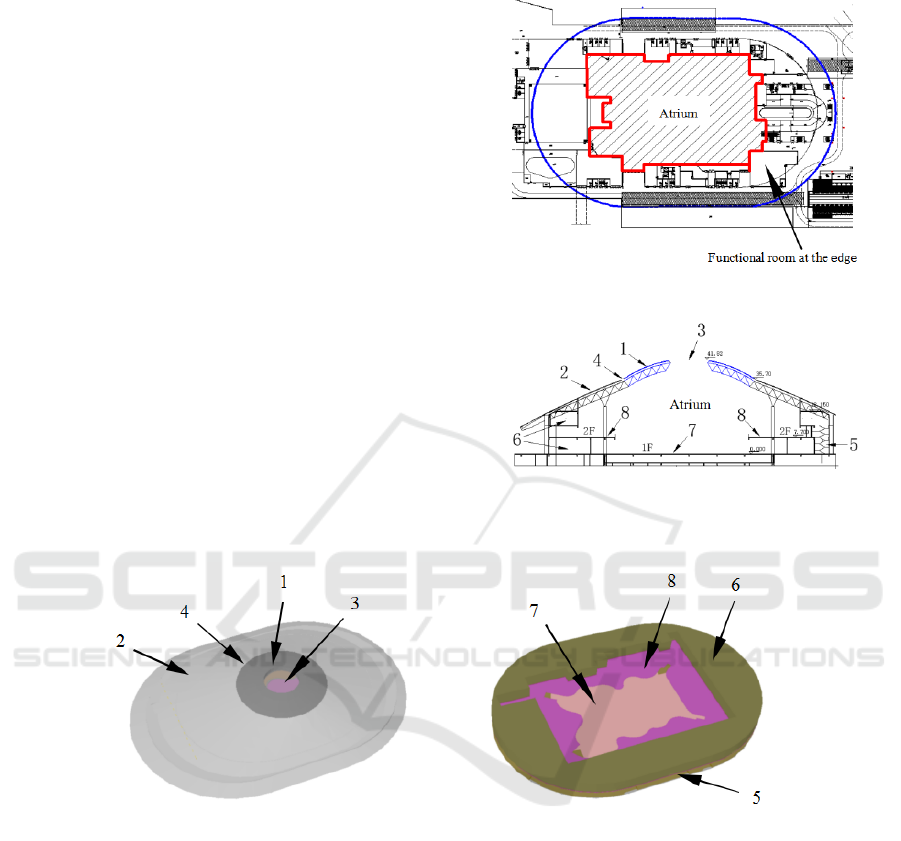
Fig. 1 and 2 is a plan and section view of the
building, and Fig. 3 is a simplified building model
for simulation.
Figure 1: Floor plan.
Figure 2: Building cross-sectional view.
Figure 3: Building simplification model.
1- Round glass roof, 2- Slope roof of the
membrane material, 3- Circular exhaust vent at the
top (in the middle of the glass roof), 4- Annular
exhaust vent in the side (at the junction of 1 and 2),
5- Inlet vent (doorway and windows of first and
second floor), 6- Functional room on the edge of the
atrium, 7- First floor staff activities area, 8- The
second floor staff activity area.
2.2 Mathematical Model
The PHOENICS 2016 software is used to simulate
the calculation. The k-ɛ two-equation turbulence
model is chosed to solve the indoor flow field.
Ideal fluid model and Boussinesq assumption are
used, too. The SIMPLE algorithm and the second-
order upwind scheme are adapted to calculate the
flow field. Besides, instead of using the solar
radiation model, this paper converts solar radiation
heat into a specific heat source located below the
glass roof and on the atrium floor.
ICECTT 2018 - 3rd International Conference on Electromechanical Control Technology and Transportation
52
2.3 Boundary Conditions
Indoor heat source mainly considers the body heat,
equipment heat, lighting and solar radiation. And all
types of heat sources are set according to the
standard values in the specification. The main design
parameters are: total personnel heat output
480.67kW; light heat 223.68kW; equipment heat
559.20kW; solar radiation heat 1242kW.
The wet source only comes from the human body,
the amount is 240g/h·p (moderate labor), and the
cluster factor is 0.85, so the total amount of wet is
324.50g/s.
According to the statistics of Zhuhai
Meteorological Bureau for several years, the average
outdoor air temperature is about 22 ℃ and the
relative humidity is about 85% in the hot summer
and warm winter zone in transition season (spring).
Due to the uncertainty of outdoor wind speed and
direction, this study only considers the effect of
natural ventilation under thermal pressure.
2.4 Mesh
The method of using an evenly distributed grid
which may far beyond the load that the computer
can carry is unreasonable. Therefore, this paper uses
the method of grid local encryption to carry out
special treatment to the location of the inlet and
outlet and the key area of study. Because the models
of various conditions are different, the number of
grids is slightly different with the number between
712800~977400.
The convergence criterion is that the ratio of the
residual value of the last iteration to the previous
residual value is less than 10e
-3
.
2.5 Simulation conditions
The experiment simulates the combination of three
kinds of exhaust port position and four different
exhaust port area in the atrium under natural
ventilation, and the specific conditions are shown in
Table 1:
Table 1: List of conditions.
Condition Top vent area (m
2
) Side vent area (m
2
) Description
Full top opening
100 0
The top air outlet is located in the
center of the circular glass roof,
whose shape is a circle.
The side vent is located at the
junction of the glass roof and the roof
of the membrane material, with a
position of 35.7m and a ring shape.
Inlet vent is the door and window
of the first and second floor, with a
total area of about 500m
2
.
250 0
500 0
750 0
Full side opening
0 100
0 250
0 500
0 750
The opening areas of the
top and side are in equal
measure
50 50
125 125
250 250
375 375
3 SIMULATION RESULTS AND
ANALYSIS
3.1 Indoor Temperature and PMV
Analysis
Through simulating of software and visualization of
the results, the temperature and PMV of each
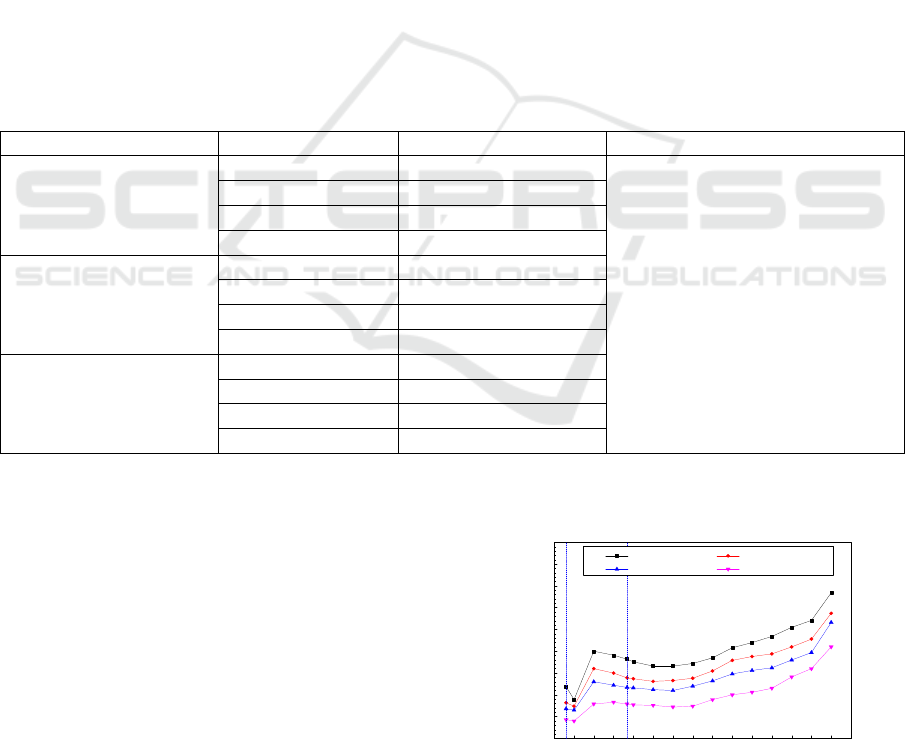
solution are obtained as shown in Fig. 4 to Fig. 8.
The personnel activity area is located in the position
that 1.5m vertically from the floor, which is the
average height of the person's head.
Figure 4: The highest temperature of full top opening
condition.
0.0 2.5 5.0 7.5 10.0 12.5 15.0 17.5 20.0 22.5 25.0 27.5 30.0 32.5 35.0 37.5
25.0
25.5
26.0
26.5
27.0
27.5
28.0
28.5
29.0
29.5
The highest temperature
(℃)
hei
g
ht
(
m
)
Opening area 100m
2
Opening area 250m
2
Opening area 500m
2
Opening area 750m
2
Research on Numerical Simulation and Energy Conservation Evaluation of Wind Energy Utilization in the Atrium
53
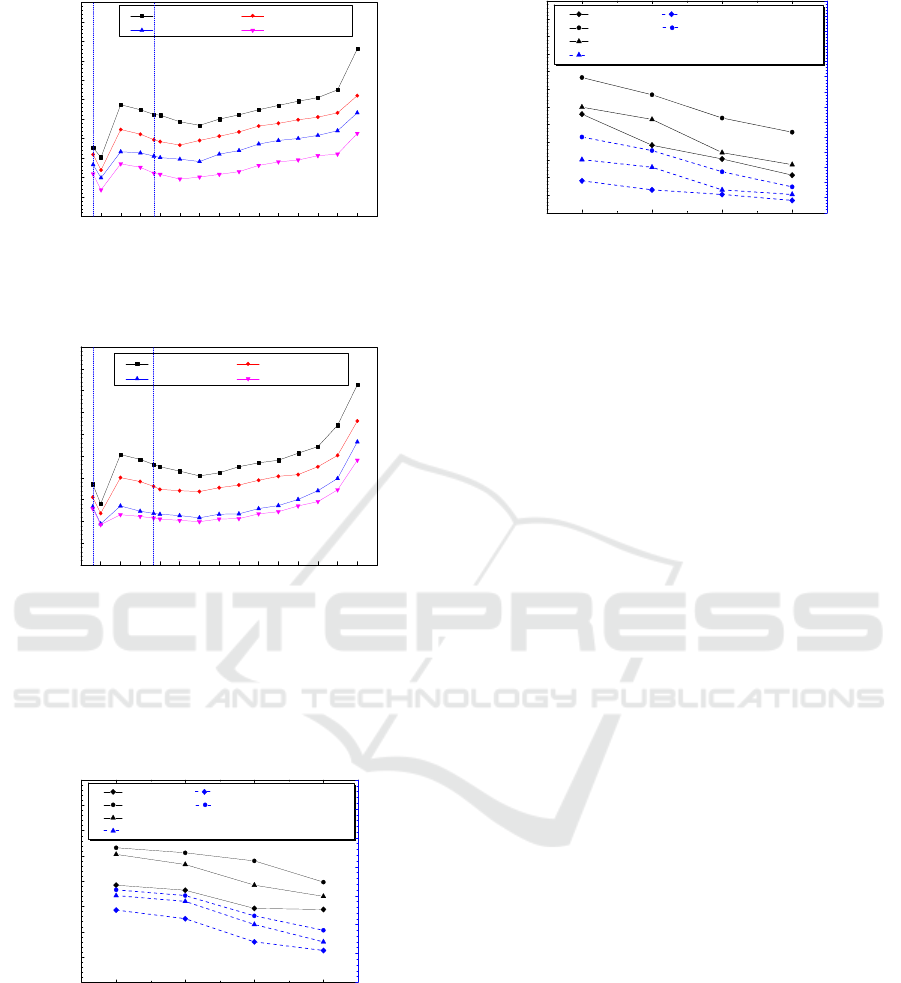
Figure 5: The highest temperature of full side opening
condition.
Figure 6: The highest temperature of the opening areas of
the top and side are in equal measure condition.
(Note: The two dashed lines (height of 1.5m and 9.2m)
perpendicular to the X axis are the height of the active
area of the first and second floor, respectively.)
Figure 7: The average temperature and PMV of the first
floor personnel activity area.
Figure 8: The average temperature and PMV of the
second floor personnel activity area.
Fig. 4, 5 and 6 show the vertical maximum
temperature of the conditions. The atrium has
obvious vertical temperature stratification along the
height direction. The general trend is that the higher
the vertical height, the higher the temperature. The
average temperature difference between the bottom
and the roof is about 2℃, which accords with the
existing research (T Yu, L Yang, 2012) on measured
thermal environment in atrium. This is because of
the chimney effect. Moreover, due to the buoyant
force, the indoor air with a higher temperature
moves to the top of the space and forms a vortex
near the roof, causing the heat to stagnate. In
addition, the atrium has a clear greenhouse effect,
and the sunlight through the glass of radiant heat
gathered below the roof, exacerbating the
temperature rise.
However, the temperature decreases first and
then increases and decreases finally in the height of
1.5m ~ 12.5m range, in which the extreme values
appear in the active area between the first and
second floor. This is due to the fact that staff
activities area (1.5 m in height) in first floor is larger
in area and generates more heat, resulting in a higher
temperature. The hot air flow on the ground floor
moves vertically upwards by the buoyant force,
however, the temperature drops to a certain extent
(the average temperature drop is about 0.3℃) at
1.5m due to the dilution effect of outdoor entering
cold wind. The thermal air flow continues to move
upwards and is blocked by cold air at the inlet vent
(7.7m ~ 9.7m) on the second floor. A part of the hot
air flow stays between the first floor and the second
floor, resulting in a higher temperature in this
interval, where the maximum is at 5m. The second
floor activity area (9.2m height) is only a stretch of
walkway along the wall with less heat and it is the
same height as the air inlet. Thus, the temperature is
lower. The cooling effect of the cold air flow on the
indoor air lasts until the height of 12.5m is reached.
0.0 2.5 5.0 7.5 10.012.515.017.520.022.525.027.530.032.535.037.5
25.5
26.0
26.5
27.0
27.5
28.0
28.5
29.0
29.5
30.0
30.5
31.0
The highest temperature
(
℃
)
height (m)
Opening area 100m
2
Opening area 250m
2
Opening area 500m
2
Opening area 750m
2
0.0 2.5 5.0 7.5 10.0 12.5 15.0 17.5 20.0 22.5 25.0 27.5 30.0 32.5 35.0 37.5
25.0
25.5
26.0
26.5
27.0
27.5
28.0
28.5
29.0
29.5
30.0
The highest temperature
(
℃
)
height (m)
Opening area 100m
2
Opening area 250m
2
Opening area 500m
2
Opening area 750m
2
100 250 500 750
22.5
23.0
23.5
24.0
24.5
25.0
25.5
26.0
26.5
t
p
/ Full top opening PMV/ Full top opening
t
p
/ Full side opening PMV/ Full side opening
t
p
/ The opening areas of the top and side are in equal measure
PMV/ The opening areas of the top and side are in equal measure
(
Opening area m
2
)
Average temperature t
p
(
℃
)
-0.7
-0.6
-0.5
-0.4
-0.3
-0.2
-0.1
0.0
PMV
100 250 500 750
23.0
23.5
24.0
24.5
25.0
25.5
26.0
26.5
27.0
27.5
28.0
28.5
29.0
t
p
/ Full top opening PMV/ Full top opening
t
p
/ Full side opening PMV/ Full side opening
t
p
/ The opening areas of the top and side are in equal measure
PMV/ The opening areas of the top and side are in equal measure
Average temperature t
p
(
℃
)
(
Opening area m
2
)
-0.1
0.0
0.1
0.2
0.3
0.4
0.5
0.6
0.7
0.8
0.9
1.0
1.1
1.2
1.3
PMV
ICECTT 2018 - 3rd International Conference on Electromechanical Control Technology and Transportation
54

And because the heat radiation caused by sunlight
getting through the glass roof is getting stronger, the
temperature begins increasing slowly.
At the height of 32.5m~35m, the temperature
shows a significant increase not only because the
35m is close to the glass roof, but the heat radiation
of the glass becomes stronger after glass absorbing
heat. Besides, being limited by natural ventilation,
the heat flow rising from the bottom forms a certain
degree of eddy currents at the roof, making the heat
accumulation more seriously. As a result, there is a
sudden temperature rise here.
In the same condition, that is, when the opening
position is fixed, different air outlet size results in
different indoor thermal environment effects.
However, in the scenario simulations at three
different locations, the maximum temperature of the
corresponding position decreases with the increase
of the opening area, and the average temperature
difference of the adjacent outlet area condition is
about 0.5℃.
When the area of the opening is fixed, it is found
from the comparison of the corresponding height of
the three conditions that the temperature of the full-
top opening solution is the lowest, followed by the
half-top & half-opening solution, and the worst
effect appears in the full-side opening solution,
which is also consistent with the characteristics of
the movement of heat flow. Heat flow raising is
gathered at the roof, the higher the location is, the
closer the roof of the place is, the more benefits we
get to boost the diffusion of heat flow, and the better
the cooling effect is. At the same time, increasing
the outlet height can not only effectively increase the
position of the neutralizing surface (LW Zeng, 2015)
and increase the pressure on the inlet side, but also
promote the inflow of cold air at the bottom of the
building, and also promote the air flow to a certain
extent.
Fig. 7 and 8 show the average temperature and
PMV comparison of the first and second floors of
the conditions respectively. The figure shows that
PMV has a strong positive correlation with the
temperature. The area with the lower temperature,
PMV is smaller, PMV in the area with the higher
temperature is also larger, and the amplitude of
change is also very consistent.
3.2 Indoor Ventilation Effect Analysis
Indoor ventilation effect affects the body's thermal
comfort to a large extent, which can be judged by
ventilation efficiency and ventilation frequency.
Ventilation efficiency indicates the capability of
blowing air to eliminate indoor residual heat
pollution or chemical pollution. And in terms of
waste heat, it can also be called temperature
efficiency (JH Meng, 2005). It is a concentrated
reflection of the comprehensive effect of indoor
thermal environment (XJ Meng, G Du, 2013), and
can be calculated as follows:
ow
op
tt
tt
E
−
−
=
(1)
In the formula:
p
t
- Exhaust temperature, ℃;
o
t -
Inlet temperature, ℃;
w
t - Personnel activity area
temperature, ℃.
Ventilation frequency is not only an important
parameter that measures the pros and cons of indoor
air dilution or the degree of mixing achieved by
dilution, but also an estimate of the indoor
ventilation rate, which can be calculated as shown
(R Zhang, PF Fang, 2017):
V
Av
N
*3600
=
(2)
In the formula:
N - Ventilation frequency, times /
h;
A
- The total area of the inlet vent,m
2
;
v
- The
average inlet speed, m/s;
V - The volume of the
building, m
3
.
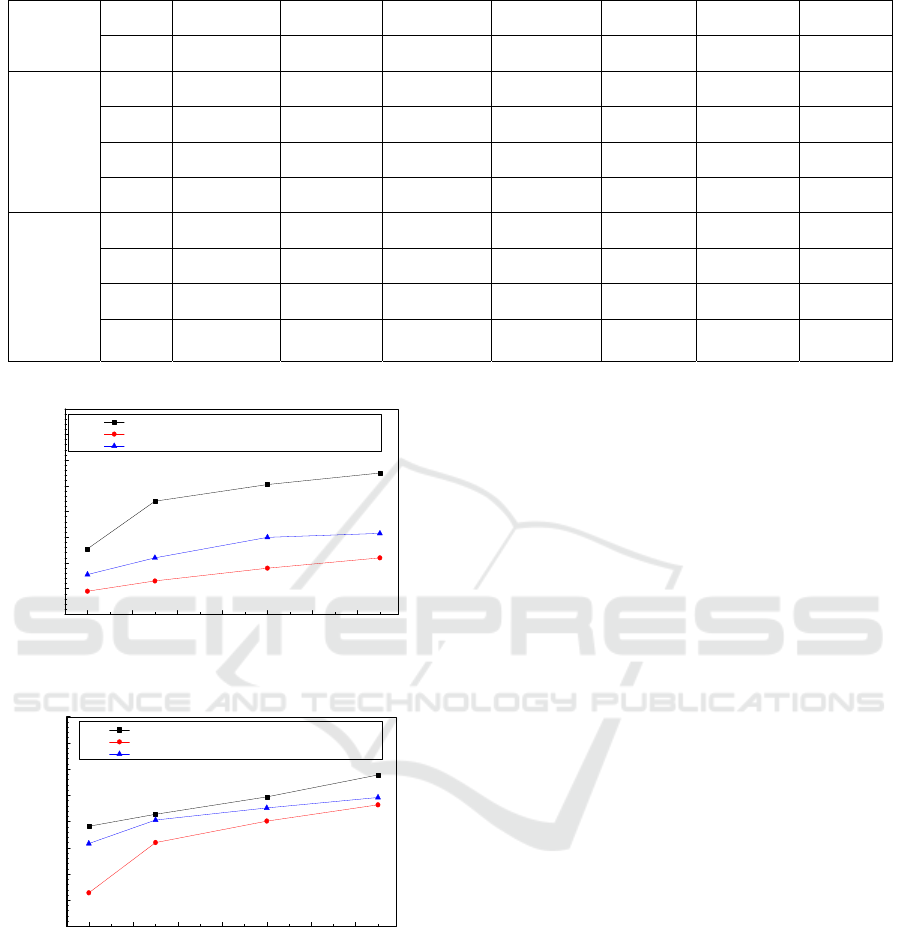
Table 2, Fig. 9 and 10 show the calculation
results of ventilation efficiency and ventilation
frequency of each condition.
Table 2: Natural ventilation efficiency and ventilation frequency of each condition.
Condition
Exhaust
temperature
t
p
(℃)
Into the air
temperature
t
o
(℃)
Personnel
activity area
temperature
t
w
(℃)
Ventilation
efficiency
(η)
Average
inlet vent
velocity
(m/s)
Average air
age
(s/time)
Ventilatio
n
frequency
(times/h)
Full top
opening
100m
2
28.02 22.00 25.16 1.91 1.03 733.00 4.91
250m
2
27.87 22.00 24.57 2.28 1.08 700.69 5.14
Research on Numerical Simulation and Energy Conservation Evaluation of Wind Energy Utilization in the Atrium
55
500m
2
27.66 22.00 24.35 2.41 1.15 657.94 5.47
750m
2
26.99 22.00 24.00 2.50 1.24 611.33 5.89
Full side
opening
100m
2
28.31 22.00 26.00 1.58 0.76 990.15 3.64
250m
2
28.15 22.00 25.70 1.66 0.97 782.37 4.60
500m
2
28.08 22.00 25.46 1.76 1.05 719.04 5.01
750m
2
27.31 22.00 24.88 1.84 1.14 663.73 5.32
The
opening
areas of
the top
and side
are in
equal
measure
100m
2
27.96 22.00 25.49 1.71 0.96 786.45 4.58
250m
2
27.93 22.00 25.23 1.84 1.06 715.63 5.03
500m
2
27.13 22.00 24.56 2.00 1.10 684.80 5.26
750m
2
26.63 22.00 24.28 2.03 1.15 659.38 5.46
(Note: The exhaust temperature t
p
is the average temperature of all vents, the temperature of the active area t
w
is the
average temperature of the active area of the first and second floor.)
Figure 9: Natural ventilation efficiency of each condition.
Figure 10: Natural ventilation frequency of each condition.
As can be seen from Table 2, Fig. 9 and 10, the
ventilation efficiency and ventilation frequency of
the project are the lowest when the opening area is
100m
2
. But they gradually increases as the opening
area increases, while the overall increase gradually
tends to be flat. In the design condition with three
different opening positions, the ventilation
efficiency and the ventilation frequency of the top
opening are the highest, followed by the top and the
side portions respectively being 1/2 each, and these
sectors of the whole side opening are the worst. The
larger the area of the air vents is, the better the
ventilation efficiency in the room is, the faster the
heat and pollutants are diluted, but it also means that
the indoor temperature field is relatively non-
uniform (XJ Meng, G Du, 2013),which may affect
the body's thermal comfort to some extent.
As the area increases, the ventilation efficiency
and ventilation frequency increase slower and
slower, indicating that the change of the area of the
smaller exhaust vent has a great influence on them.
It can also be inferred that the area increases to a
certain extent, the ventilation efficiency and
ventilation frequency will gradually reach the
maximum and almost be steady. The difference in
the ventilation efficiency of the exhaust vents at
different locations is that the thermal pressure keeps
the air flow rising toward the top of the atrium and
the closer the distance to the top is, the better the
effect of heat diffusion is, and the larger the area or
the area occupation ratio of the top vents is, the
better the effect of heat diffusion is.
3.3 Energy Conservation Evaluation of
Wind Energy Utilization
As Zhuhai is located in hot summer and warm
winter area, air conditioning systems are still needed
in some stages of the transition season to regulate
the indoor environment. Therefore, in order to
measure the energy-saving effect of wind energy
utilization of the atrium building, this paper
estimates the energy consumption of the building
during the transition season for the following two
kinds of ventilation and air-conditioning operation
strategies:
100 200 300 400 500 600 700
1.4
1.6
1.8
2.0
2.2
2.4
2.6
2.8
3.0
1.84
1.76
1.66
1.58
2.03
2.00
1.84
1.71
2.50
2.41
2.28
1.91
Ventilation efficiency
Opening area (m
2
)
Full top opening
Full side opening
PMV/ The opening areas of the top and side are in equal measure
100 200 300 400 500 600 700
3.0
3.5
4.0
4.5
5.0
5.5
6.0
6.5
7.0
Full top opening
Full side opening
PMV/ The opening areas of the top and side are in equal measure
Ventilation frequency (times/h)
Opening area (m
2
)
5.32
5.01
4.60
3.64
5.46
5.26
5.03
4.58
5.89
5.47
5.14
4.91
ICECTT 2018 - 3rd International Conference on Electromechanical Control Technology and Transportation
56

Strategy one: using air-conditioning system
in the whole process.
Strategy two: using pure natural ventilation
first, then air-conditioning system while
outdoor temperature is above 24 ℃.
According to the existing research (YB Lu, 2014)
about the energy-saving rate of natural ventilation in
the hot summer and warm winter area, strategy two
is more energy-efficient than strategy one in a 3.5m
high large space building with a non-atrium structure
in the transition season in Guangzhou, with 62.9%
energy-saving rate. In contrast, the building studied
in this paper not only has the atrium structure with a
glass roof, but also has a height of 41.82m which is
much higher than normal buildings. Therefore, the
building will have more significant chimney effect
and stronger heat ventilation, making the energy-
saving rate higher.
It can be inferred that natural ventilation has a
significant energy-saving effect on tall atrium
buildings, and the energy-saving rate can reach more
than 62.9%, meeting the preferred requirements of
the green building that the energy-saving rate must
be 60%.
4 CONCLUSION
By reasonably setting various calculation parameters
of PHOENICS, 12 kinds of natural ventilation
conditions with different outlet location and area are
simulated, and we can draw following conclusions:
Due to the heat pressure, air with high
temperature at the bottom of the room moves
closer to the middle of the atrium and
upwards, causing the high temperature gas to
form a vortex below the roof, which results in
the accumulation of heat. Meanwhile, as the
glass roof has a significant greenhouse effect,
heat radiation that through the glass gathered
under the roof, exacerbating temperature rise.
So there is a higher temperature near the roof
than temperature at the bottom of the activity
area. At the same time, it is found that PMV
has a strong positive correlation with
temperature. PMV is smaller in the lower
temperature region and larger in the higher
temperature region.
The location and area of the top vents greatly
affect the atrium in temperature, PMV,
ventilation efficiency and air frequency. The
effect of natural ventilation caused by the
thermal pressure as well as upward
movement of neutralization surface can be
more obvious and the utilization of wind
energy can be higher with higher location and
larger area of the vents. Besides, the indoor
temperature, PMV, ventilation efficiency and
ventilation frequency can be greatly
improved. Although the ventilation
efficiency, ventilation frequency and exhaust
outlet area have a significant positive
correlation, with the increase of area, the
increase in ventilation efficiency and air
frequency tends to moderate, indicating
changes in the smaller exhaust port have a
greater impact on them. And it can be
deduced that when the area of the air outlet
increases to a certain extent, the ventilation
efficiency and air changes will gradually
increase to the maximum and remain
basically stable. This is because when the
exhaust vents are larger than the inlets, the
area of the inlets becomes a major factor
affecting increase of air volume (HQ Tang,
2008), making the ventilation efficiency and
air frequency increasing more and more
slowly.
Natural ventilation has a significant energy-
saving effect on tall atrium buildings, and the
combination of natural ventilation and air
conditioning energy-saving rate may reach
more than 62.9%, compared to the entire use
of air conditioners.
REFERENCES
JK Yang., X Zhang., 2005. Numerical Simulation of
Thermal Environment in Atrium Buildings with
Natural Ventilation [J], Hv & Ac.
Y Cheng., YG Song., 2015. Numerical Simulation of the
Air Flow in the Atrium of the Mall in Summer [J],
Energy saving, 34 (12), pp. 38-41+3.
HY Zhao., CZ Meng., 2010. The Effect Analysis of
Unilateral Thermal Pressing Ventilation in the Atrium
Building [J], Building Science, (S2), pp. 52-54.
X Wang., C Huang., 2005. Comparison of Indoor Thermal
Environment in the Large Space Building with Upper-
wall Openings and Ceiling Openings [J], Hv & Ac.
XJ Meng., G Du., 2013. Influences of Windows Opening
Forms on Thermal Natural Ventilation in an Industrial
Workshop [J], Industrial Safety and Environmental
Protection, (12), pp. 34-36.
T Yu., L Yang., 2012. Field Measurement and Analysis of
Thermal Environment in the Atrium of Office
Building[J], Refrigeration & Air Conditioning.
LW Zeng., 2015. Study on Designing the Natural
Ventilation of Large or Medium Departments’ Atrium
in ChongQing [D], Chongqing University.
Research on Numerical Simulation and Energy Conservation Evaluation of Wind Energy Utilization in the Atrium
57

JH Meng., 2005. Research on Regularity of Ventilation
Efficiency in Displacement Ventilation Room [D],
Xi'an University of Architecture and Technology.
R Zhang., PF Fang., 2017. The Study and Optimize of the
Indoor Ventilation Efficiency with the Forms of
Window Opening [J], Architecture & Culture.
HQ Tang., 2008. The Applied Research of the Solar Power
Thermocompression Ventilation Roofing [D],
Chongqing University.
YB Lu., 2014. Energy Saving Research for the Combined
Operation of Air Conditioning and Hybrid Ventilation
System in Large Space Building [D], Guangzhou
University.
ICECTT 2018 - 3rd International Conference on Electromechanical Control Technology and Transportation
58
