
The Research of Electric Meter Site Ins
p
ection Data Minin
g
Haohan Zhen, Hua Shen, Feng Huang and Lei Yu
State Grid Shanghai Electric Power Research Institute, Shanghai 200051, China
zhenhaohan@126.com
Keywords: Electric meter, site inspection, data mining.
Abstract: In recent years, with the constant improvement of Power Supply Information Collection System, the data
mining of power information has been deepened. Site inspection is one of the most important way to obtain
the operating status of the meter. Data collected by Site inspection, which have wide coverage and strong
periodicity, can accurately reflect the error of electric meters, user load, operating environment etc.
Therefore, it`s necessary to include electric meters site inspection data into the source of power information
mining. In this paper, the big data mining strategy of site inspection data is discussed preliminarily, which is
helpful to analyse the running status of electric meters and user's electricity consumption more accurately ,
give full play to the role of site inspection in the operation and maintenance of the electric meter.
1 INTRODUCTION
“The Technical Administrative Code of Electric
Metering” divides electric metering devices into five
categories based on the voltage level, and sets the
site inspection cycle to 6/12/24 months for Ⅰ/Ⅱ/Ⅲ
category of electric metering devices. Detailed
operation data of the electric meter, which includes
appearance, operating errors, operating environment
and user load, can be obtained in site inspection. In
recent years, the number of Ⅰ/Ⅱ/Ⅲ category power
users increased significantly. At the same time, the
amount of data obtained by site inspection also
shows a blowout.
At present, the electric meter site inspection
focus on the operating fault and the error excess , but
lack of overall and deep mining analysis for the
mass site inspection data, which reflects the detailed
operating situation of electric metering devices. In
recent years, because of the analysis methodology
developments and the widely usage of application,
the data mining in power system has drawn more
and more attention from all parties. As the uniform
electric meter spreads across the country, and site
inspection is highly informative and digitized, site
inspection data is more truthful, reliable,
comprehensive and standardized. It lays a good
foundation for the site inspection data mining,
analysis and application.
2 ANALYSIS OF DATA TYPES IN
SITE INSPECTION OF
ELECTRIC METER
The site inspection of the electric meter is mainly
aimed at the operating error, including: general
check, wiring check, secondary side voltage drop
measurement on the related voltage transformer, the
electric meter operating error measurement, timing
error test, the combination error of meter reading,
etc. At the site of the inspection, the inspector can
obtain relative operation data of electric meter,
including timing, appearance, environment, user
load, etc. The site inspection data can be roughly
divided into numerical and non-numerical classes.
The data collected from the user site have high
reliability. Moreover, the period of site inspection
data acquisition is fixed. Therefore, the value of the
analysis on the site inspection data cannot be
ignored.
2.1 Numerical class data
The data from site inspection are mostly numerical.
In addition to the metering error (γ) of the electric
meter, the site inspection can also get the clock error
(Δt) by comparing the clock, the reading meter error
(δ) by obtaining the time-sharing electricity quantity,
92
Zhen, H., Shen, H., Huang, F. and Yu, L.
The Research of Electric Meter Site Inspection Data Mining.
In 3rd International Conference on Electromechanical Control Technology and Transportation (ICECTT 2018), pages 92-96
ISBN: 978-989-758-312-4
Copyright © 2018 by SCITEPRESS – Science and Technology Publications, Lda. All rights reserved

the user’s instantaneous load (p) by calculating
voltage (U) and current (I) value, and the user’s total
electricity quantity (W) at the inspection point. The
above data can be obtained in the site inspection and
can be conveniently stored, processed and analysed.
2.2 Non-Numerical Class Data
The appearance of electric meter, operating
environments, etc. difficult to measure by value, can
be expressed in a non-numerical way. The data is
categorized in detail when obtained in order to
maintain the objectivity, as shown in Table 1
.
Table 1 Non-Numerical Data of Site Inspection
Data
Status
Corresponding Detailed Information
Appearance
Good
no dirt and oil pollution on the electric meter surface/ complete and no damage of the
shell/ LCD screen display clarity/ good button function/ complete seal
Mediocre
ash or oil on the electric meter surface/ surface lightly damaged/ key sensitivity
reduced
Alert
serious ash or oil pollution on the electric meter surface,surface damaged/ LCD
screen display blur,button insensitive
Environment
Good
appropriative power distribution room/ controllable room temperature/ dust-proof,
moisture-proof, rodent control measures/ equipped with a professional electrician
Mediocre
appropriative power distribution room/ electrician patrol/ general protective measure
in power distribution room/ ash accumulating in power distribution room
Alert
no power distribution room/ outside electric meter without protective measures/
power distribution room without electrician patrol or protective measures
By organizing data and especially combing non-
numerical data, site inspection data can be
normalized to maintain data accuracy and
objectivity, thereby preparing for data analysis and
mining.
3 ELECTRIC METER SITE
INSPECTION DATA MINING
Electric meter site inspection data includes not only
the energy meter running information, but also
contains the relevant user information. The site
inspection data is not independently, but there is a
potential contact and influence between each other,
and this connection and influence is multi-
dimensional, non-linear。Therefore, it is necessary
to fully excavate and analyse the data from the site
inspection to explore the inherent relationship
between the meter data. The result of data mining
can be used to analyse and predict various
phenomena and situation that may occur in the
operating of electric meter.
3.1 Electric meter Operation Reliability
Prediction
Meter as a measure of electrical energy, strictly
speaking, during the operation does not allow the
process of maintenance situation. However, due to
various factors, it is difficult to avoid various faults
during the actual operation of the electric meter.
Most failures occur not by chance, but as a result of
a combination of various factors. At present, it is
difficult to conduct real-time monitoring on the
operating parameters of the electric meter in
operation. Therefore, the mastery of operating
conditions is mainly based on the site inspection
data. The operating status of the electric meter is
excavated in the site inspection data, and the
reliability of the electric meter is evaluated. Next,
the two most common failures, including the error
excess of electric meter and the voltage/current loss
are analysed.
3.1.1 Electric meter Operating Error
In the operation of the meter, the failure of operating
error excess accounts for the most. In addition to the
quality of the product and the running time, the
factors that affect the error of the electric meter
include the environmental factors such as the load,
temperature and humidity of the user. The operating
error of the electric meter can be analysed
preliminarily from the existing site inspection data.
(1) Electric meter manufacturing level
Because of the different manufacturing levels,
the operating errors of electric meters from different
manufacturers, models and batches often have great
The Research of Electric Meter Site Inspection Data Mining
93
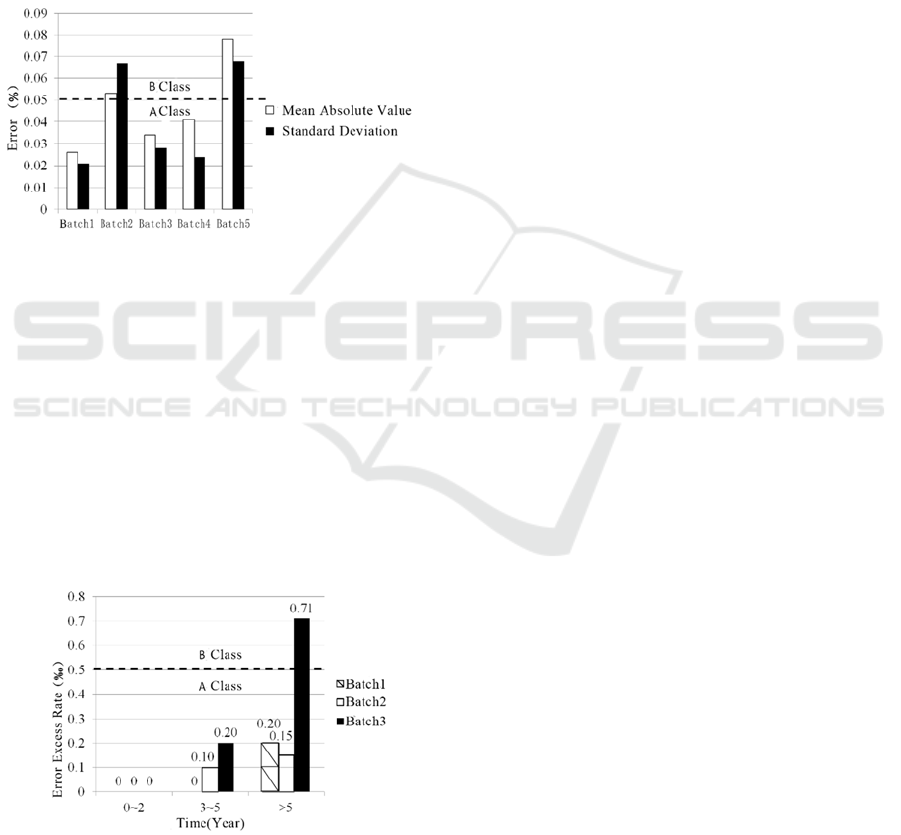
differences. Take the 2017 site inspection data as an
example: the site inspection operating error of 5
batches electric meter with similar running time is
compared, and the average absolute value and
standard deviation are analysed. As shown in Figure
1, the operating error size and dispersion of different
batches of electric meter are different. According to
the error average absolute value and standard
deviation, the different batches of electric meters can
be divided into two categories, A and B, with 0.5‰
as the dividing line, which indicates the influence of
the electric meter manufacturing level on the error.
Fig 1 Comparison of Mean Absolute Value and Standard
Deviation of Electric meter Error
(2) Electric meter running time
With the increase of running time, the error
excess rate of the electric meter increased obviously.
The error excess rate of the different running time of
3 batches of the electric meter is shown in Figure 2.
The batch 3 whose operation period expires and fails
to be changed in time reaches 0.71‰, far more than
the other batches. The batch 3, which runs more than
5 years, is divided into B class, with 0.5‰ as the
dividing line, according to the operating error
excess.
Fig 2 Comparison of Error Excess Rate of Different
Electric meter Running Time
(3) User Maintenance
The error of 10 electric meter operating errors
found in the first quarter of 2017 is analysed. The 10
users cover industrial, commercial and
administrative institutions, and the user's power
distribution facilities are properly maintained.
Therefore, from the existing site inspection data
analysis, the operation error of the electric meter is
less related to the external environmental factors,
such as the maintenance of the user.
Based on the existing site inspection data, the
operating error of the electric meter is mainly related
to the product batch (difference in manufacturing
level) and running time. The results of the analysis
can be used to predict the performance of the electric
meter. According to the division of the above A and
B class, the operation error of the Double-B class
electric meter should be paid attention to in the site
inspection. If the corresponding batch has expired
the operation period, it is necessary to speed up
changing the meter to reduce the operation error
excess of the electric meter.
3.1.2 Voltage/Current Loss
The loss of voltage and current caused by fuse burn-
out in voltage and current transformer is one of the
most frequent faults that affect the accuracy of
measurement. There are many factors that lead to
fuse burn-out. It is not only related to the quality of
fuse, but also related to the external factors such as
the operating environment. It is generally believed
that lightning is one of the important reasons for fuse
burn-out or damage. After fuse burn-out, the electric
meter can record the time of failure. Taking the fuse
burn-out fault data found in site inspection in 2016
and 2017 in a certain area as an example, August~
November is a high failure period, which is about 2
times of that in other months, as shown in Figure 3.
July ~September is the high incidence of lightning in
the region. A part of the fuse has not been fused
directly after a lightning strike, but it can continue to
run for a period of time in the case of damage.
Therefore, November ~ November is still a period of
high incidence of voltage and current loss caused by
fuse burn-out.
ICECTT 2018 - 3rd International Conference on Electromechanical Control Technology and Transportation
94
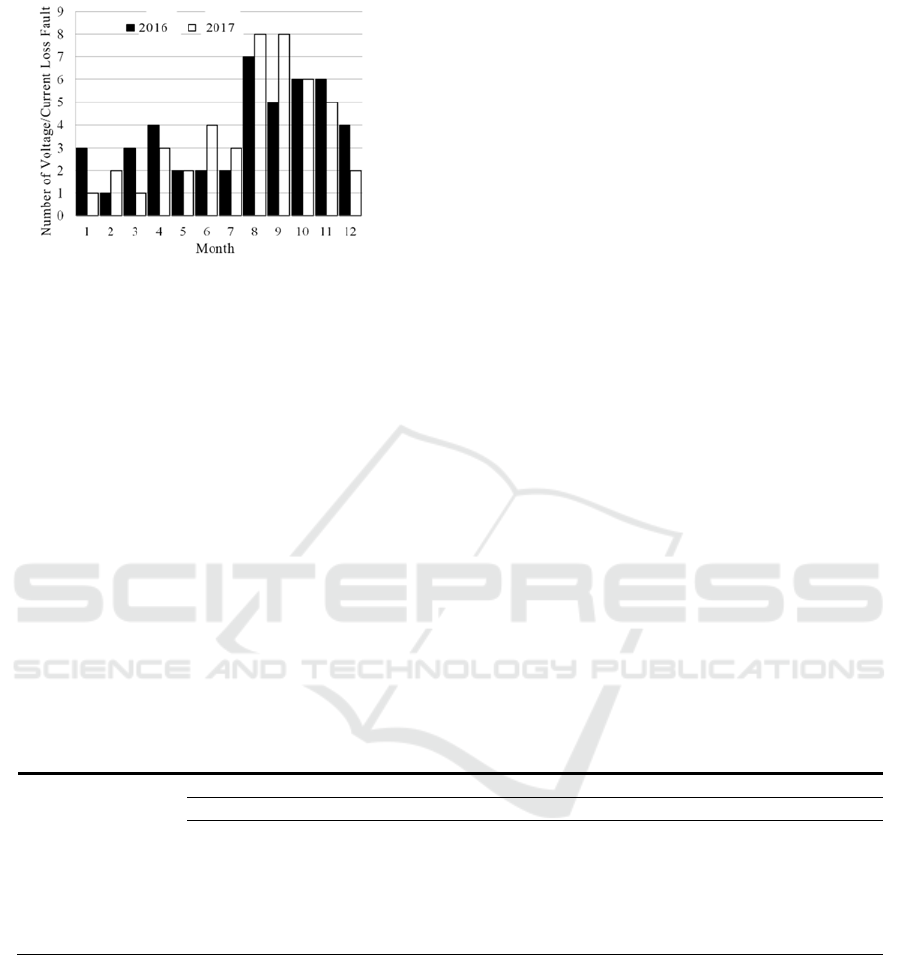
Fig 3 Time Distribution of Voltage/Current Loss
In view of the seasonal characteristics of voltage and
current loss caused by fuse burn-out, effective
preventive measures and investigation methods
should be taken, such as checking fuse before
thunderstorm season. In addition, with the
continuous improvement of the Power Supply
Information Collection System, online trouble-
shooting and timely repair can be made to reduce the
metering errors caused by the failure.
In summary, the analysis of field test data can
extract the characteristics of all kinds of electric
meter on-site fault, and it is of great significance to
predict the running stability of the electric meter. At
the same time, with the continuous application of
new devices, all kinds of operating status are
changing. Based on real-time updating of site
inspection data, it can better track all kinds of state
variables and develop more perfect inspection
strategies.
3.2 Analysis of User's Electricity
Consumption Behaviour
With the establishment of Power Supply Information
Collection System, the collection of user power data
is more comprehensive and perfect, which is the
important data source of current power big data
analysis. However, besides voltage, current and
power, the site inspection data contains many
peculiar non-electrical data, which can provide a
more comprehensive description of user electricity
consumption behaviour.
3.2.1 Maintenance of user equipment
According to the site inspection data, the equipment
maintenance of different properties power user is
quite different. Table 2 shows the maintenance of
different properties power user measurement devices
in a certain area. The maintenance evaluation
criterion is based on table 1.
Table 2 Operation and Maintenance of Different Properties Power Users Facilities
Users Properties
Appearance Environment
Good Mediocre Alert Good Mediocre Alert
Large industry 93.1% 6.9% 0.0% 89.7% 10.3% 0.0%
Government agency 98.0% 2.0% 0.0% 98.0% 2.0% 0.0%
School & Hospital 95.7% 4.3% 0.0% 93.5% 6.5% 0.0%
Small industry 76.0% 14.8% 9.2% 67.3% 12.8% 19.9%
Commercial
property
73.2% 17.1% 9.3% 67.9% 22.7% 9.4%
According to the appearance of the user's power
equipment and the operating environment, the
maintenance of the power equipment can be judged.
Large industrial, government agencies, schools,
banks, hospitals have strict electric equipment
management system. The power distribution
environment of those users is better, and the
distribution personnel are more fixed and
professional. Therefore, equipment failure can be
detected in time. And overall, the small industry,
commercial property and other power users are
equipped with low professional technicians, and the
maintenance of power equipment is not enough.
In view of the differences in the maintenance of
the user equipment, the power supply enterprise
should formulate the differential measures to guide
users to maintain the electrical equipment and
reduce the failure of the equipment.
The Research of Electric Meter Site Inspection Data Mining
95

3.2.2 Peripheral Data Acquisition in Big
Data Analysis
With the establishment and application of the Power
Supply Information Collection System, the analysis
of the user's electrical behaviour can be extended to
the big data analysis of the full sample. The Power
Supply Information Collection System is able to
collect real-time information, includes user’s
voltage, current, power, electricity amount and so
on, as well as the inherent user electrical properties,
address and so on. Through the full sample data
mining, the user behaviour can be analysed and
predicted.
The information contained in the site inspection
data is irreplaceable, such as user geographic
environment information, user nature of centralized
area, etc., and it is a supplement data of the Power
Supply Information Collection System. The user
address information in the Power Supply
Information Collection System is only a single
address, and lacks relevant geographical
environment information. For example, the user
address is on the sea or near the river. When the
address information is wrong, it can be corrected by
site inspection data immediately. The Power Supply
Information Collection System treat each power user
as a separate data, lack of integrity. However, site
inspection can classify power user according to the
same properties, and treat the users as a whole, such
as large industrial area, commercial street users, high
tech park etc. Through the combination of the Power
Supply Information Collection System and the site
inspection, the user's electrical data will be more
perfect and comprehensive, and the data mining will
be more detailed and deeper.
4 CONCLUSIONS
The electric meter site inspection can get the
electrical and non-electrical data of user metering
equipment, and has the advantage of data channel`s
uniqueness. The data has the characteristic of full
coverage, and has a certain real-time performance.
The operating statues of the electric meter can be
predicted preliminarily, and the user's electricity
behaviour can be excavated, with the help of the
mining in site inspection data. Combined with the
Power Supply Information Collection System, site
inspection data will play its unique advantages and
provide effective information in big data analysis to
making data mining more in-depth.
REFERENCES
DL/T448-2000 Technical Administrative Code of Electric
metering
Cheng Yingyin, Yang Huaxiao. Study on Operation Error
Analysis and State Evaluation Method of Electric
metering Device [J]. Advanced Technology of
Electrical Engineering and Energy, 2014,33(5):76-79.
Wang Wenjing. Stduy on the Site Operation Management
Strategy of the Electricity Meter. [J]. Electricity
Measurement & Instrumentation, 2014,11: 23-27.
Yue Mei. Analysis on the Operation Failure of the Electric
meter and the Effective Operation Management
Mechanism [J]. Technology Innovation and
Application, 2015,11: 162-163.
Zeng Peiliang. Overview of on-line monitoring technology
of electric metering device [J]. Electronic Test,
2012,12: 7-9.
Cheng Yingying, Hou Xingzhe, Xiao Ji. Design and
Realization of Condition Management System of
Gateway Electrical Energy Metering Device [J].
Electrical Measurement & Instrumentation, 2013,
50(572): 87-92,120.
Xiang Bin. The Running State of the Electric metering
Device Management System Design and
Implementation [D]. Chengdu: University of
Electronic Science and Technology of China, 2013.
Xie Lubin, Luo Xiuhong, Hu Xinmei. Discussion on
Electric metering Mechanism Field Check Period for
Special Transformer User [J]. Electric Switchgear,
2013,1:16-17.
ICECTT 2018 - 3rd International Conference on Electromechanical Control Technology and Transportation
96
