
Analysis and Comparison of Traffic Accident Regression Prediction
Model
Weihong Ma
1
and Zhenzhou Yuan
2
MOE Key Laboratory for Urban Transportation Complex Systems Theory and Technology, Beijing Jiaotong
University, Beijing 100044, China.
1
16120864@ bjtu.edu.cn ,
2
zzyuan@bjtu.edu.cn
Keywords: Traffic accident, Poisson regression, NB regression, ZINB regression, RF regression.
Abstract: The purpose of this paper is to analyse the relationship between the number of road traffic accidents and road
length, traffic conditions and other factors. Taking the number of road traffic accidents subject to Poisson
regression, negative binomial (NB) regression and Zero Inflated Negative Binomial (NINB) regression as
response variables, we construct a generalized linear model by introducing a joint function. We construct the
Traffic Accident Prediction Model Based on Random Forest (RF) Regression. The defect models are
compared, and based on the predictive model, selecting the significant factors and determining the degree of
influence factors of road traffic accidents, reducing the number of traffic accidents and improve the overall
security of the road.
1 INTRODUCTION
This paper studies the regression model of the
number of traffic accidents. This paper studies the
relationship between the number of traffic accidents
and various influencing factors. Regression analysis
was carried out on traffic accident number and
influencing factors respectively, and strong
correlation factors were selected. Based on the
selected influencing factors, Poisson regression, NB
regression, NINB regression and RF regression were
used to compare the goodness of fit parameters of the
model, select the model with the best fitting degree.
Analyzing the influencing factors of traffic
accidents is the first condition to establish the traffic
accident forecasting model. At the same time, it
provides an important theoretical basis for the
formulation of road traffic construction and traffic
management measures so as to timely and pertinently
take appropriate preventive measures and
improvement measures. According to the existing
relevant research results both at home and abroad,
scholars at home and abroad have conducted
extensive and in-depth research on the people,
vehicles, road alignment and environment which are
closely related to traffic accidents.
2 DOMESTIC AND FOREIGN
RESEARCH INTRODUCTION
2.1 Influencing factors of traffic
accidents
Chang et al. conducted a study on freeway traffic
accident data from 1997 to 1998 in Taiwan. Studies
have shown that: The number of lanes, the proportion
of trucks, the length of road sections and the traffic
volume are significantly and positively correlated
with the number of traffic accidents (Chang L
Y,2005).
Liande Zhong has studied the relationship
between the number of highway traffic accidents and
the road attributes, traffic attributes and
environmental attributes and other factors, the
research shows: whether the existence of the
interchange zone, the average curve of the average
curve, the cart ratio, the standard speed of the vehicle
speed has a significant impact on the occurrence of
traffic accidents(Liande Zhong,2008).
364
Ma, W. and Yuan, Z.
Analysis and Comparison of Traffic Accident Regression Prediction Model.
In 3rd International Conference on Electromechanical Control Technology and Transportation (ICECTT 2018), pages 364-369
ISBN: 978-989-758-312-4
Copyright © 2018 by SCITEPRESS – Science and Technology Publications, Lda. All rights reserved

2.2 Traffic Accident Prediction Model
Traditional counting models, such as Poisson
regression model and NB regression model, have
been widely used in traffic accident prediction.
Miaou and others used linear regression model and
Poisson regression model to analyze the relationship
between the number of truck accidents and the road
alignment. The research shows that Poisson
regression model is better than linear regression
model(Miaou S P,1993).
Milton et al. Used a NB regression model to
analyze the relationship between the number of traffic
accidents in the main road in Washington state and
the road conditions and traffic conditions, The
research shows that the NB regression model has a
good prediction effect(Milton J,1998).
Chen Yi used zero inflated Poisson model to fit
the highway data. The research results show that
when the vehicle flow reaches 18000 vehicles / day,
the frequency of traffic accidents will increase
significantly(Yi Chen,2013). At present, there are no
scholars to study the RF regression model to predict
traffic accidents.
3 ANALYSIS OF THE
INFLUENCING FACTORS OF
ROAD TRAFFIC ACCIDENTS
It is very important to analyze the law and influence
mechanism of traffic accident by studying the effect
of each influencing factor on traffic accidents and
establishing a forecasting model of road traffic
accidents so as to put forward corresponding
improvement measures and preventive measures.
Firstly, we analyze the correlation between the
number of traffic accidents and various influencing
factors. By comparing the correlation coefficients, we
select the factors that have a significant impact on the
number of road traffic accidents. There are 200
available data (Specific data information in Table 1).
Table 1: Variable name and description.
Labels Definition
Res
p
onse variables
Count Number of total accidents
Continuous ex
p
lanator
y
variables
SLENGTH Segment length
AADT Annual average daily traffic
(AADT)
PSR Pavement condition ratin
g
AVGTRUCK Average truck volume
p
ercenta
g
e
Labels Definition
Cate
g
orical ex
p
lanator
y
variables
NOLANE0 Number of through lanes less
than o
r
e
q
ual to two
NOLANE1 Number of through lanes greater
than two
RURAL0 Rural roa
d
RURAL1 Urban roa
d
Through the cross-linked list of factors, the
correlation between the number of traffic accidents
and various influencing factors is:
AADT>NOLANE0>SLENGTH>AVGTRUCK>RU
RAL0>PSR.
The scattergrams of seven variables, Count,
SLENGTH, AADT, NOLANE0, RURAL0, PSR and
AVGTRUCK, are respectively obtained. The results
are as follows:
Figure 1: Scatter plot between the Count and the various
factors
As can be seen from Figure 1, there is no obvious
linear relationship between Count and each factor.
There is a relatively weak linear relationship between
SLENGTH and AADT and the number of traffic
accidents. With the increase of AADT, the increase
of Count is more obvious than that of SLENGTH.
The number of traffic accidents with NOLANE0 of
1was significantly greater than that of NOLANE0
with 0 .
Analysis and Comparison of Traffic Accident Regression Prediction Model
365
4 ESTABLISH ROAD TRAFFIC
ACCIDENT REGRESSION
MODEL
This section will briefly introduce the theoretical
system of Poisson regression model, NB regression
model, NINB regression model and RF model. Based
on these four model theories, we respectively
construct road traffic accident prediction models.
Because the number of traffic accidents is a
random variable. Firstly, we need to study the
distribution of random variables. Then through the
generalized linear regression model to study the
relationship between the expected number of traffic
accidents and various influencing factors. Finally, the
connection function is used to achieve the fitting of
the nonlinear relationship between the number of
traffic accidents and various influencing factors.
Generalized linear model is proposed by Nelder,
which is very suitable for discrete traffic accident
data. It has the following three aspects of the
promotion of the traditional linear model(Zhuoheng
Chen,2011).
(1) The distribution of the response variable Y
can be taken from any distribution in the exponential
distribution family;
(2) The linear combination of independent
variables is η = β
0
+ β
1
×x
1
+ ... + β
k
x
k
= X'β. This is
no different from the multiple linear regression
model, Y, X desirable continuous or discrete values.
(3) The mean of response variables E (Y) = μ
= h (X'β), h is monotonous and can guide..
Through training samples, we get a prediction
model of traffic accident based on RF regression.
We
choose AIC criterion, BIC criterion to evaluate the
goodness of fit of the generalized linear regression
model, choose SSR to compare the goodness of fit of
the RF regression model and the generalized linear
regression model.
4.1 Poisson Regression Model
In fact, whether each vehicle has a traffic accident in
each section can be regarded as a Bernoulli test. The
probability of the incident is usually very small. If the
number of vehicles entering the section within a
certain statistical period is large enough , and the
product of the number of vehicles and the event
probability is moderate, the distribution of traffic
accidents on each road segment can be described by
Poisson distribution. Therefore, Poisson regression
model is introduced for the prediction of traffic
accident number. The probability distribution of the
Poisson regression model is as follows:
()
!
==
i
i
ii
i
P
y
Y
y
ey
(1)
y
is the number of traffic accidents per unit time on
the i-th road section;
is the expected number of
traffic accidents per unit time on the i-th road
section (Yulong Pei,2003).
Below we establish the Poisson regression of road
traffic accidents. Here logarithmic connection
function is used to realize the Poisson regression fit
between the number of traffic accidents and various
influencing factors. After repeated model screening
through the back method, the model with the highest
goodness of fit includes four influencing variables:
AVGTRUCK, NOLANE0, AADT and SLENGTH.
Here by offset function to handle AADT and
SLENGTH two exposure variables. It can be seen
from the model that NOLANE0 has the greatest
impact on the number of traffic accidents. The
regression equation is as follows:
3.9916 0.3683 0 0.1901
(*)
RURAL AVGTRUCK
y SLENGTH AADT e
(2)
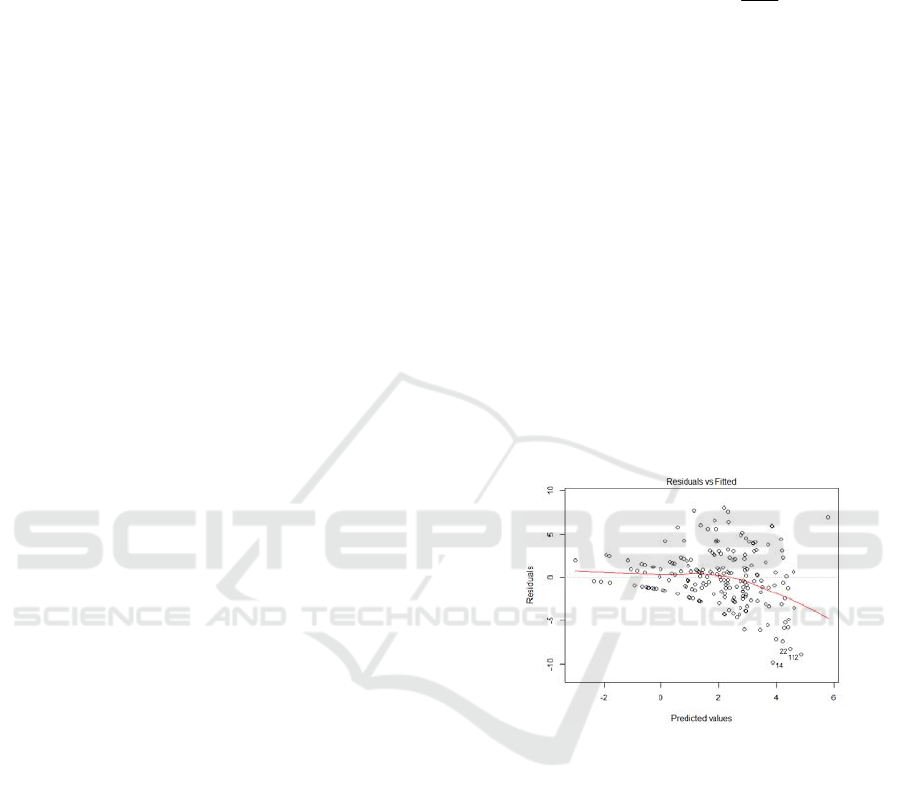
Figure 2: Poisson regression model Residual - Fitting
Value graph
The result of model shows
that:AIC=2698.7,BIC=2708.63,and SSR=1957.2, It
can be seen from Fig. 2 that
Residual values fluctuate
in the [-10,10] range. The abnormal values increase
with the increase of fitting values in the Poisson
regression model, and the residuals tend to increase.
The goodness of fit of the model is not ideal. The
limitation of Poisson regression model lies in that the
mean and variance are equal. Actually, most of the
traffic accident data are characterized by excessive
dispersion, ie, the variance is larger than the mean.
4.2 NB Regression Model
If the number of traffic accidents y
of the unit time
on the i section obeys the Poisson distribution, The
ICECTT 2018 - 3rd International Conference on Electromechanical Control Technology and Transportation
366
expected value of the number of accidents
is
subject to the gamma distribution, The number of
traffic accidents y
on the section i is subject to NB
distribution(Min Chen,2012). The probability
distribution of the NB regression models is as
follows:
1/
Г[]
1
(1 1 / )
(= )=
Г(1 / ) 1 1!
i
K
i
ii
y
i
i
i
yK
PY y
KKKy
K
(3)
In the formula, K is a discrete coefficient, Г is
a gamma distribution.
Below we establish the NB regression model of
road traffic accidents. Here logarithmic connection
function is used to realize the NB regression fit
between the number of traffic accidents and various
influencing factors.After repeated model screening
through the back method, the model with the highest
goodness of fit includes four influencing
variables:AVGTRUCK 、 RURAL0 、 AADT 、
SLENGTH. Here by offset function to handle AADT
and SLENGTH two exposure variables. From the
model, it can be seen whether the country road has
the greatest impact on the number of traffic accidents,
and the following regression equation is obtained:
3.9992 0.7012 0 0.1266
(*)
RURAL AVGTRUCK
y SLENGTH AADT e
(4)
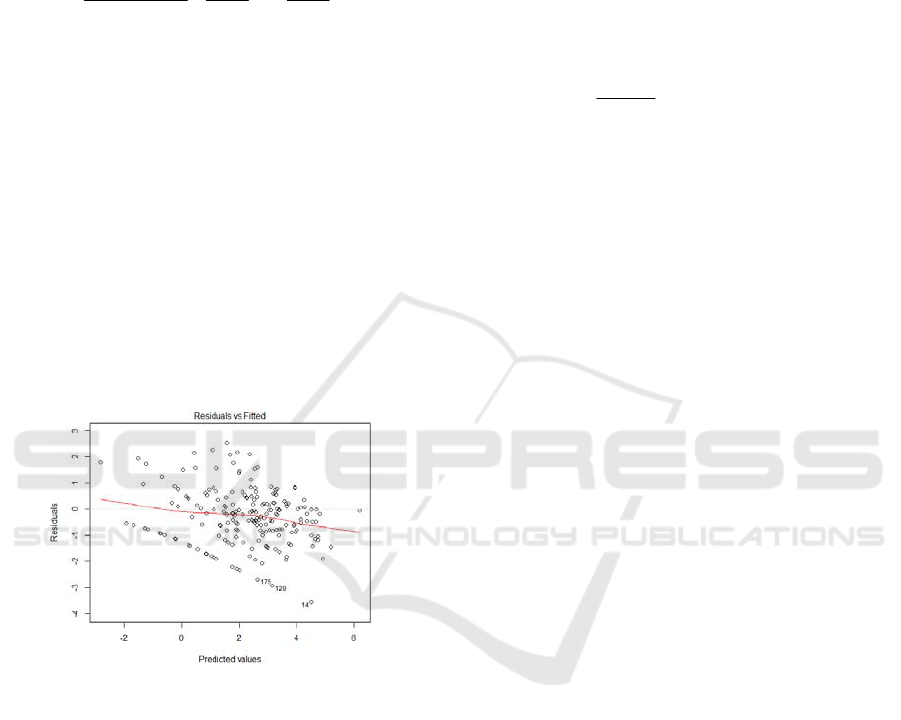
Figure 3: NB regression model residual fitting value
It can be seen from Fig. 3 that Residual values
fluctuate in the [-4,4] range, and the wave amplitude
is smaller than that of Poisson regression.The result
of model shows that: AIC=1363.3, BIC= 1376.513,
SSR= 230.7843, which is much smaller than that of
Poisson regression model. NB model is higher than
the Poisson model and are more appropriate to the
actual data. The fitting degree of the NB regression
models is better.
4.3 ZINB Regression Model
ZIP regression model is the first choice to deal with
ZI data. Its expression is clear, and it is more
convenient to deal with. In the field of practical
applications, zero expansion data will also appear as
follows: 1) there is a large discretization in the non
zero part relative to the ordinary Poisson distribution;
2) the absence of observations.The ZINB regression
model can solve the problem of large variance and
zero expansion(Honglu Zhang,2015).
If there is a group of discrete random variablesY
(i=1,2…m;j=1,2…n;N=
∑
n
)have the following
distribution:
1/
1/ 1
(1 )(1 ) , 0
Г(1
(=
/
(1 ) (1 ) (1 ( ) ) , 0
Г(1 / !)
)=
)
ij
iijijij
ij ij
j
ij ij
y
ij
ij
ij
ij
y
pY y
y
y
y
(5)
It is called Y
obeys the ZINB distribution.
Below we establish the NINB regression model of
road traffic accidents. Here logarithmic connection
function is used to realize the NINB regression fit
between the number of traffic accidents and various
influencing factors.After repeated model screening
through the back method, the model with the highest
goodness of fit includes four influencing
variables:NOLANE0, AVGTRUCK, PSR,
RURAL0, AADT, SLENGTH. Here by offset
function to handle AADT and SLENGTH two
exposure variables. From the model, it can be seen
whether the country road has the greatest impact on
the number of traffic accidents, and the following
regression equation is obtained:
ln =log(SLENGTH*AADT)+4.4836-0.0693NOLANE0-0.1512PSR-0.1253AVGTRUCK-0.6641RURAL0
log ( ) log (SLENGTH*AADT)-4.504-11.943NOLANE0-6.508PSR+1.613AVGTRUCK-14.236RURAL0
it
(6)
It is known from the model results that
AIC=1362.182. Compared with the NB regression
model, the AIC=1363.3 is smaller. The goodness of
fit is higher than that of the NB model, and it is more
appropriate to the actual data, so the fitting degree of
the NB regression model with zero expansion is
better.
4.4 RF Regression Model
As with other models, RF regression model can
explain the effect of several independent variables
(X1, X2, ..., Xk) on the dependent variable Y. If the
dependent variable Y has n observations, k
independent variables are related to it. When
constructing the decision tree, the random forest
randomly selects n observations from the original
data, some of them are selected multiple times, Some
are not selected, this is Bootstrap resampling method.
At the same time, random forest randomly selects
some variables from k independent variables to
determine the decision tree node. In this way, the
Analysis and Comparison of Traffic Accident Regression Prediction Model
367

decision tree that builds each time may not be the
same. In general, a random forest randomly generates
hundreds to thousands of decision trees, and then
selects the tree with the highest degree of repetition
as the final result(Lihui Li,2017).
In the traffic accident forecasting, the eigenvector
is established as the input characteristic by the
influencing factors of the number of traffic accidents,
and the traffic accident number corresponding to the
eigenvector is taken as the forecasting result. The
forecasting model is obtained by fitting the training
samples.
Below we set up a RF regression model of road
traffic accidents. After repeated model screening, the
model with the highest goodness-of-fit includes the
six influencing variables: RURAL0, NOLANE0,
AVGTRUCK, PSR, AADT and SLENGEH. The
IncNodePurity values of PSR, RURAL0 and
AVGTRUCK are small among the influencing
variables. The influence of this variable on the
number of traffic accidents is larger. The figure below
shows: Residuals in the RF regression model tend to
stabilize as the number of decision trees increases.
Figure 4: Simulation results
The model results show that the :SSR=1113.6.
Compared with Poisson regression model, the SSR is
smaller, which is larger than the SSR of NB
regression model. Therefore, the goodness of fit of
the RF regression model is higher than that of Poisson
regression model, which is worse than the NB
regression model. The machine learning prediction
model has a low prediction accuracy on the number
of traffic accidents.
5 CONCLUSION AND OUTLOOK
This paper tries to find a model that is closer to the
actual traffic condition by carrying out Poisson
regression,NB regression, ZINB regression and RF
regression on road traffic accidents. Assuming that
the number of traffic accidents subject to different
distributions, by selecting the strong influencing
factors among the different factors in the regression
model to build a model closer to the actual situation.
The simulation results show that under the
existing traffic data, Poisson regression model has a
poor fitting degree, followed by a RF regression
model, and AIC difference between theNB regression
and ZINB regression model is not very much. ZINB
regression model has the best goodness of fit. All
models eventually include the two
variables:RURAL0 and AVGTRUCK, and the
impact of RURAL0 on the number of road accidents
in all three models is greater than the other factors.
Urban roads are more prone to traffic accidents than
rural roads; there are more traffic accidents on roads
with large truck proportions. Therefore, we come to
the conclusion that we should strengthen the
management of urban road traffic conditions, the
specific measures should be based on traffic
characteristics of specific sections of the traffic
investigation. Traffic management should be
strengthened for areas with frequent and high traffic
accidents. Controlling the number of trucks within a
reasonable range can help reduce traffic accidents.
The factors considered in this paper may not be
comprehensive. Due to the lack of data collection, the
data related to traffic accidents will also affect the
accuracy of the results of regression analysis. In the
future, I hope to further study in this area and analyze
the relationship between traffic accidents in a more
comprehensive way from various perspectives. I
hope that the best model of traffic accident can be
fitted to achieve a more accurate prediction of traffic
accidents.
REFERENCES
Chang L Y,2005.Analysis of freeway accident frequencies:
NB regression versus artificial neural network. Safety
Science.
Liande Zhong , 2008. Study on Highway Accident
Prediction Model. Beijing University of Technology.
Miaou S P, Lum H. 1993. Modeling Vehicle accidents and
highway geometric design relationships. Accident
Analysis & Prevention,
Milton J, Mannering F, 1998. The relationship among
highway geometrics, traffic-relatedelements and
motor-vehicle accident frequencies. Transportation.
Yi Chen, 2013. Zero Expansion Poisson Regression Model
and Its Application in Traffic Accidents. Computer
Technology And Development.
ICECTT 2018 - 3rd International Conference on Electromechanical Control Technology and Transportation
368

Lihui Li, 2017. Study on Forecast of High-speed Railway
Short-term Passenger Flow Based On Random Forest
Regression. Railway Transport And Economy.
Yulong Pei, Ji Ma,2003. Cause Analysis and Prevention
Countermeasures of Road Traffic Accidents. Journal of
China Highway Journal
Min Chen, Jingtao Yu, Jian Lu,2012. Study on Multiple
Regression Prediction Model of Road Traffic
Accidents. Road Traffic Technology.
Honglu Zhang, 2015. Study on the Forecast Method of
Traffic Accident Count in Expressway. Chang'an
University.
Analysis and Comparison of Traffic Accident Regression Prediction Model
369
