
Application of Combined Forecast Method in Highway Network
Scale Forecast in Moderately Developed Cities
Dong Wang
1
, Yanhong Li
1
and Jianming Feng
2
1
China Academy of Transportation Sciences, No.240, huixin li, chaoyang district, Beijing, China
2
CCCC Highway Consultants Co., Ltd, No. 85 Dawai Street, Xicheng District, Beijing, China
wdong010@163.com, lisa813328@163.com, 53621240@qq.com
Keywords: Highway Network Scale, Forecast, Combined Forecast Method, Moderately Developed Cities.
Abstract: In this paper, based on traditional highway network scale forecast method, the combined forecast model of
variance-covariance appropriate for moderately developed cities is proposed and the application verification
of the model is conducted in Zhaoqing, indicating the feasibility and maneuverability of the model and
method. To sum up, the model and method can provide theoretical and practical foundation for highway
network scale forecast of cities as the same type.
1 INTRODUCTION
According to Notice on Adjusting the Standard of
Urban Scale Division printed and issued by the State
Council in 2014, the total population of Zhaoqing is
4.3373 million in 2014 and the resident population in
the urban area is 658,600, thus Zhaoqing belongs to
medium-sized city. Meanwhile, GDP of Zhaoqing in
2015 is 197 billion Yuan and the per capita GDP is
48,670 Yuan, indicating developed economy.
The development scale of highway network is an
important symbol of the development level of social
economy. The size of development scale of highway
network determines the convenience of regional
traffic and is directly related to the economic
development and progress of social civilization. The
determination of reasonable scale of highway
network is a major step in the planning of highway
network as well as the premise and foundation for the
optimization of highway network. Up to now, there
are several kind of research methods for reasonable
scale of highway network at home and abroad and
each method owns its theoretical support and
corresponding algorithm. However, there are few
methods for highway network forecast especially for
moderately developed cities. In order to improve such
a situation, the combined forecast of variance-
covairance based on traditional highway network
scale forecast method is proposed in this research so
as to provide theoretical and practical guidance for
the development of highway network scale of cities
of the same type.
2 THEORIES AND METHODS
FOR HIGHWAY NETWORK
SCALE FORECAST
2.1 Connectivity Method
The connectivity model comprehensively reflects the
connectivity and accessibility situations of each node
in the highway network, which is related to the
development level of regional economy. According to
the quantity of highway network nodes in the region,
the development scale of highway network is
calculated and the calculation model is shown as
below:
=××
√
×
(1)
In the formula:
-the scale of highway network (km);
-the connectivity degree of highway network;
-the quantity of nodes inside the region;
-the area of the region (km
2
);
ε -the deformation coefficient of highway
network, the ratio of the actual mileage to the linear
mileage between each node.
It can be seen from the model above that under the
circumstance that the area of the region and the
370
Wang, D., Li, Y. and Feng, J.
Application of Combined Forecast Method in Highway Network Scale Forecast in Moderately Developed Cities.
In 3rd International Conference on Electromechanical Control Technology and Transportation (ICECTT 2018), pages 370-374
ISBN: 978-989-758-312-4
Copyright © 2018 by SCITEPRESS – Science and Technology Publications, Lda. All rights reserved

quantity of nodes are relatively stable, the variable
that determines the reasonable mileage is the
deformation coefficient of highway network and the
targeted value of connectivity degree of highway
network. Generally speaking, the major influencing
factor for highway network scale is the targeted value
of connectivity degree of highway network while the
major influencing factor for the deformation
coefficient of highway network is the landscape
distribution of route area. If there are more
mountainous area in the region, the bending degree of
route in the region is relatively larger and the
deformation coefficient of highway network of the
region is correspondingly larger, vice versa. The
connectivity of highway network
C refers to the
parameter of connection form between nodes. When
the value of
C equals to 1.0, the highway network is
displayed as a tree and each node is connected by two
routines. When the value of
C equals to 2.0, the
highway network is displayed in grid reticulation and
each node is mainly connected by multiple routines.
When the value of
C
equals to 3.0, the highway
network is displayed in triangle and each node is
mainly connected with six routines.
Figure 1: diagram of node connection model
Generally speaking, as for regions with relatively
developed economy and larger population density,
the value of connectivity degree of highway network
reaches 2.0~3.0. As for regions with relatively
backward economic development and smaller
population density, the value of connectivity degree
of highway network is lower, at 1.5~2.0. The value
for recent planning is lower while the value for long-
term planning is higher.
2.2 Land Coefficient Method First
Section
In order to investigate the correlation between the
highway network of similar regions and population,
economic development level and regional area, the
model is established. Furthermore, the highway
network scale is deduced according to the population
and economic development level of the region under
planning. The calculation model for the land
coefficient method is as shown below:
=α××
√
×
(2)
In the formula:
-the highway network scale (km);
α-the land coefficient;
I-per capita economic index
(10,000Yuan/person);
A-the area of the region (km
2
);
P-the total population (10 thousand).
2.3 Growth Curve Method
Compertz curve and Logist curve are commonly-used
growth curves. Compertz curve (S curve) is chosen in
this project and the calculation formula is as shown
below:
=×
(3)
In the formula:
-the total scale of regional highway network
(km);
k、a、b-coefficients
-time (year).
2.4 Combined Forecast of Variance-
covariance
Based on the forecast results above, the variance-
covariance method is applied to combined forecast of
each group of forecast results. The method applied is
to achieve the weighted average of the forecast results
of various forecast methods according to the value of
their variances, through which the final forecast
results are obtained. The weight calculation formula
of various forecast methods is as follows:
=(
∑
)
∑
∑
(4)
In the formula:
refers to the predicted error of sample tth of ith
forecast method, that is
=
−
.
C=1.0, tree C=2.0, grid
C=2.41, grid+diagonal lines C=3.22, regular triangle
Application of Combined Forecast Method in Highway Network Scale Forecast in Moderately Developed Cities
371

3 CASE ANALYSIS
3.1 Analysis on Influencing Factors for
Highway Network Development in
Zhaoqing
The reasonable scale of highway network is
influenced by various factors, among which
sociodemographic factor, geographical location
factor, the level and structure of economic
development, construction capital and national policy
occupy the dominant position.
As for population, according to Overall Urban
Planning of Zhaoqing (2015-2030) (the draft for
comments), the resident population scale of Zhaoqing
in 2013 shall be controlled at 4.9 million and the
urbanization level of city area shall reach 56%. The
improvement of new population and urbanization rate
will generate new demands towards highway
transportation in Zhaoqing.
In terms of geographical location, the total land
area of Zhaoqing is 14,900 km
2
, ranking the fifth
place in the whole province. The rate of current
construction land is 5,85%, showing relatively lower
development strength and greater future development
space. Meanwhile, Zhaoqing locates on the important
passageway that Pearl River Delta connects
Southwest China where several major arteries of
traffic, including highway, railway and waterway,
join. In 2013, Secretary of the provincial CPC, Hu
Chunhua, clearly pointed out while visiting Zhaoqing
that, “Zhaoqing needs to utilize the advantage of
various major traffic arteries to construct to be a hub
portal city that Pearl River Delta connects Southwest
China”, in which the excellent location advantage of
Zhaoqing is mentioned. The larger land are and
greater location advantage are the foundation and
motivation for the development of highway
transportation in Zhaoqing.
In regard to the level and structure of economic
development, the regional gross production of
Zhaoqing reaches 197.001 billion Yuan in 2015,
ranking the eleventh place in the whole province and
the per capita regional gross production reaches
48,700 Yuan, ranking the tenth place in the whole
province, indicating that the per capita GDP is
relatively low, falling short of 1/3 of the average level
of the Pearl River Delta region and the national
average. The rate of tertiary industrial structure of
Zhaoqing in 2015 is 14.7:49.2:36.1. The proportion
of increase value of the second industry to the
regional GDP is close to 50% while the service
industry lags behind. Some manufacturing industries
remain in the low-end link of industrial chain and core
technology and self-owned brands lack. From the
perspective that transportation, especially highway
transportation, plays the basic leading role in
economic development, there remains much room for
the improvement in highway transportation of
Zhaoqing.
Regarding the construction capital and national
policy, Chinese economy has stepped into new
normal with slackened economic growth rate, and
stable growth, method transformation and structure
adjustment are matters of top priority. It is proposed
in Guangdong Province that the building of a
moderately prosperous society in all respects shall be
accomplished first in 2018 with economic growth at
medium and high speed and annual growth of
regional GDP of 7%. Nevertheless, the economic
foundation of Zhaoqing is relatively weak. During the
proposal of the Thirteenth Five-Year Plan, the
economy of Zhaoqing keeps increasing at medium
and high speed and the annual growth of regional
GDP reaches around 9%. The rapid development of
economy provides better capital guarantee for the
construction of highway system. Meanwhile, there
are corresponding financial support policies for the
construction of traffic infrastructure in Guangdong
Province and even China. With the assistance of
investment modes like PPP, the scale of highway
traffic system of Zhaoqing in the future will further
increase and the structure will be further optimized.
3.2 Connectivity Method
With village committees as nodes, the planning
objective of highway that connects natural villages is
reflected through the improved connectivity of the
whole highway network of each planning period.
There are 1329 village committees, 244 community
committees, 92 town (national township)
governments and 12 street offices, that is, 1677 nodes
in total, in Zhaoqing. If 60 tourism sites in Overall
Planning of Tourism Development of Zhaoqing are
additionally considered, the quantity of nodes in the
whole highway network shall be calculated as 1737.
The landscapes within the territory of Zhaoqing
are complex. Mountainous regions and hills occupy
81% of the total city area while there are fewer basins
and plains. The non-linear coefficient is considered as
1.5. Though the average grade and level of highway
network of the next year will be continuously
improved as planned, with consideration of the fact
that most newly-added highway mileages in the
future highway network locate in mountainous
regions, the annual non-linear coefficients in the
future will not be adjusted as considered.
ICECTT 2018 - 3rd International Conference on Electromechanical Control Technology and Transportation
372
Till the end of 2015, the total highway mileage of
Zhaoqing is 14,128 km with connectivity of 1.85,
which is lower than the average provincial level.
Thus, improving the connectivity of the whole
highway network will be one of the key missions of
future highway construction in Zhaoqing. According
to analysis on the existing highways in Zhaoqing,
with comprehensive consideration of various factors
like economic development level, traffic demands,
natural conditions and capital raising ability, the
development objective of connectivity of highway
network of Zhaoqing is 2.10 in 2020, 2.30 in 2025 and
2.40 in 2030. The forecast results are shown in Table
1.
Table 1: Table of Forecast Results of Total Scale of
Highway Network in Zhaoqing (connectivity method).
Year
Area
(km
2
)
Non-linear
coefficient
Quantity
of nodes
Conne-
ctivity
Total
mileage
(
km
)
2015 14856 1.5 1737 1.85 14128
2020 14856 1.5 1737 2.10 16015
2025 14856 1.5 1737 2.30 17541
2030 14856 1.5 1737 2.40 18303
3.3 Land Coefficient Method
Table 2: Total Highway Mileage of the Whole Highway
Network in Zhaoqing in the Recent 20 Years and Basic
Parameters for the Land Coefficient Method.
Year
Total
mileage
of
highway
network
(
km
)
The
Land
coeffi-
cient
Per capita
GDP (ten
thousand
Yuan/person)
The total
p
opulation
inside the
region (ten
thousand
p
eo
p
le
)
Area
of the
region
(km
2
)
1996 5464 4.23 0.5739 340.89 14856
1997 5968 4.11 0.6399 346.34 14856
1998 6010 3.89 0.6752 351.61 14856
1999 6498 3.96 0.7138 355.97 14856
2000 7196 4.18 0.7422 361.54 14856
2001 7164 3.91 0.7827 368.34 14856
2002 7342 3.72 0.8401 372.47 14856
2003 7705 3.50 0.9258 381.27 14856
2004 8051 3.10 1.0829 386.6 14856
2005 8291 2.77 1.2315 396.48 14856
2006 10067 3.07 1.3366 404.65 14856
2007 10168 2.60 1.5915 407.71 14856
2008 10218 2.05 2.0133 410.28 15007
2009 10352 1.86 2.2415 413.69 14856
2010 11261 1.64 2.7325 422.41 14891
2011 11457 1.35 3.3614 426.9 14891
2012 12611 1.36 3.6650 427.59 14891
2013 13382 1.28 4.1479 429.82 14891
2014 13633 1.17 4.5795 433.73 14891
2015 14128 1.18 4.8670 405.96 14856
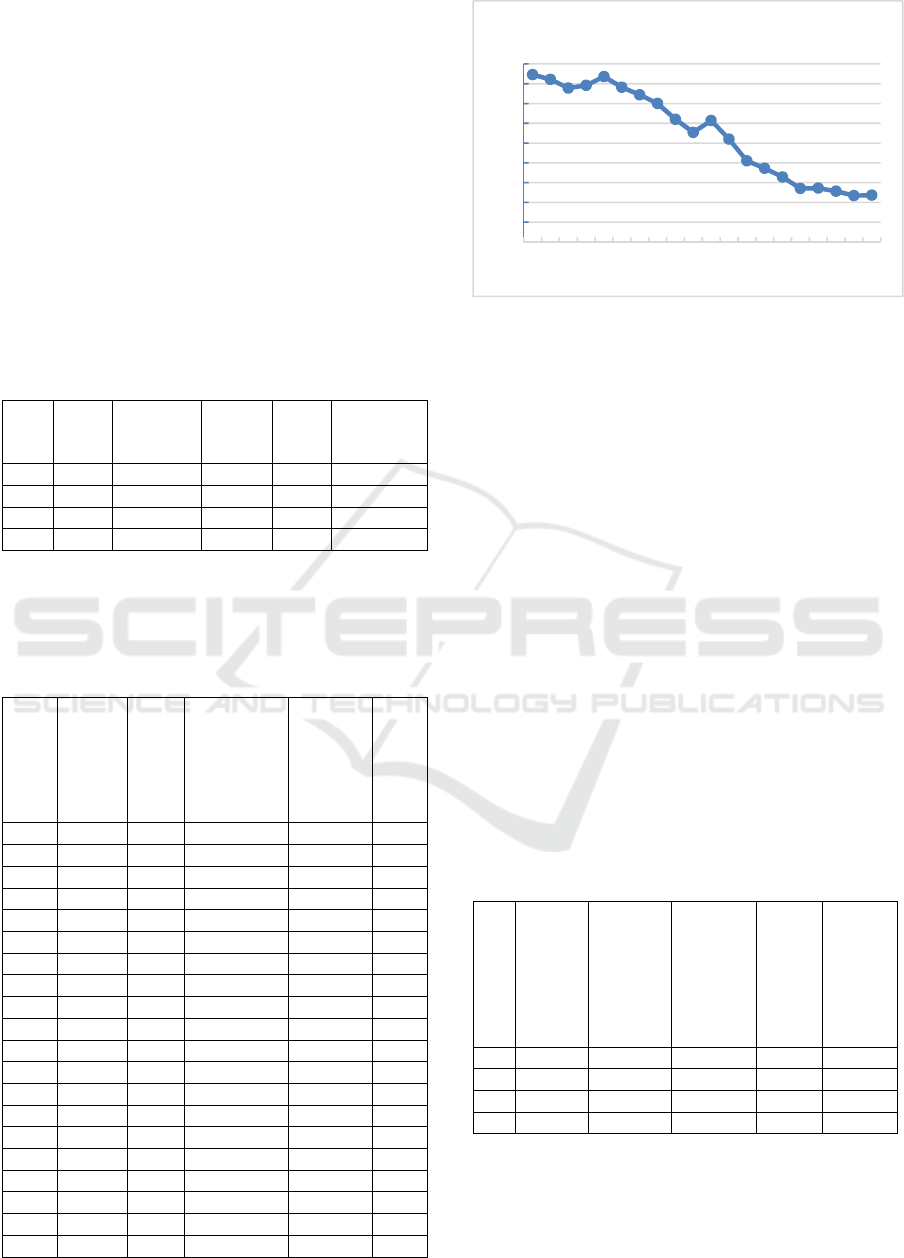
Figure 2: Trend map of the land coefficient of Zhaoqing in
the recent 20 years
The development situations of highway network
own the closest relationship with the economic
development level. It is planned to analyze the
changing principles of the land coefficient and
determine the land coefficient of future highway
development in Zhaoqing through analyzing the
development situations of highway network of
Zhaoqing in the recent 20 years and the development
situations of major social economy indexes of
Zhaoqing in the recent 20 years. It can be seen from
Tab.2 and Fig.2 that the land coefficient of highway
network development of Zhaoqing generally is
declining and tends to be stable.
With trend extrapolation applied, it can be
deduced that the land coefficients of Zhaoqing in the
future will be 0.96 in 2020, 0.75 in 2025 and 0.63 in
2030, with which the total scale of future highway in
Zhaoqing can be calculated. According to formulas
above, the calculated total scale of future highway in
Zhaoqing is as shown in Table 3.
Table 3: Table of Forecast Results of Total Scale of
Highway Network of Zhaoqing (land coefficient method).
Year
Area of
the
region
(km
2
)
The total
p
opulation
inside the
region
(ten
thousand
p
eople)
Per capita
GDP (ten
thousand
Yuan/pers
on)
the land
coeffi-
cient
The total
mileage
of
highway
network
(km)
2015 14856 405.96 4.867 1.18 14128
2020 14856 435 7.150 0.96 17449
2025 14856 462.5 9.568 0.75 18810
2030 14856 490 11.364 0.63 19316
3.4 Growth Curve Method
Combined with the data of the total mileage of
highway network of Zhaoqing in the recent 20 years,
0,0
0,5
1,0
1,5
2,0
2,5
3,0
3,5
4,0
4,5
1996
1997
1998
1999
2000
2001
2002
2003
2004
2005
2006
2007
2008
2009
2010
2011
2012
2013
2014
2015
The Land coefficient
Application of Combined Forecast Method in Highway Network Scale Forecast in Moderately Developed Cities
373
the three parameters, k, a and b , are calibrated
through least square method and it is obtained that
k=3610612.55, a = 0.001606 and b = 0.991756 .
The data of the total mileage of highway network of
Zhaoqing in 2020, 2025 and 2030 is forecast through
Compertz curve is as shown in Table 4.
Table 4: Table of Forecast Results of Total Scale of
Highway Network of Zhaoqing(Compertz curve method).
Yea
r
2015 2020 2025 2030
The total mileage of
highway network (km)
14128 19302 23863 29250
3.5 Combined Forecast of Variance-
covariance
Combined with forecast results of various methods,
with reference to the development principle of the
total scale of highway network of developed countries
and regions (when per capita GDP reaches 5,000
dollars, the total scale of highway network tends to be
stable), combined forecast of variance-covariance is
applied to finally determine that the total scales of
highway network in the whole city in 2020, 2025 and
2030 are 17500 km, 18500 km and 19000 km
respectively.
Table 5: Summary Table of Forecast Results of Total Scale
of Highway Network in Zhaoqing.
Forecast metho
d
\
y
ea
r
2020 2025 2030
The connectivit
y
metho
d
16015 17541 18303
The land coefficient metho
d
17449 18811 19316
The growth curve metho
d
19303 23864 29250
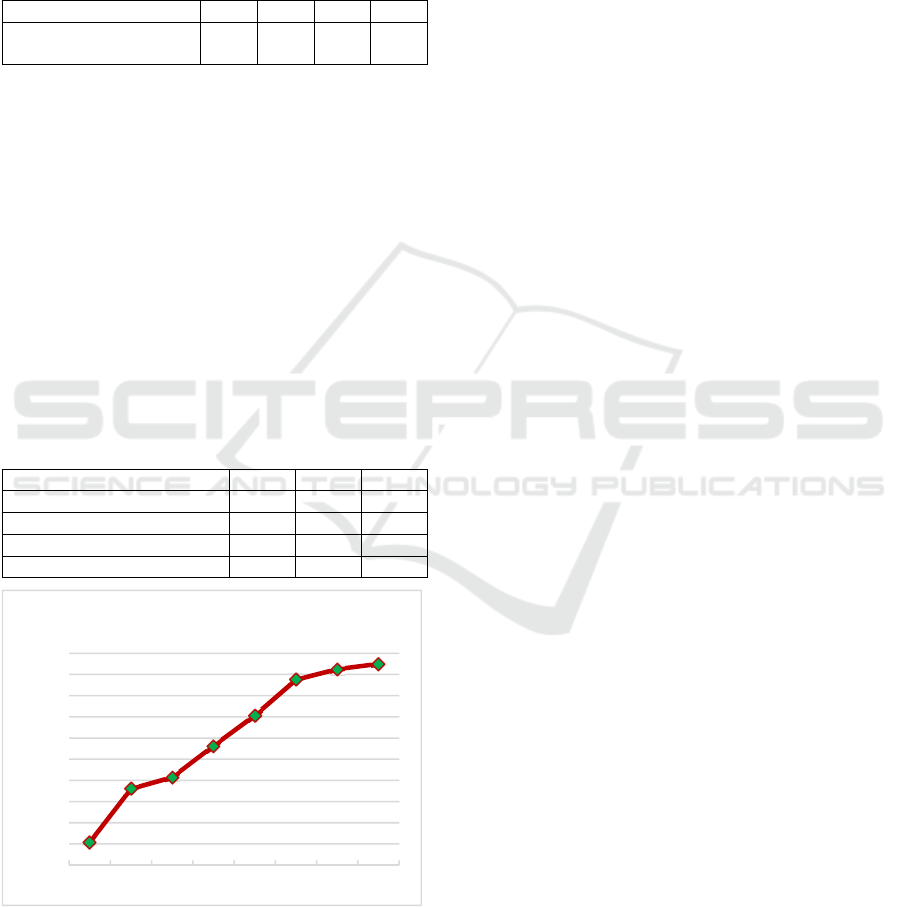
The combined forecast value 17500 18500 19000
Figure 3: The diagram of changes of total scale of highway
network in Zhaoqing from 1995 to 2030.
4 CONCLUSIONS
In this paper, after applying several quantitative
methods to forecast the scale of highway network, the
variance-covariance method is applied to combine the
forecast results, which improves the accuracy of
forecast results. The variance-covariance method is
also applied to the planning of highway network in
Zhaoqing, through which the feasibility and
maneuverability of forecast methods are verified. The
forecast results obtained provide reference for
decision-making of local competent department of
transportation, which further demonstrates that the
forecast method can be popularized and promoted in
the forecast of highway network scale of moderately
developed cities.
REFERENCES
Guo Xiaofeng.Application of land coefficient method in
total mileage forecast of highway network. Highway,
The second issue of 2005, Page 70-88.
Zhang Juanmin . Study on reasonable scale prediction
method of regional highway network. Highway, The
first issue of 2010, Page 159-163.
Wang Yingtao.Prediction of Regional Highway Network
Scale Base on Gray Correlation. China Transportation
Review, The second issue of 2015, Page 64-68.
Yi Junwei, Li Linbo, Wu Bing, Wang Yanli. Study on the
scale prediction of regional highway network.
Transportation Science & Technology, The first issue
of 2011, Page 100-103.
Liu Yi, Shi Liangqing, Jia Yuanhua. Study on reasonable
scale prediction of highway based on economic
adaptability. Journal of Transportation Systems
Engineering and Information Technology, The third
issue of 2010, Page 1-6.
Yu Jiangxia, Yu Jingqun, Wang Xuancang. Highway
Network Scale Prediction Based on BP Neural Network.
Journal of Chang’an University(Natural Science
Edition)
,
The first issue of 2006, Page 75-78
.
Pan Jibin, 2007. Research on the development planning of
Tibet highway. Southwest Jiaotong University,
Chengdu.
0
2000
4000
6000
8000
10000
12000
14000
16000
18000
20000
1995 2000 2005 2010 2015 2020 2025 2030
Total mileage of highway network (km)
ICECTT 2018 - 3rd International Conference on Electromechanical Control Technology and Transportation
374
