
The Comfort Measurement of Urban Railway Train Based on
UIC513 Standard
Limin Wang
1
and Chen Chen
2
1
Shanghai IRMT Co., Ltd. Minhang District, Shanghai, China
2
China Railway Eryuan Engineering Group Co., LTD. Liangjiang New Area, Chongqing, China
wanglm@irmtouch.com, ccalex164@163.com
Keywords: Urban Rail Transit, Comfort in Train Operation, Vibration Comfort, UIC 513.
Abstract: Combining with the characteristics of train operation of rail transit, this paper adjusted the measuring point
and measuring time in the UIC513 standard, so as to apply it to calculate the vibration comfort of urban
railway train. On this basis, the data acquisition equipment was made to implement the test of practical
carrying operation on Chengdu Metro Line 1. Meanwhile, by means of the UIC513 standard and the
improved method, the acquired data was used to calculate the comfort level respectively; finally, the results
were compared.
1 INTRODUCTION
Due to the constant increase of passenger flow
volume in urban rail transit, most passengers will
have to face the situation of taking the train by
standing; that is to say, the vibration and impact
during train operation will greatly influence their
travel experience. For this reason, the comfort of
train operation has become another research
emphasis in the ATO system following safety,
punctuality and energy conservation. The UIC513
standard in International Union of Railways renders
a model of calculating passengers’ comfort through
collecting the vibration acceleration of railway train.
Because of convenient calculation and explicit
output result, this standard is widely applied to the
train operation optimization of interurban railway.
Nowadays, the researches on comfort of urban rail
transit in China are few and they mostly adopt the
UIC513 standard directly. For example, via the
UIC513 standard and the Sperling stationarity
calculation model, Professor Zhu Jianyue from
Tongji University implemented experiment on
Shanghai Metro Line 1 and obtained the data
concerned on comfort and stationarity. According to
the operation characteristics of urban rail transit, this
paper adjusted the comfort calculation method in the
UIC513 standard and obtained an approach to
measure comfort of urban rail transit. Through
practical tests on Chengdu Metro Line 1, the comfort
data using the UIC513 and the adjusted method was
calculated and acquired. After comparing the above
results, the conclusion showed that the adjusted
method is more significant.
2 CALCULATION MODEL
2.1 Calculation Model of Comfort in
UIC513 Standard
UIC513 standard classifies the measurement of
comfort into three conditions, which include
simplified measurement method in sitting or
standing position, complete measurement method in
sitting position and complete measurement method
in standing position. This paper adopts the
simplified method applicable to both sitting and
standing positions, whose comfort calculation
formula is as follows:
222
95 95 95
6( )( )( )
ddb
WWW
MV XP YP Z P
Naaa
(1)
Where,
M
V
N
is a comfort index;
a
reoresents
effective acceleration and its superscript
i
W
is a
weight parameter;
,(,,)ii bcd
represents weight
curve, among which
b
is vertical weighing mode,
c
is seat backrest weighing mode,
d
is horizontal
weighing mode and the subscript
,(,,)
X
YZ
Wang, L. and Chen, C.
The Comfort Measurement of Urban Railway Train Based on UIC513 Standard.
In 3rd International Conference on Electromechanical Control Technology and Transportation (ICECTT 2018), pages 383-386
ISBN: 978-989-758-312-4
Copyright © 2018 by SCITEPRESS – Science and Technology Publications, Lda. All rights reserved
383
means the direction of axis measured by sensor; the
superscript
,(,,)
j
jAPD
stands for measurement
position, among which
A
is seat surface,
P
is floor
and
D
is seat backrest; and the subscript
k
is the
confidence parameter,
(50,95)k
means to
implement probability process based on confidence
coefficient of 50% or 95%. The ratings of comfort
indexes acquired by calculation are shown in Table
1.
Table 1: Comfort Level and Evaluation of UIC513.
Comfort
level
Evaluation scale
Comfort
Description
1 N<1 Very good comfort
2 1<N<2 Good comfort
3 2<N<4 Moderate comfort
4 4<N<5 Poor comfort
5 N>5 Very poor comfort
With respect to the railway train in suburbs, N
shall not be greater than 4; for common railway train,
N shall not be greater than 3, and the luxury train
shall be less than 2.
2.2 Acceleration Data Acquisition and
Processing Method in UIC513
Standard
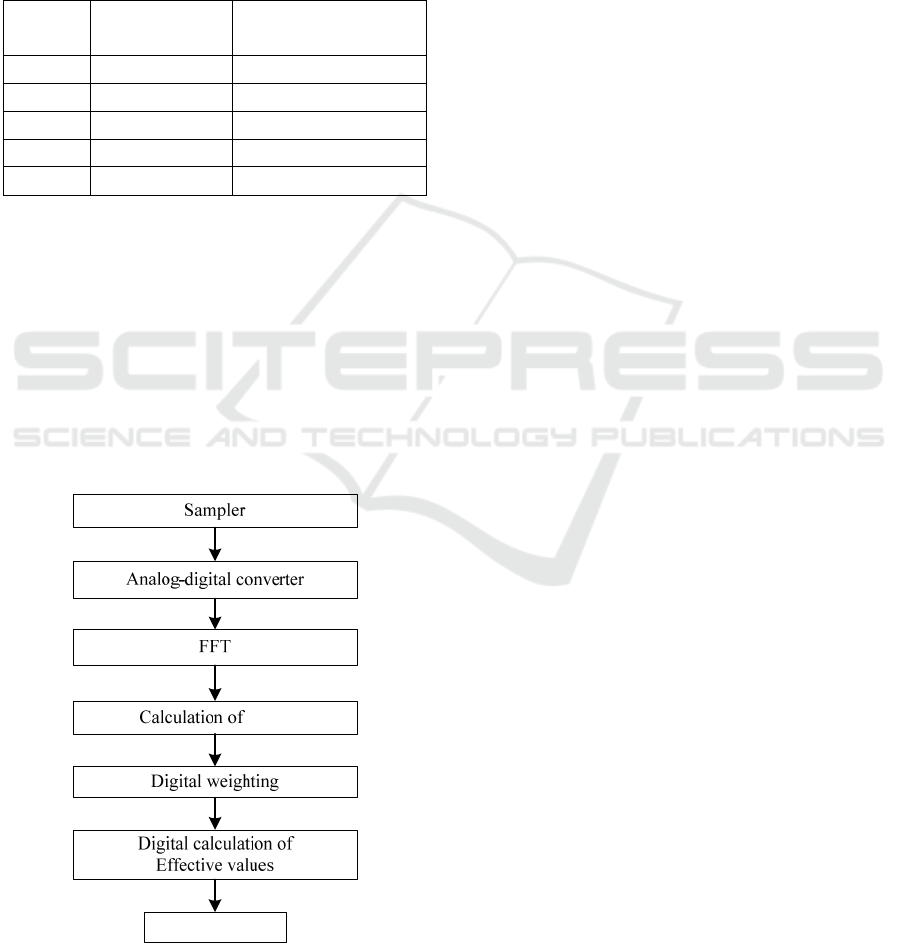
The calculation flow chart of each unit in digital
method is shown in figure 1.
*
ll
x
x
w
i
a
(,1,2)ai ti
()
lli
x
xf
*
ll
x
x
*
()
w
ll
x
x
Figure 1: Digital method of comfort calculation.
The sampling process was divided into multiple
5-minute continuous time quantums, where the data
in time length of 5 seconds was regarded as one unit
for calculation of weighed effective value; based on
the weighing calculation (see the Fig. for weighing
curve) of data in three directions of axis, the
weighting effective value was obtained. By taking
the confidence points with complete effective value
of 50% or 95% in single time quantum, the
acceleration in three directions was induced into the
formula (1) to obtain comfort value; finally, through
taking arithmetic mean of comfort value
corresponding to all continuous time quantms, the
comfort index of entire test railway section were
obtained.
2.3 Improvement Based on Operation
Characteristics of Urban Rail
Transit
There are prominent differences between urban rail
transit and interurban railway in vehicle type,
operation mode and passengers’ travel mode.
Therefore, the direct application of the UIC513
standard in calculating the operation comfort of
urban rail transit could result in deviations without
sufficient reference significance. For this purpose,
the measurement method recommended by the
UIC513 standard is adjusted as follows.
2.3.1 Adjustment of Measurement Time
The length of run time between two stations in most
of interurban railways is within 1-2 minutes, which
is shorter than 5 minutes. So train stopping for
passengers to get on and off will definitely appear
during the acquisition of vibration acceleration in 5
continuous minutes, whose data in calculation will
greatly influence the practical significance of
calculation result. For this reason, the complete run
time from the starting station to the next stop station
is set as the length of test time, where the data in
every second is regarded as one calculation unit.
2.3.2 Adjustment of Measurement Position
Different from interurban railway, most of
passengers have to take the urban rail transit by
standing, so the arrangements of test points are in
standing position (fixed on train floor). According to
the passenger distribution regularity in rush hour of
Chinese urban rail transit, the test points are adjusted
to the intersection points of each pair of doors and
the axle wire of carriage.
ICECTT 2018 - 3rd International Conference on Electromechanical Control Technology and Transportation
384
3 EXPERIMENTAL PROCESS
AND RESULT ANALYSIS
After communicating with operator, the practical test
was implemented on the south extension line of
Chengdu Metro Line 1, and then the test results were
analyzed briefly.
3.1 Experiment Process
The experimented train is a standard type B metro
vehicle, the test line is Chengdu Metro Line 1 South
extension line, whose starting point is the Guang Du
station, and its terminal is the Century City station,
the total mileage is 5.53 kilometers, and the running
time is about 8 minutes. The test time was at 9:00
a.m. The train was under the ATO AM mode. In
order to reduce disturbance to passengers, the test
was carried out in the end of experimented train
(carriage number 1011206). The test apparatus were
4 vibration acceleration gathering boards, which
were powered by dry cell and pasted on train floor
through packing tape before departure, as shown in
figure 2 The MPU6050 motion sensor was used to
collect the acceleration of three axes. After frame
encapsulation of data via the ARM Cortex-M4
processor, the HC-05 Bluetooth module sent the data
frame to laptop for digital weighing and comfort
calculation. Each axial sampling rate was set at
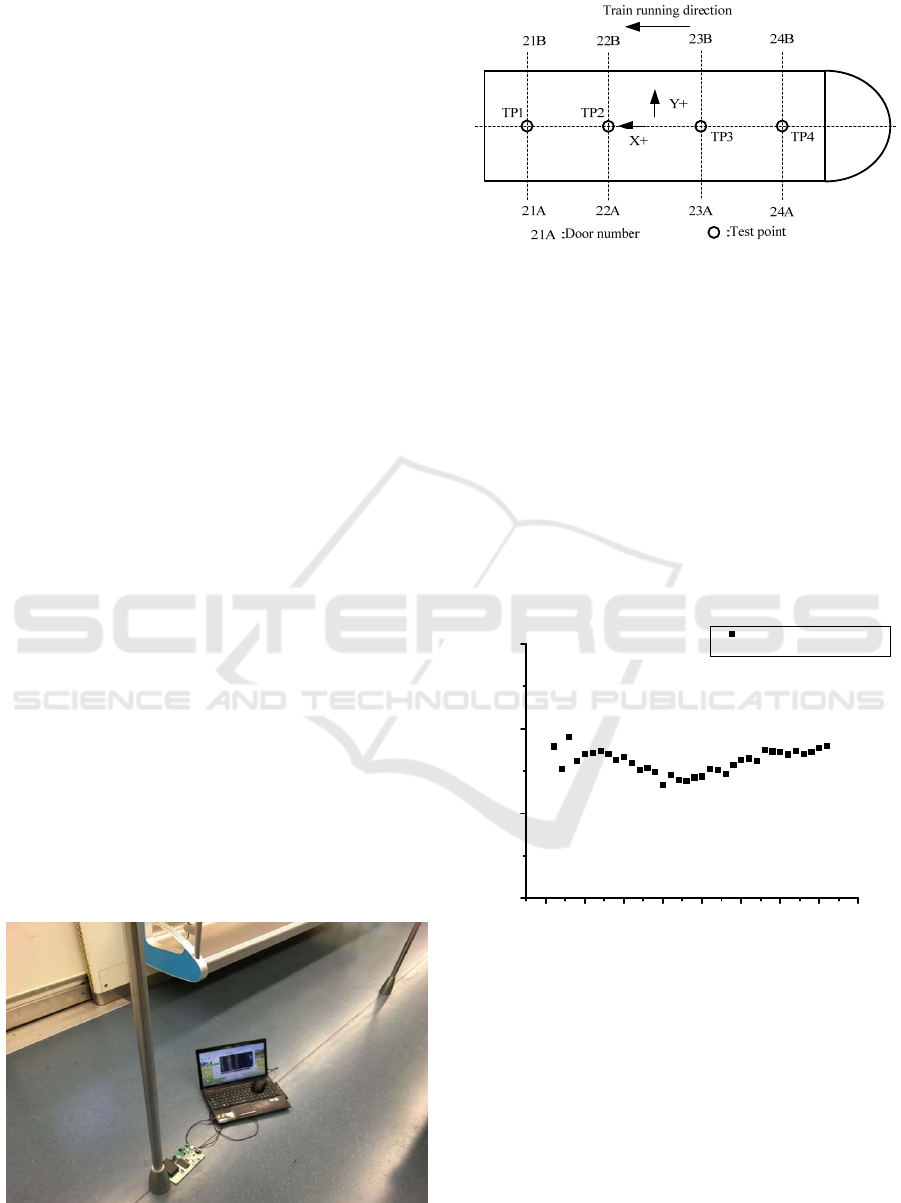
250Hz and the position is shown in figure 3. The
acceleration gathering boards kept working during
the entire experiment process. When calculating
comfort under the adjusted model, it is necessary to
distinguish train operation status based on the
variation acceleration data of X axle direction, so as
to introduce all acceleration data into the calculation
formula when the train is running but remove it
when the train is stopping for passengers to get on or
off from calculation.
Figure 2: Acceleration measuring device.
Figure 3: Sampling point distribution.
3.2 Result Analysis
After computing the average of vibration
acceleration measured at the same time in four test
points, the comfort is calculated according to the
method in the UIC513 standard. Considering
acceleration data in 5 continuous minutes as a group
of samples and data in every 5 seconds as one
computing unit, the whole recording period of 480
seconds can generate 36 groups of comfort data,
which are shown in figure 4. This indicates that the
comfort of this travel is evaluated as good comfort.
0 5 10 15 20 25 30 35 40
0
1
2
3
Comfort value calculated
with UIC513 code
Comfort degree of UIC513 standard
Data samples (5Mins each)
Figure 4: Comfort values calculated with method of
UIC513 Standard.
Table 2 shows the comfort calculated by the
vibration acceleration of 4 test points with adjusted
method. It shows that the comfort values of all test
points are within the interval 2-3, which are rated as
moderate comfort. Notablely, the comfort of TP2
and TP3 test points, which are in the middle of
carriage are superior to that of TP1 and TP4 in two
ends. It is speculated that this could be caused by the
relatively large vibration in TP1 and TP4 which are
located above bogies.
The Comfort Measurement of Urban Railway Train Based on UIC513 Standard
385
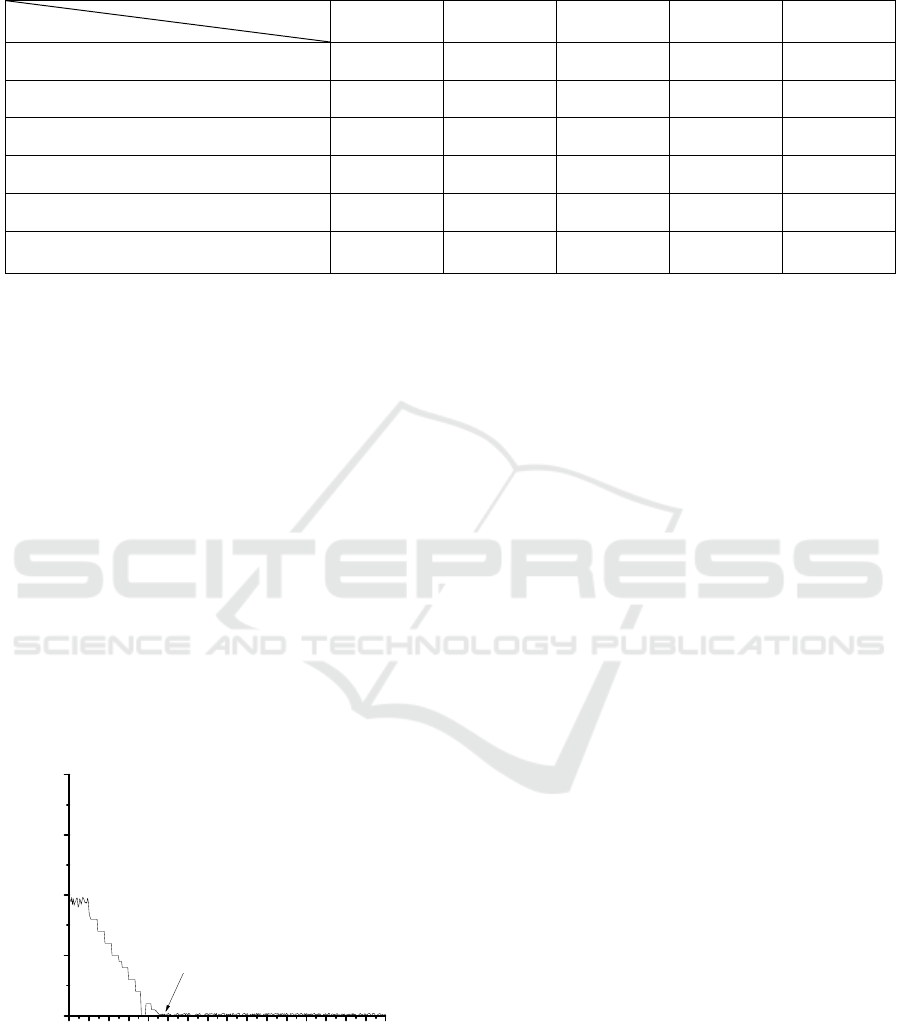
Table 2: Comfort values calculated with adjusted method.
Test point
Section name
TP1 TP2 TP3 TP4 Average
Sihe-Guangdu 2.443 2.248 2.256 2.627 2.3935
Huafu Avenue-Sihe 2.899 2.727 2.593 2.999 2.8045
5th Tianfu Street-Huafu Avenue 2.573 2.203 2.265 2.714 2.4388
3rd Tianfu Street-5th Tianfu Street 2.482 2.166 1.986 2.465 2.2748
Century City-3rd Tianfu Street 2.987 2.795 2.470 2.890 2.7855
Average value of a fixed TP during whole
tri
p
2.677 2.428 2.314 2.739 2.5395
The comparison between data in figure 4 and the
average comfort values of 4 test points in the same
interval in Table 2 indicates that their variation
tendency conforms to each other. However, the
average comfort values acquired by directly
adopting the UIC513 standard are greater than the
values acquired by the adjusted method. Analyzing
the acceleration data of samples, this situation
caused by exclusion of the data during train stopping
from calculation with the adjusted method, this is
shown in figure 5. As the UIC513 standard
stipulated, the trains shall be in operation state
during the process of gathering acceleration. On this
premise, when the interurban train stops at station,
the acceleration values are approaching to 0 emerged
in three directions simultaneously. The train will be
regarded as in the state of uniform linear motion, in
another word, the train runs stably. Therefore, the
comfort value acquired by calculation is much lower
while the comfort evaluation is higher.
012345678910111213141516
0.0
0.5
1.0
1.5
2.0
Absolute value of acceleration(m/s
2
)
Tim
e(s)
The train has stopped at this moment
Figure 5: Acceleration data from x-axis of train parking
period.
4 CONCLUSIONS
Based on above analysis, this paper believes that by
stetting test points according to passenger flow
density and removing the acceleration data acquired
during train stopping from the calculation unit,
comfort value obtained by the adjusted model, is
more practical and representative than the that
obtained directly applying the UIC513 standard. The
model of adjusted method can provide reference for
the comfort optimization of the ATO system in
urban rail transit.
REFERENCES
Zhu J.Y., Zhu, L.G., Zhou, J.S. and Ren, L.H., 2007.
Evaluation of riding comfort and stability index.
Urban Mass Transit, 35(6), pp.28-31.
International Union of Railways, 1995.
Guideline for
evaluating passenger comfort in relation to vibration
in railway vehicles
. UIC 513 code.
Zhang, B., Lin, J.H., Wu, C.H. and Wang, F., 2008.
Design and implementation of the test apparatus for
measuring the comfortableness and smoothness of
trains. China Railway Science, 29(1), pp.134-138.
Zhang, Q., Yang, X., Zhang, Z.Y. and Lu, Q.Y, 2012.
Design and realization of serial communication in
bluetooth module.
Research and exploration in
laboratory,
31(3), pp.79-82.
Ni, C.S., Wang, Y.M, 2003. A brief discussion for ride
index and comfort. Railway Locomotive & Car, 23(6),
pp.1-3.
Chen, X. and Li, F., 2010. Evaluation model and empirical
analysis of ride comfort of high-speed trains based on
factor analysis and AHP. Journal of The China
Railway Society,
32(1), pp.13-18.
ICECTT 2018 - 3rd International Conference on Electromechanical Control Technology and Transportation
386
