Buildin
g
Chan
g
e Detection with UAV Ima
g
es
Tao Wang
Guangzhou Institute of Geography, Guangzhou, China
Keywords: UAV, change detection, DSM.
Abstract: In this article, we try to extract DSM in urban area by photogrammetry. Firstly, image orientation are
calculated by GPS-supported bundle adjustment. Then, DSM are extracted from urban by multi-view dense
match method SURE. DSM difference are generated from two DSM in different time to detect change of
building. This method has good effect in detecting change of village in city.
1 INTRODUCTION
Due to the unprecedented technology development
of sensors, platforms and algorithms for 3D data
acquisition and generation, 3D spaceborne, airborne
and close-range data, in the form of image based,
Light Detection and Ranging based point clouds,
Digital Elevation Models and 3D city models,
become more accessible than ever before. Change
detection or time-series data analysis in 3D has
gained great attention due to its capability of
providing volumetric dynamics to facilitate more
applications and provide more accurate results.
The European Spatial Data Research
Organization started a benchmark on image based
digital surface model (DSM) generation in February
2013. This test is based on two representative image
blocks, which were processed by different groups
with different software systems. There is only city in
the image blocks. There is no test on the forest area.
There is still some problem in the city. Because
there are a lot of shade in the image.
In this article, we try to detect change in urban
area by UAV photogrammetry method.
2 MATERIALS
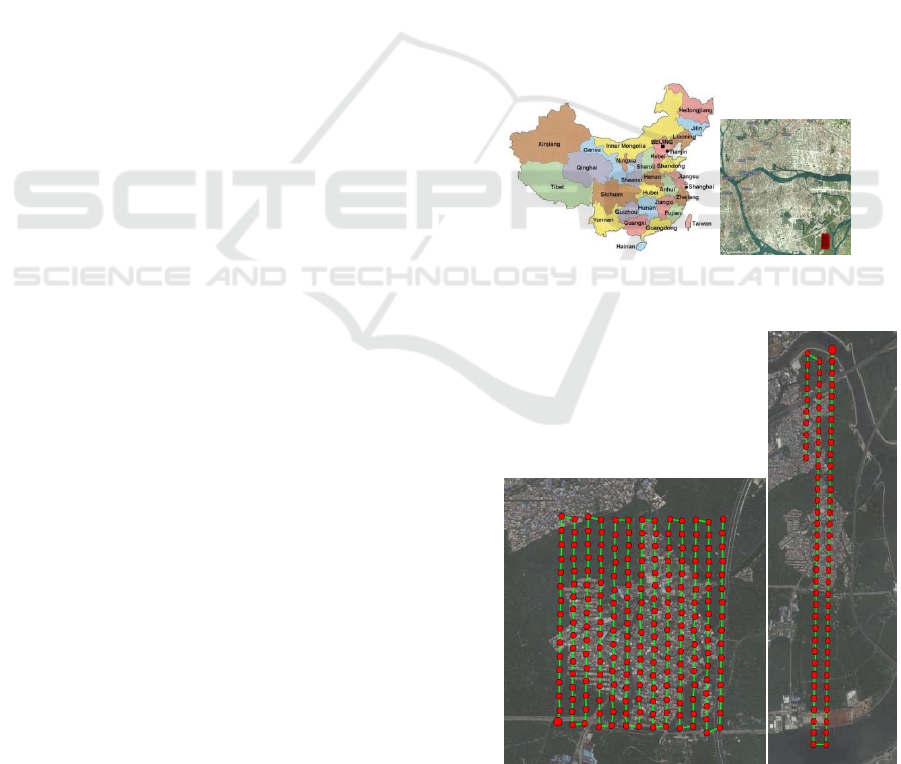
2.1 Study area
The test site was located at Guangzhou, Guangdong
Province in Southern China (38◦ 32’ N, 100◦15’ E).
Aerial images used in this study were acquired on
June 8, 2015 and 2016. Figure 1 shows the location
of the test area. Figure 2 shows the flight lines in
2015 and 2016.
Figure 1: Location of test area
Figure 2: image of test area
564
Wang, T.
Building Change Detection with UAV Images.
In 3rd International Conference on Electromechanical Control Technology and Transportation (ICECTT 2018), pages 564-567
ISBN: 978-989-758-312-4
Copyright © 2018 by SCITEPRESS – Science and Technology Publications, Lda. All rights reserved
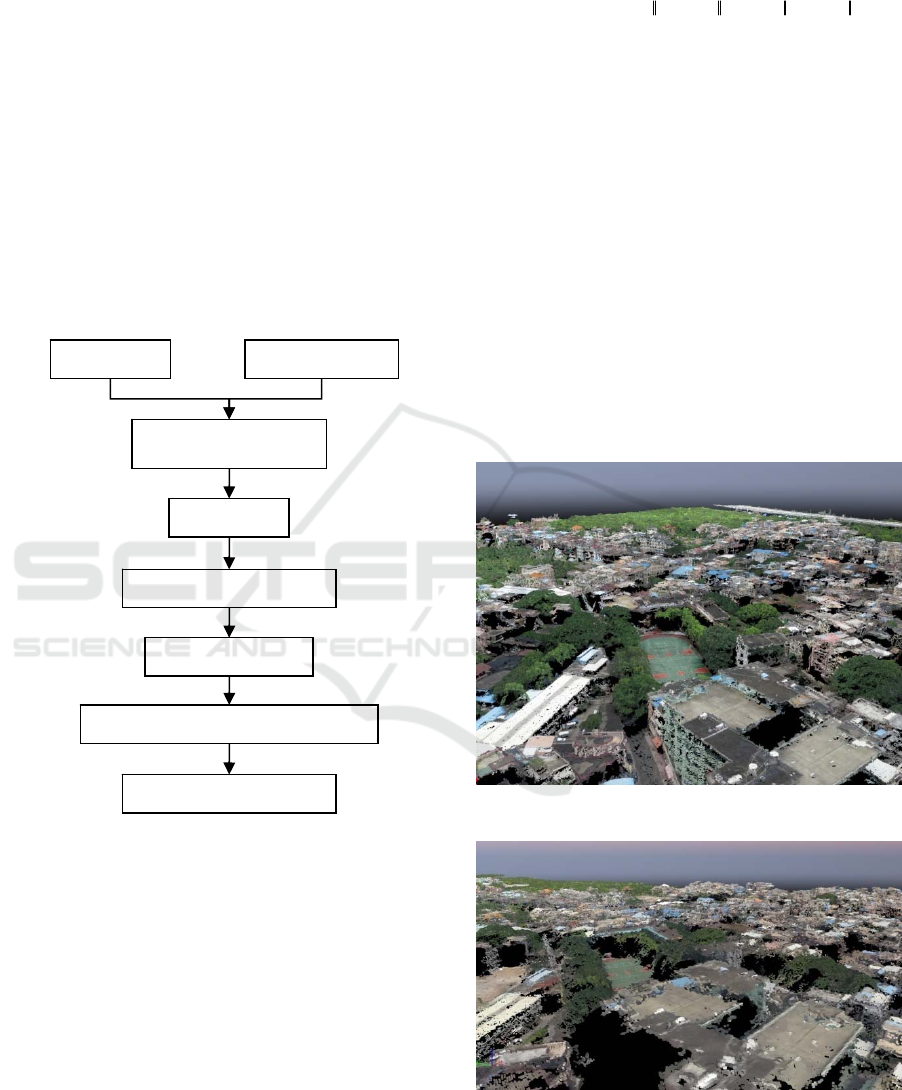
3 METHOD
This method includes accurate image orientation,
DSM extraction, and change detection. After the
images were captured, they were matched to
generate connection points. A bundle block
adjustment was then used to obtain the accurate
orientation parameter. The DSM was generated
using dense matching. It is difficult to set control
points. Therefore, we obtained the image orientation
parameters by using a GPS-supported bundle
adjustment, then a multi-view dense match to
generate the dense matched point cloud. Figure 3
shows the algorithm flow chart.
Figure 3: algorithm flow chart
Original image has initial orientation parameter,
then we use the sift algorithm to extract feature
points, use the kd-tree and ransac algorithms to
extract match points.
We use the bundle adjustment to calculate the
accurate orientation parameters.
We used a SURE(Photogrammetric Surface
Reconstruction from Imagery) algorithm to generate
the dense matched point cloud. It applied the SGM
algorithm to match between image pairs, and then
fused the results to obtain the resulting point clouds.
The SGM algorithm aims to estimate disparities
across stereo pairs such that the global cost function
shown in equation (1) is minimized.
12
(D) ( (x , D(x ))) D(x ) D(x ) 1 D(x ) D(x ) 1
bN N
bb b N b N
xx x
EC PT PT
(1)
In this equation
D
represents the disparity image
holding estimates of all base image pixels
x
b
. T is
an operator that evaluates whether the subsequent
condition is true and is set to zero if false.
x
N
denotes the base image pixels in the neighborhood
of
x
b
. The global cost function,
E
, is composed of
a data term and two terms representing smooth
surfaces. The data term is computed using pixel-
wise similarity measures
(x , x )
bm
C . The penalty
parameters,
1
P and
2
P , control the gain of surface
smoothing (Rothermel et al., 2011; Rothermel et al.,
2012; Wenzel et al., 2013).
Figure 4: 2015 Dense matched cloud point
Figure 5: 2016 Dense matched cloud point
image GPS/POS
data preparation
match
b
undle adjustmen
t
dense match
registration of cloud poin
t
difference of DSM
Building Change Detection with UAV Images
565
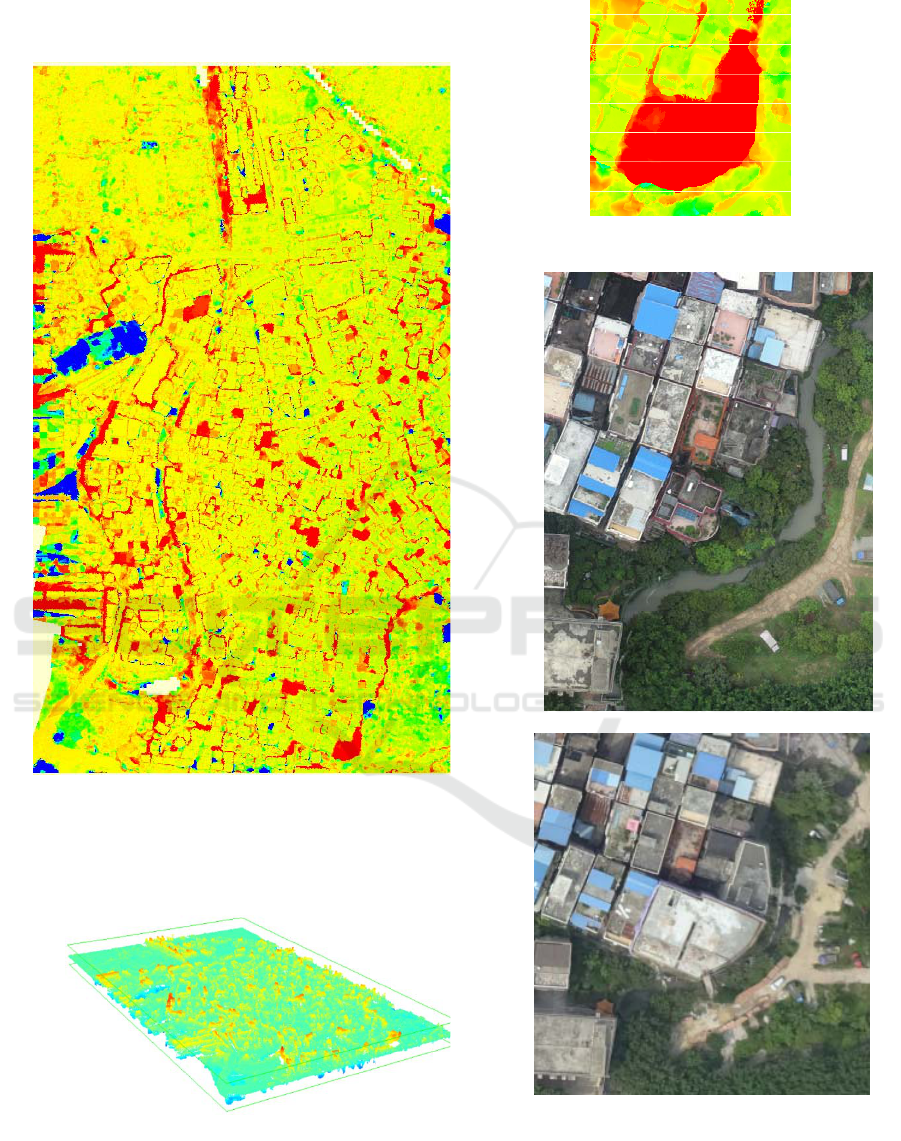
After the DSM was calculated, then we match the two
DSM by using the ICP algorithm. after that, we calculate
the difference of the two DSM.
Figure 6: change of two DSM
Figure 7: change of DSM in 3D
Figure 8: difference of DSM in local area
Figure 9: two uav images in the change area
Figure 6 shows the result of difference of two
DSM. Figure 7 shows the 3D display of the
difference. By analysing the difference, we can find
where is the change area. In the figure 6, difference
ICECTT 2018 - 3rd International Conference on Electromechanical Control Technology and Transportation
566

is zero in most yellow area. the difference is big in
the red area and blue area, the difference is negative
value in blue area, difference is positive value in the
red area. Here, we should detect the unauthorized
construction, so we analyse the red area.
4 CONCLUSIONS
We use photogrammetry method, get the cloud point
of the research area. We detect change in the urban
area by the difference of DSM from different time.
We can detect change area in the difference image
successfully.
There are a lot of dense match error in the river,
forest. That is what we should do in the future.
ACKNOWLEDGEMENTS
This research was funded by the Project for Young
Scientist Fund sponsored by the Natural Science
Foundations of Guangdong province.
REFERENCES
Rongjun Qin, Jiaojiao Tian, Peter Reinartz , 2016, 3D
change detection – Approaches and applications,
Photogrammetric & Remote Sensing.
Haala, N. 2013. The Landscape of Dense Image Matching
Algorithms, Photogrammetric Week 2013, Wichmann
Verlag, Berlin/Offenbach.
Zhang Li.2005. Automatic Digital Surface Model (DSM)
Generation from Linear Array Images. Swiss Federal
Institute of Technology Zurich for the degree of
Doctor of Technical Sciences.
Waser,L.T.,Baltsavias,E.,Ecker,K.,Eisenbeiss,H.,Ginzler,
C.,Küchler,M., Thee,P. and Zhang,L.2008.High-
resolution digital surface models (DSMs) for
modelling fractional shrub/tree cover in a
mireenvironment,International Journal of Remote
Sensing.
Baltsavias, E.,Gruen, A.,Eisenbeiss,H.,Zhang,L. and
Waser,L. T.2008. High-quality imagematching and
automated generation of 3D tree models[J],
International Journal of Remote Sensing.
Yasutaka Furukawa, High-Fidelity IMAGE-BASED
MODELING[D], 2008.
Hirschmüller, H., 2008. Stereo Processing by Semiglobal
Matching and Mutual Information. IEEE Transactions
on Pattern Analysis and Machine Intelligence.
Rothermel, M., Wenzel, K., Fritsch, D., Haala, N.2012,
SURE: Photogrammetric Surface Reconstruction from
Imagery[C]. Proceedings LC3D Workshop, Berlin
,December 2012
Wenzel, K., Rothermel, M., Fritsch, D., and Haala, N. ,
2013, Image Acquisition and Model Selection for
Multi-View Stereo[C], Int. Arch. Photogramm.
Remote Sens. Spatial Inf. Sci.
Building Change Detection with UAV Images
567
