
Draft Survey Based on Image Processing
Wang Zhang, Ying Li and Wenhai Xu
Information Science and Technology College, Dalian Maritime University, Linghai Road, Dalian, China
{zhangwang, ly_123, xuwenhai}@dlmu.edu.cn
Keywords: Draft survey, climbing robot, image processing, neural network, color image segmentation.
Abstract: A draft survey system based on digital image acquisition and processing was designed and implemented to
overcome the shortcomings in the conventional manual reading method. The method of draft image
acquisition using the climbing robot as a carrier for the network camera was proposed. While climbing
along the complex surfaces of the hull under the control of a tablet, the robot could be assigned to shoot the
draft and continuously capture high-definition images covering several wave periods. The images were first
preprocessed morphologically, and the draft character was then identified by the neural network algorithm
so as to numerically represent the draft. Meanwhile, the draft line was identified by using the color image
segmentation algorithm. By doing so, the interference of fake waterline caused by the infiltration of waves
was successively eliminated, so as to accurately locate the draft line. Field experiments showed that
determining the ship’s draft by comparing the relative locations of the draft line on the numerically
represented draft could achieve a final identification accuracy of 1mm for the detected values, significantly
higher than that of 5mm by manual reading.
1 INTRODUCTION
Draft survey is an internationally accepted approach
for the cargo transfer of water transport. It is mainly
used for weighting bulk cargoes, such as coals,
which are at low price and difficult to weight by
instruments. Based on the Archimedes’ principle,
draft survey takes the ship itself as the measuring
tool and calculates the hull displacement by
measuring the ship draft. Then the cargo weight can
be calculated by combining the parameters, such as
level of ballast water and port water density, and
referring to the “Hydrostatic Data Table” (Liu,
Zhang, Sun and Yin, 2014). Conventionally, draft
survey is performed by reading the ship’s draft on
the draft marks, which usually needs to be done by
professionals. Since the weather conditions at the
arrival of a ship may not be constant, and the draft
survey must be conducted immediately after arrival
to ensure the subsequent loading and unloading
operations. The results are susceptible to wind,
waves and subjective factors. It is also impossible
for later inspection.
In this paper, to address the problems of manual
reading, a draft survey system based on image
acquisition and processing was designed and
implemented. In the system, the draft images were
captured by the climbing robot that carried network
HD camera, and the close-up imaging of the marks
near the draft line ensures the quality of the
materials for image processing. The draft was
determined by the draft numerical representation
algorithm based on neural network and the draft line
identification algorithm based on color image
segmentation. Moreover, the integrated analysis of
the images covering several wave periods could
effectively improve the detection accuracy. At the
same time, all relevant data were recorded in the
database, guaranteeing later inspection of the
measurements and thus avoiding the possible trade-
related disputes (Li, Bao and Xu, 2012).
2 SYSTEM COMPOSITION
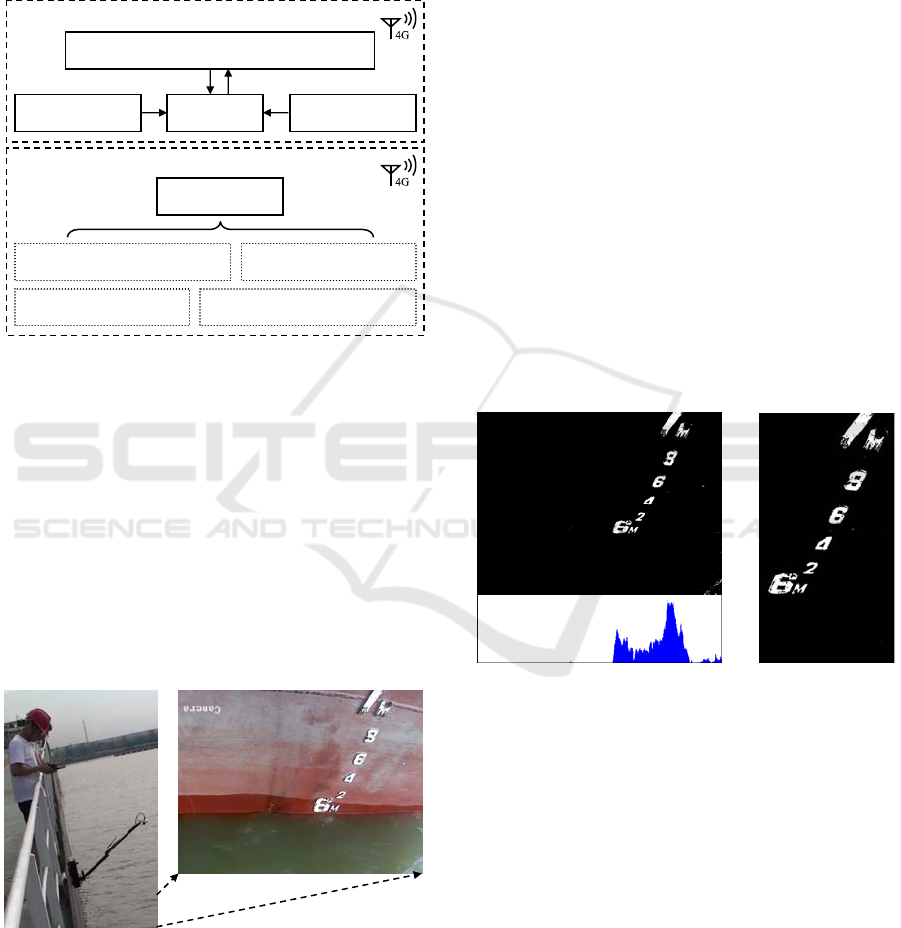
The draft survey system was divided into an on-site
data acquisition sub-system and a back-end data
processing sub-system, as shown in Fig. 1. The data
acquisition sub-system was composed of the
climbing robot, level meter, densitometer, and tablet
computer. Under the control of the tablet, it could
capture the draft images, measure the level of ballast
water and the port water density, and upload data to
the server via 4G network. The data processing sub-
642
Zhang, W., Li, Y. and Xu, W.
Draft Survey Based on Image Processing.
In 3rd International Conference on Electromechanical Control Technology and Transportation (ICECTT 2018), pages 642-647
ISBN: 978-989-758-312-4
Copyright © 2018 by SCITEPRESS – Science and Technology Publications, Lda. All rights reserved
system centered on the programs of draft numerical
representation, draft line identification, load
calculation, and database application running on the
server. It received the draft images sent by the tablet,
calculated the ship’s load, and returned it to the
tablet for the operator while backing up in the
database for later inspection.
Figure 1: Composition of draft survey system.
3 DRAFT IMAGE PROCESSING
A typical draft image uploaded by the data
acquisition sub-system to the data processing sub-
system is shown in Fig. 2. The operator could drop
the robot at any point from the ship’s sides and
control the robot to climb on the hull with the tablet.
According to the real-time view sent by the camera,
the acquisition of draft images could be done even
for the non-visible areas.
Figure 2: The draft image of bulk carrier An** captured
by the climbing robot.
3.1 Numerical Representation of Draft
The original draft images captured by the camera are
not suitable for the numerical representation of the
draft. This is mainly due to the fact that most of the
original images are subjected to the noises of stains
and character distortion caused by shooting angle.
What’s more, it takes longer to process the larger
images. Therefore, the original images must be first
transformed into binary ones, and statistical mapping
should be plotted vertically to crop the images. Since
the draft characters with distinctive white features
can form a clear contrast against the background, it
will be easy to choose a fixed threshold for turning
the images binary after the original images have
been transformed into grayscale. The watermark of
the camera at the fixed area should be removed from
the image and the statistical mapping should be
plotted vertically as shown in Fig. 3 (a). As can be
seen by comparison, the draft character vertically
arranged in the binary image present an obvious
stepped increase in their counts in the corresponding
mapping. On this basis, it is possible to crop the core
area where the draft is located, as shown in Fig. 3
(b).
Figure 3: Preprocessed results of the draft image: (a)
vertical statistical mapping of the binary image, (b) the
cropped core
area.
If there is no obvious noise in an image, the
mapping can be then plotted horizontally, in order to
crop image of single characters and thus start
character identification. However, before that, noise
reduction and shear correction of the image could
effectively improve the accuracy of subsequent
character identification. Given that the characters on
the standard metric draft markings contain only the
Arabic numerals “0-9” and the capital letter “M”,
this paper adopted morphology-based noise
reduction algorithm. The key operations involved
are mathematically described by Eq. (1) and (2):
(a) (b)
Data acquisition sub-
s
ystem
Climbing robot carrying network HD camera
Tablet Level meter Densitometer
Data processing sub-
s
ystem
Data server
Draft numerical representation Draft line identification
Load calculation Database application
Draft Survey Based on Image Processing
643

BBABA ⊙
(1)
BBABA ⊙
(2)
where
denotes opening operation, denotes
closeing operation,
⊙
denotes erosion, and
denotes dilation. As implied by the combination of
erosion and dilation, opening operation can
eliminate the small prominences of isolated noise
points, thin lines, and edges, while closeing
operation can eliminate the internal small holes and
curves (Said, Jambek and Sulaiman, 2016).
Comparing Fig.3 (b) before processing and Fig.4 (a)
after processing, it can be found that the jagged
prominences of edges of the characters are
noticeably eliminated, and the noises caused by a
few large stains can be removed in further character
cropping.
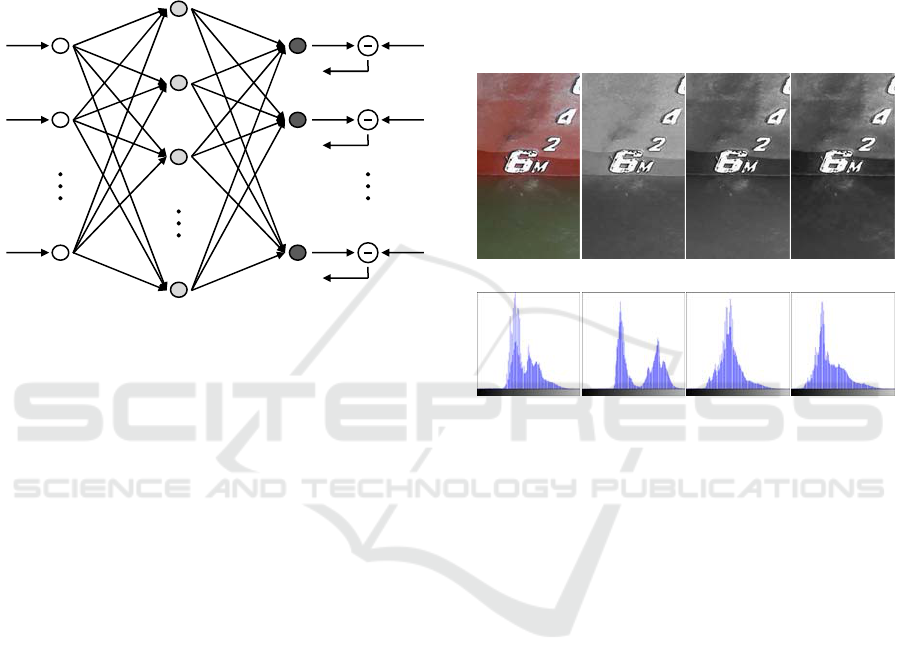
Figure 4: Preprocessed results of the draft image: (a)
image after noise reduction, (b) the cropped character, (c)
mapping of the character image in different directions, and
(d) the character image after shear correction.
The majority of the cropped characters would
still be deformed, because of the shooting angle of
the robot, as shown in Fig.4 (b). Since it could be
difficult for the robot to maintain a stable stance on
the raised draft characters, images could only be
taken from the diagonal tops of the characters. As a
result, the draft characters in an image would
inevitably be sheared horizontally. The angle of
shear-warp can be extracted by using the mapping
method shown in Fig.4 (c), that is, when the
mapping angle θ is equal to the shear-warp angle,
the mapping length L can be the minimum (Liu,
2017). Let the coordinates of a pixel point in the
image be P (x, y), after the shear correction by using
affine transformation, the coordinates P' (x', y') can
be expressed as follows:
1100
01tan
001
1
y
x
y
x
(3)
The correction is performed using a bilinear
interpolation method. The output pixel value is the
average of a 2×2 field samples in the input image, as
shown in Fig.4 (d).
Among many of the draft character identification
methods that have been tried, the template matching
and the neural network algorithms are considered to
be effective (Ran and Peng, 2012). The former often
uses simple features for comparison, so the
algorithm can be conveniently implemented; but the
characters like “6”, “8”, and “9” that are
morphologically similar are poorly distinguished,
especially if the characters are defaced by sea water
erosion. The latter identifies the character by the
weights of various features, resulting in higher
identification accuracy, and its complex algorithm is
affordable for high-performance servers (Kim and
Xie, 2015).
The typical BP-neural network used in this paper
consists of three layers: input, hidden, and output
layers. Neurons in adjacent layers are connected to
each other, while neurons in the same layer are not
connected. As shown in Fig.5, the neural network’s
inputs are x
1
, x
2
, …, x
i
, …, x
N
; the hidden layer’s
outputs are y
1
, y
2
, …, y
j
, …, y
L
; the neural network’s
outputs are o
1
, o
2
, …, o
k
, …, o
M
; the weight from
input layer to hidden layer is v
ij
; the weight from
hidden layer to output layer is w
jk
. For neuron
outputs at the hidden and output layers, there is:
N
i
iijjj
xvfnetfy
1
(4)
L
j
jjkkk
ywfnetfo
1
(5)
The commonly used unipolar Sigmoid function
x
e
xf
1
1
is selected as the activation function.
According to the specific needs of draft character
identification, the input layer contains 93 neurons,
covering various parameters such as the character’
contour, projection, and discrete Fourier features.
The output layer contains 11 neurons, corresponding
to the numbers “0-9” and the letter “M”, respectively.
The hidden layer contains 48 neurons and connects
the input and output layers via the full connection, in
order to achieve the forward transmission of
information and the backward transmission of error.
When the output results generated by the input
(a) (b) (d)
(c)
L (θ = 0°)
L (θ = -19°)
ICECTT 2018 - 3rd International Conference on Electromechanical Control Technology and Transportation
644
feature parameters do not match the expected values,
the error will be transmitted backwards. Moreover,
the weight between layers will be adjusted in a
gradient descent manner, until the correct output
results are obtained after repeated attempts, thus
forming a widely applicable structure of neural
network.
Figure 5: The structure of neural network used for
character identification.
3.2 Identification of Draft Line
The key to draft line identification is how to
accurately identify the intersection between the hull
and the water surface. Drawing on the previous
experience of edge detection, the effects of various
edge detection operators such as Sobel, Reborts, Log,
Zerocross, Canny, and Susan were compared in the
experiment (Yu and Zhang, 2015). Among them,
operators Sobel and Reborts can digitally
approximate the first derivative to extract the edges,
but a lot of noises may be left in the processed image.
Operators Log and Zerocross use the filtering
function to carry out convolution of the image.
Compared to operators Sobel and Reborts, they are
effective in smoothing the image, but double edges
are easily generated as well. The difficulty in
applying operator Canny lies in how to determine
the size and threshold of Gaussian filter, while the
fixed Gaussian filter can hardly detect the edge
structures of different scales. Operator Susan has a
strong anti-noise capacity, but an appropriate
threshold is also difficult to select.
In addition, when using conventional edge-
detection operators for image processing, there are
often two indistinguishable draft lines, especially
when the weather is fine. As clearly shown in the
original Fig.6 (a), the upper half of character “6” has
an area created by undulating infiltration on the hull.
The gray values of this area and the non-infiltrated
area form a significant discontinuity, even more
evident than the difference between them and the
water surface. In the practical detection, therefore, it
can be tricky to determine which one is the real draft
line. Furthermore, the fluctuation of the water
surface and the resulting changes in the reflected
light may create obvious discontinuity in the gray
image, seriously affecting the actual effect of the
conventional edge detection operators.
Figure 6: RGB components and their histograms of the
draft image: (a) the draft image, (b-d) RGB components,
(e) histograms of the draft image, and (f-h) histograms of
RGB components.
Given the obvious difference in colors between
the hull and the water surface, this paper used the
color image segmentation algorithm to achieve the
accurate identification of the draft line. As suggested
by Fig.6 (e), which is the histogram of Fig.6 (a), the
bimodal distributions are caused by the subtle color
differences. By extracting the components of R (red),
G (green), and B (blue) of the
draft image and
comparing their histograms, it can found that the
histogram corresponding to the R
component presents
a significant bimodal distribution, while the other
components show the unimodal distribution. The
hulls of bulk carriers are always painted bright red,
while the water surrounding the cargo terminals is
generally muddy. As a result, there can be an evident
contrast between the two, leading to a distinctive
bimodal distribution of the histogram of R
component.
Influenced by the unimodal distribution of the other
two components, this feature is not obvious in the
original image. For this reason, the minimum gray
value between the two peaks in the histogram of R
(a) (b) (c) (d)
(e) (f) (g) (h)
Input layer
Hidden layer
Output layer
x
1
x
2
x
N
o
1
o
2
o
M
y
1
y
2
y
L
y
3
d
1
d
2
d
M
e
1
e
2
e
M
v
ij
w
jk
Draft Survey Based on Image Processing
645
component was taken as the threshold, so as to
accurately segment the images. The theoretical basis
is that the gray values of the pixels adjacent inside
the targets or the background area similar, while
those of the pixels between the target and the
background are different (Peng, Zhou and Lei, 2017).
Therefore, the target and the background correspond
to different peaks in the histogram. For the pixel
point
R (x, y) of R component, the valley T between
two peaks in the histogram is selected as the
threshold. Then the segmented binary image
R
BW
(x,
y) can be expressed as:
TyxRb
TyxRa
yxR
,,
,,
,
BW
(6)
where
a=1 denotes the target, b=0 denotes the
background, that is, the hull and the water surface
are segmented in the image.
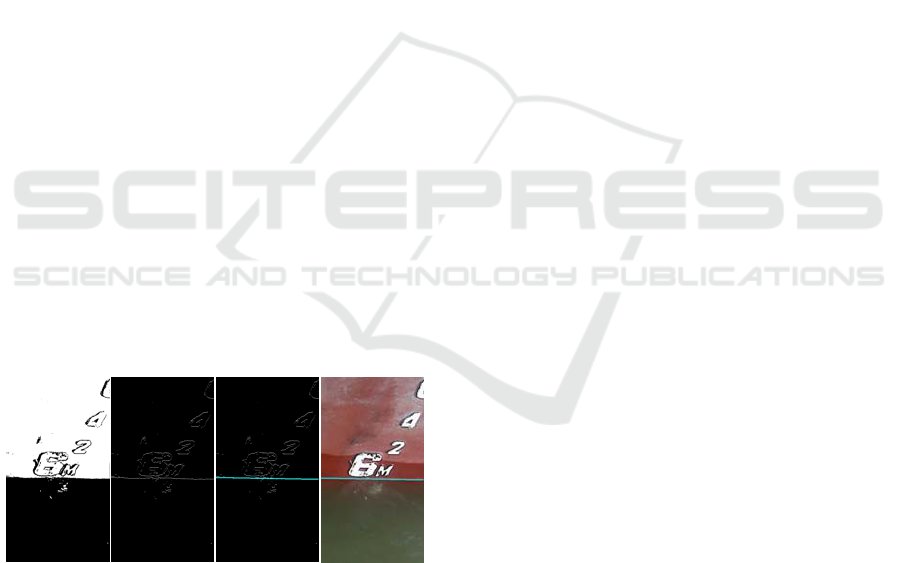
As shown in Fig.7 (a), in the segmented result
obtained from R
component, the hull and the water
surface show an obvious margin, while the fake
waterline formed by wave infiltration on the hull
does not leave evident traces. Such effect is mainly
due to the little impact generated by the infiltration
itself in the image of R
component. Meanwhile, the
valley between the two peaks on the histogram is
taken as the threshold for segmentation, which also
helps eliminate the influences caused by the small
difference in the gray values of the adjacent pixels
inside the target or background. In addition, to
improve the adaptability of the image segmentation
algorithm, the histograms of different color
components can be compared other than the
histograms of RGB
components.
Figure 7: Identified results of the draft line based on color
image segmentation, (a) binary image obtained from R
component, (b) pixels on the edges, (c) the detected draft
line, and (d) mapping of the draft line in the original
image.
The edge pixels in the image are extracted as
shown in Fig.7 (b). The details show that although
the edge features between the hull and the water
surface can be obtained by the above method, the
pixels at the edges usually do not fully characterize
the edge, especially if the draft line stretches over
the draft character. For the edge fractures due to
noises and uneven lighting, as well as the other
effects of introducing grayscale discontinuities,
Hough transform is usually used to assemble the
edge pixels into meaningful continuous segments.
The basic strategy is as follows: A set of straight
lines that pass a specific point in the image are
converted to a curve under polar coordinates, the
peaks of the curve intersections under polar
coordinates are counted in an accumulator, and then
the peak corresponds to a straight line with many
collinear points in the image (Yan and Yang, 2015).
For the identification of the draft line, given that
adjusting the climbing robot’s location and arm can
provide a better shooting angle for the HD camera,
the location of the draft line is limited within the
lower half of the image, and the angle of the draft
line is limited to ±15°. This not only facilitates
reducing the interference in the image, but also
accelerates the processing speed of Hough transform,
as shown in Fig.7 (c). Finally, the resulting line can
be remapped to the corresponding location in the
original image as the draft line, as shown in Fig.7 (d).
3.2 Calculation of Draft Value
After numerical representation of the draft and
locating of the draft line, the draft value can be
obtained immediately by comparing the relative
location of the two, but one of the details will make
a difference in the identification accuracy. Since
there is an angle between the camera and the draft,
the distances may differ between the numerically
represented draft characters. Hence, it is necessary to
determine the variation pattern through the fitting
approach, and thus the depth value represented by
the distance between the draft line and the last
character. Considering that Hough transform is used
in identifying the draft line, and that the draft line is
located by many edge pixels, a locating accuracy at
sub-pixel level could be achieved theoretically.
Accordingly, the calculation accuracy of the draft
value reaches 1mm, significantly higher than the
5mm achieved by manual reading.
4 CONCLUSIONS
Draft survey based on digital image acquisition and
processing is an innovative approach that uses
pioneering technologies to overcome the inherent
(a) (b) (c) (d)
ICECTT 2018 - 3rd International Conference on Electromechanical Control Technology and Transportation
646

disadvantages of conventional manual reading. The
climbing robot that carries the camera to capture
images makes it possible to obtain the close-up
images of the draft. The robot can climb along the
hull under the control of a tablet, and continuously
captures several HD images when approaching the
draft. The identification algorithm based on neural
network and color image segmentation ensures the
accurate identification of the draft, with a calculation
accuracy of 1mm for draft values in the image. In
particular, by combining several draft images, the
calculated results could effectively reduce the
impacts of wave undulation. Moreover, the entire
measurement process could be recorded in the
database, guaranteeing later inspection of the
measurements and thus avoiding the possible trade-
related disputes.
REFERENCES
Liu, C.L., Zhang, X.F., Sun, X.F. and Yin, Y., 2014.
Improved draft survey method based on densified
table of offsets. Journal of Traffic and Transportation
Engineering, 14(3): pp.58-64.
Li, H.X., Bao, Y.F. and Xu, Z. Y., 2012. The research on
the risk evaluation and management system for draft
survey. Journal of Inspection and Quarantine, 22(4):
pp.4-7.
Said, K.A.M., Jambek, A.B. and Sulaiman, N., 2016. A
study of image processing using morphological
opening and closing processes. International Journal of
Control Theory & Applications, 9(31): pp.15-21.
Liu, L.L., 2017. Research on image segmentation
technology for a license plate recognition. Bulletin of
Science and Technology, 33(4): pp.125-129.
Ran, X. and Peng, J.H., 2012. Ship draft mark recognition
based on Image Processing. Journal of Shanghai
Maritime University, 33(2): pp.6-9.
Kim, I.J. and Xie, X.H., 2015. Handwritten Hangul
recognition using deep convolutional neural networks.
International Journal on Document Analysis and
Recognition, 8(1): pp.1-13.
Yu, J.D. and Zhang, X.M., 2015. Edge detection algorithm
for lines on microscopic image. Optics and Precision
Engineering, 23(1): pp.271-281.
Peng, H.,Zhou, X.Z. and Lei, Y.J., 2017. Color image
segmentation based on prior color covariance
constraint. Computer Engineering, 43(4): pp.251-256.
Yan, H.R. and Yang, M.S., 2015. Line extraction based on
improved Hough transform. Infrared Technology,
37(11): pp.970-975.
Draft Survey Based on Image Processing
647
