
The Impact of Proprietary Costs, Agency Costs, and Financing
Incentives on Segment Profit Growth Variations
Iswajuni,Yadi Arudistara
1
Faculty of Economics and Business, Universitas Airlangga, Surabaya, Indonesia
yuyun_iswahyuni@yahoo.com
Keywords: Agency Costs, Differences in Earning Growth Segment, Financing Incentives, Proprietary Costs.
Abstract: This study aims to determine the effects of proprietary costs, agency costs, and financing incentives on the
differences in segment earnings growth in state-owned enterprises listed on the Indonesia Stock Exchange for
the period 2009–2015. The data sources consisted of financial statements, annual reports, and sustainability
reports. The study used a quantitative research method. Data were analyzed using multiple regression analysis.
The research shows that the three variables of proprietary costs, agency costs, and financing incentives show
a significant effect on segment profit growth variations.
1 INTRODUCTION
The globalization era has brought about changes to
the world’s economy. The disappearance of inter-
state boundaries and the introduction of free trade
agreements have opened up business opportunities
for the improvement of countries’ economies. The
disappearance of boundaries for the inter-state
economy has provided companies with the
opportunity to attract external parties, especially
investors. One important element in attracting
investors is accurate information about a company,
especially regarding its performance, predictions for
future cash flow and earnings, and risks that may
occur in the future, one of which can be obtained from
the company's financial statements (Muhammad &
Siregar, 2012). This is because financial statement
users want transparency of information to be provided
by companies in order to assess their future prospects
and risks.
One important indication of information for
investors is segment reporting, alongside income and
cash flow statements (Brown, 1997). The reported
company segment must exceed at least 10% of the
total revenue of all segments or otherwise meet the
requirement, the segment may be loaded, with
management's consideration that the information is
useful to external parties (Bestari & Siregar, 2012).
Segment information helps external users to analyze
better the performance of each segment within a
company. The decision to disclose segment
information by increasing or limiting it is under the
control of the manager. Factors that may affect the
quality of the disclosures from these segments will be
analyzed in this study.
Segment reporting consists of information
between segments that results in profitability. The
operating segment is one of the segments reported by
a company; this segment has a large number of
products, services, and areas of market operations that
provide information on growth trends, diversity of
operating areas, etc. (Dermawan et al., 2016).
Reporting on this segment will increase transparency
and provide more reliable information for the users of
financial statements to make decisions. This is
because the users of financial statements need not
only the overall financial statements but also more
detailed information on the reports from different
business segments of the company.
Managers consider whether the information can
lead to competitors changing their strategies, or even
attract the attention of major business competitors.
Such factors may reduce information on variations in
profitability between segments (Blanco et al., 2015).
This research aims to understand the factors that
affect the variations in segment profit growth, which
consist of proprietary costs, agency costs, and
financing incentives as independent variables. The
study was conducted in the period 2009–2015, taking
into account the effects of the application of
regulations related to the operating segment in
Indonesia, specifically PSAK No. 5 (revised 2009), to
assess companies’ disclosure of information relating
224
Iswajuni, . and Arudistara, Y.
The Impact of Proprietary Costs, Agency Costs, and Financing Incentives on Segment Profit Growth Variations.
In Proceedings of the Journal of Contemporar y Accounting and Economics Symposium 2018 on Special Session for Indonesian Study (JCAE 2018) - Contemporary Accounting Studies in
Indonesia, pages 224-229
ISBN: 978-989-758-339-1
Copyright © 2018 by SCITEPRESS – Science and Technology Publications, Lda. All rights reserved
to variations in profit growth over that year. PSAK 5
(revised 2009) came into effect in 2011 and adopted
the regulations of IFRS 8, which are related to
segment reporting. This PSAK supersedes the old
regulation of PSAK 5 (revised 2000). Disclosure of
segments based on regulation provides more
informative for financial statement users who need to
make investment decisions. However, the decision to
provide information on variations in profit growth
between segments does not necessarily depend on the
implementation of PSAK 5 (revised 2009). The
existence of standards disclosure for the regulation of
these segments is expected to improve the quality of
a firm’s segment information.
2 LITERATURE REVIEW
2.1 Proprietary Costs
According to a previous study (Wang et al., 2011),
proprietary costs associated with the variation in
profit growth between segments have had a
significant affect. In relation to proprietary costs,
which correlate with the level of business
competition, a company will tend to hide information
on the variation in profit growth between segments so
that this cannot be used by competitors, thus leading
to losses for the company. The following hypothesis
is formulated for this study:
H1: Proprietary costs have a significant effect on the
variation in profit growth between segments.
2.2 Agency Costs
The same study (Wang et al., 2011) mentions that
there is a significant relationship between agency
costs and variation in profit growth between
segments. Managers will always prioritize their own
interests to achieve a good performance assessment
by shareholders. Managers will cover the varied
segment of the segment's poor profit growth. In
relation to the high costs associated with the agent,
the manager will attempt to manipulate the profit
growth between segments in order to produce
information on the variation in the form of inaccurate
earnings growth. In this study, the second hypothesis
is formulated as follows:
H2: Agency costs significantly influence the variation
in profit growth between segments.
2.3 Financing Incentives
In the previous study (Wang et al., 2011), financing
incentives as associated with profit growth between
segments is reported to indicate a positive
relationship. This is because companies that have a
high dependence on external financing will attempt to
reveal a good variation in profit growth between
segments to eliminate information asymmetry with
creditors. In this study, the third hypothesis is
formulated as follows:
H3: Financing incentives have a significant influence
on the variation in profit growth between segments.
3 RESEARCH METHODOLOGY
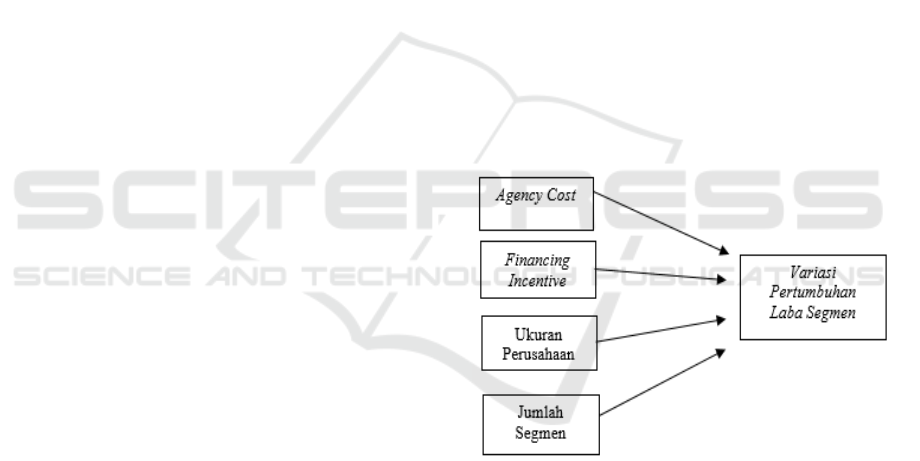
3.1 Conceptual Framework
Based on the background, problem statement, and
development of the hypotheses, the variables can be
formulated through a conceptual framework, as
shown in Figure 3.1.
Figure 1: Conceptual Framework
3.2 Operational Definition and Variable
Measurement
3.2.1Variation in Segment Profit Growth
Variation in segment profit growth is an operating
profit alteration, taken from the current operating
profit minus the previous year's operating profit,
scaled by the previous year's operating profit (Wang
et al., 2011). The growth of a company's segment
profit is a reflection of its performance.
The Impact of Proprietary Costs, Agency Costs, and Financing Incentives on Segment Profit Growth Variations
225

Description :
LO : operating profit, current year
: operating profit, previous year
3.2.2 Proprietary Costs
Proprietary costs consist of competitive disadvantage
costs and political costs. The cost of competitive
disadvantage is the cost that causes the company's
competitiveness to weaken as a result of the
disclosure of information through the published
financial statements utilized by business competitors.
Political costs are the costs incurred by the emergence
of new regulations from the government due to the
disclosure of information in the financial statements
(Murdoko Sudarmadji & Sularto, 2007).
The chosen method for this study is the
Herfindahl index.
Description :
: quadratic of sales value
: quadratic of total sales of firm
3.2.3 Agency Costs
The agency costs consist of monitoring costs,
bonding costs, and residual loss. Monitoring costs are
the costs borne by the shareholders in supervising and
controlling agent behavior. Bonding costs are the
costs borne by the manager in order to comply with
the mechanism in order to provide assurance of
serving the interests of shareholders. Residual loss is
a sacrifice that decreases shareholder wealth as a
result of agency problems (Destriana, 2011). The
measurement method used for agency costs is free
cash flow, which by searching operating net cash flow
is then less by cash dividend and capital expenditure,
then scaled with the company's total assets (Wang et
al., 2011).
Description :
ONCF : operating net cash flow
CD : cash dividend
CE : capital expenditure
TA : total asset
3.2.4 Financing Incentives
Financing incentives are the bonus obtained from
external financing as the company's efforts reveal
variations in profit growth between segments as a
benchmark of company performance. The calculation
of financing incentives uses a measurement of
external financing calculated using the sum of
external equity financing and debt financing divided
by the total assets.
Description :
EEF : external equity financing
DF : debt financing
TA : total asset
3.3 Research Model
This study used a quantitative research method, with
four independent variables as variable X
(independent variables) and variable Y (dependent
variable). The independent variables consist of
proprietary costs, agency costs, and financing
incentives. The dependent variable is the variation of
profit growth between segments.
To test the proposed hypotheses, this study used a
multiple linear regression equation, as follows:
Y= + β1 PC+β2 AC+ β3 FI+e
Y = variation in profit growth between
segments
= constant
β1 – β4 = coefficient regression
PC = proprietary costs
AC = agency costs
FI = financing incentive
e = error
3.4 Data
The study used secondary quantitative data
obtained from the Indonesia Stock Exchange, and
partly from www.idx.com, consisting of the annual
reports and financial reports of companies in the
JCAE Symposium 2018 – Journal of Contemporary Accounting and Economics Symposium 2018 on Special Session for Indonesian Study
226

category of state-owned enterprises for the period
2009–2015.
The data collection procedure for this research
used the purposive sampling technique. The total
number of samples obtained for this research was
105. Here is a list of State-Owned Enterprises
(BUMN) included in the sample of 105 for the period
2009–2015.
4 RESULTS AND DISCUSSION
4.1 Results
In this study, multiple linear regression analysis was
conducted to determine the effect of the independent
variables, consisting of proprietary costs (HHI),
agency costs (FCF), and financing incentives, on the
dependent variable of earnings growth (EGRWAR),
with control variables in the form of company size
(LNAT) and number of segments (NSEG) for the
period 2009–2015. The results of the multiple linear
regression are presented in Table 1.
Table 1: Regression Result
Notes:
* = significant at the rate of 1% (0.01)
** = significant at the rate of 5% (0.05)
*** = significant at the rate of 10% (0.10)
Based on Table 3.1, the results obtained from the
multiple linear regression are as follows:
Y= 1.830 + 0.428 HHI +0.97 FCF + 0.020 FI –
0.085 LNAT + 0.107 NSEG + e
The results of the hypothesis test show that the
value of constant α is equal to 1.830. This is a positive
value, which means that the independent variables of
proprietary costs, agency costs, and financing
incentives affect the large variation in segment profit
growth.
The results of the hypothesis test show that the
regression value of proprietary costs is 0.482. This
value indicates that, if the variable of proprietary
costs increases by one unit, this will increase the
variation in segment profit growth.
The results of the hypothesis test show that the
regression value of agency costs is 0.987. This value
indicates that, if the variable of agency costs increases
by one unit, this will increase the variation in segment
profit growth.
The results of the hypothesis test show that the
regression value of financing incentives is 0.020. This
value indicates that, if the variable of financing
incentives increases by one unit, this will increase the
variation in segment profit growth.
The regression coefficient value of the firm
size hypothesis test shows a value of -0.085. This
value indicates that a decrease of one unit in the
control variable of firm size will increase the
variation in segment profit growth.
The regression coefficient value of the number
of segments shows a value of 0.107. This value
indicates that an increase of one unit in the control
variable of the number of segments will increase the
variation in segment profit growth
4.2 Discussion
The first hypothesis, which states that proprietary
costs affect the variation in segment profit growth, is
accepted. The results of this study indicate that
proprietary costs have a significant positive effect on
the variation in profit growth between segments, as
evidenced by the Herfindahl index. This shows that
the environment and level of business competition in
BUMN companies does not affect the decision of
managers to provide information on profit growth
between segments. This is because BUMN
companies are not only profit-seeking but also
providers of public goods and services, as well as
drivers of the national economy. BUMN companies
also control the oligopoly market structure. An
oligopoly is a market that offers one type of product
that is controlled by several companies. BUMN
companies also have diversified products in their
segment of operations and are not dependent on only
one product. This condition results in the relatively
Model
Unstandardized
Coeffficient
Stand.
Coef.
T
Sig.
B
Stat.
Error.
Beta
(Const.)
1.830
1.339
1.367
0.175
HHI
0.482
0.286
0.220
1.681
0.096***
FCF
0.987
0.481
0.215
2.055
0.043**
Financing_
Ins
0.020
0.006
0.333
3.149
0.002*
LNAT
-
0.085
0.045
-
0.204
-
1.867
0.065***
NSEG
0.107
0.060
0.235
1.779
0.079***
The Impact of Proprietary Costs, Agency Costs, and Financing Incentives on Segment Profit Growth Variations
227

low proprietary costs, resulting in high variation in
the growth of information. In contrast to companies
that concentrate on only one type of product, making
high proprietary cost so that the company will limit
the information of variation of segment profit. The
reason for this is that, for companies that rely on one
type of product, the level of business competition is
particularly influential for their continuity.
The second hypothesis, which states that
agency costs affect the variation in segment profit
growth, is accepted. The results of this study indicate
that agency costs have a significant positive effect on
the variation in profit growth between segments.
Agency costs calculated using free cash flow show
significant results. This shows that the motive of
agency costs can describe the motives of managers in
providing information on the variation in profit
growth between segments. This condition can occur
because managers in BUMN companies are directly
responsible to the government as a shareholder, and
such companies have a management and supervision
system based on the principles of good corporate
governance. The position of shareholders in BUMN
companies has also been represented by the
management of the company with the existence of the
cost agency that has been issued and the dominant
poetic content so that the policy manager can be
controlled easily according to the requirements of the
shareholders (government).
The third hypothesis, which states that financing
incentives affect the variation in segment profit
growth, is accepted. The results of this study indicate
that financing incentives have a significant positive
effect on the variation in profit growth between
segments. This is because BUMN companies in
Indonesia receive more capital from outside, such as
funding the majority of the government so that when
external capital financing increases, so too does
information on profit growth between segments. The
information is the responsibility of BUMN
companies to the government, and also acts as an
appraisal of the companies’ performance to secure
government funding. The results of this study are
similar to the research by Wang et al. (2011), which
also indicates that financing incentives have a
significant positive effect on the variation in profit
growth between segments.
Simultaneously, the independent variables of
proprietary costs, agency costs, and financing
incentives have a significant positive effect on the tax
compliance variable. This is because these three
independent variables interact and become
determinants of managers’ decisions to provide
information on the variation in segment profit growth.
5 CONCLUSIONS
Based on the analysis that has been carried out, the
following conclusions can be drawn:
1. Proprietary cost proxies in the Herfindahl index
have a significant positive effect on the variation in
profit growth between segments.
2. Agency cost proxies by free cash flow also show a
significant positive effect on the variation in profit
growth between segments.
3. Financing incentives proxies based on external
financing show a significant positive effect on the
variation in profit growth between segments.
REFERENCES
AUP. (2009). Pedoman Penulisan Pembimbingan dan
Ujian Skripsi. Surabaya: AUP Universitas Airlangga.
Bestari, M., & Siregar, S. V. (2012). DETERMINAN
MOTIF PENGUNGKAPAN VARIASI
PERTUMBUHAN LABA ANTAR SEGMEN
PERUSAHAAN MANUFAKTUR YANG
TERDAFTAR DI INDONESIA. Universitas
Indonesia. Blanco, B., Lara, G., Juan, M., &Tribo, J.
A. (2015). Segment disclosure and cost of capital.
Journal of Business Finance & Accounting, 42(3-4),
367-411.
Blanco, B., Lara, J. M. G., & Tribó, J. (2014). The relation
between segment disclosure and earnings quality.
Journal of Accounting and Public Policy, 33(5), 449-
469.
Brown, P. (1997). Financial data and decision making by
sell-side analysts. The Journal of Financial Statement
Analysis, 2(3), 43-48.
Chen, P., & Zhang, G. (2001). Heterogeneous Investment
Opportunities and the Value Relevance of Segment
Accounting Data. Paper presented at the 2001 Summer
Symposium at Hong Kong University of Science and
Technology, Hong Kong.
Destriana, N. (2011). Masalah dan Biaya Keagenan.
Media Bisnis, 3(1), 8-16.
Jensen, M. C., & Meckling, W. H. (1976). Theory of the
firm: Managerial behavior, agency costs and
ownership structure. Journal of financial economics,
3(4), 305-360.
Lewellen, K. (2006). Financing decisions when managers
are risk averse. Journal of Financial Economics,
82(3), 551-589.
Muhammad, F., & Siregar, S. V. (2012). ANALISIS
TINGKAT PENGUNGKAPAN SEGMEN:
FAKTOR-FAKTOR.
Sembiring, E. R. (2005). Karakteristik Perusahaan dan
Pengungkapan Tanggung Jawab Sosial pada
Perusahaan yang Tercatat di Bursa Efek Jakarta.
Simposium Nasional Akuntansi, 7, 15-16.
JCAE Symposium 2018 – Journal of Contemporary Accounting and Economics Symposium 2018 on Special Session for Indonesian Study
228

Soetedjo, S. (2009). Pembahasan Pokok-pokok Pikiran
Teori Akuntansi Vernon Kam: Surabaya: Airlangga
University Press.
Wang, Q., Ettredge, M., Huang, Y., & Sun, L. (2011).
Strategic revelation of differences in segment earnings
growth. Journal of Accounting and Public Policy,
30(4), 383-392.
The Impact of Proprietary Costs, Agency Costs, and Financing Incentives on Segment Profit Growth Variations
229
