
A Benchmark for the Short Version of the User Experience Questionnaire
Andreas Hinderks
1
, Martin Schrepp
2
and J
¨
org Thomaschewski
3
1
ETS Ingenier
´
ıa Inform
´
atica, Universidad de Sevilla, Spain
2
SAP SE, Germany
3
Universitiy of Applied Sciences Emden/Leer, Germany
Keywords:
User Experience Questionnaire Short, UEQ-S, Benchmark.
Abstract:
To enable an interactive product to provide adequate user experience (UX), it is important to ensure the quanti-
tative measurability of this parameter. The User Experience Questionnaire (UEQ) is a well-known and popular
method for such a UX measurement. One of the key features of this questionnaire is a benchmark that helps to
interpret measurement results by a comparison with a large dataset of results obtained for other products. For
situations where filling out the entire UEQ is too time-consuming, there is a short version (UEQ-S). However,
there is currently no sufficient data available to construct an independent and interpretable benchmark for this
short version. This paper examines the efficiency of using a modified version of the existing benchmark of the
full UEQ for this purpose. The paper also presents some additional evaluation results concerning the UEQ-S.
1 INTRODUCTION
Providing a high or at least adequate user experience
for a product is indispensable for success in todays
highly competitive market environments. Modern de-
vices, like smartphones or tablets, with their quite in-
tuitive and easy-to-use interfaces, have raised the ge-
neral expectation of users concerning the quality of
user interfaces drastically in the last couple of years.
Todays users place high expectations on user interfa-
ces in their products (Hassenzahl, 2003).
This is not only true for the classical usability as-
pects, such as efficiency of the interaction, ease of le-
arning or the ability to control the interaction. In ad-
dition, hedonic and non-task-related quality aspects,
for example visual appeal of the user interface, fun
of use or originality or novelty of the design, play
an important role (Preece et al., 2015). This is not
only true for products intended for leisure activities,
but also for products like business software or pro-
gramming tools, that are used professionally (Schrepp
et al., 2006).
Deciding on the adequacy of the user experience
of any given interface requires that this parameter be
measurable. Based on such measurements we can
then draw conclusions, for example that the user ex-
perience is sufficiently high to launch the product or
that an investment into improvements of the user ex-
perience is required in order to be competitive on the
market (Schrepp et al., 2014).
User experience is a quite subjective matter (Boy,
2017). If several users are asked their opinion about
the user experience of the same product, their impres-
sions may differ widely. This can be due to the fact
that they use the product in different ways, i.e. try
to reach different goals and thus work with different
parts of the user interface of a product. Another cause
of divergent opinions can be differences in age or gen-
der. But even quite individual aspects, for example
the familiarity with products similar to the evaluated
product, can massively influence the impressions con-
cerning the UX of a product.
Because of these differences in the opinion of dif-
ferent users, it is very important to collect data from
larger groups of users. Questionnaires are a simple
and cost-effective method to collect user feedback
(Schrepp et al., 2014), since they can be distributed
rather efficiently to larger groups of users, especially
if they are designed as online questionnaires. In ad-
dition, analysing the data from such questionnaires is
highly standardised and thus efficient as well.
However, the success of this method to collect
user feedback also has its drawbacks. Nowadays, we
are all flooded with all kinds of questionnaires. This
naturally reduces the willingness to take part in such a
study, especially if answering the questionnaire requi-
res too much time (Batinic et al., 2002). In addition,
there are several cases in which the time a participant
Hinderks, A., Schrepp, M. and Thomaschewski, J.
A Benchmark for the Short Version of the User Experience Questionnaire.
DOI: 10.5220/0007188303730377
In Proceedings of the 14th International Conference on Web Information Systems and Technologies (WEBIST 2018), pages 373-377
ISBN: 978-989-758-324-7
Copyright © 2018 by SCITEPRESS – Science and Technology Publications, Lda. All rights reserved
373
is able or willing to spend on answering questions for
a UX evaluation is quite limited. Therefore, it is im-
portant in many cases to use questionnaires that con-
tain only a few items and can be answered extremely
fast, for example, in less than a minute.
The User Experience Questionnaire (UEQ)
(Laugwitz et al., 2008) is an established and fre-
quently used questionnaire for the evaluation of
the UX of interactive products. The questionnaire
consists of 26 items and requires 3-5 minutes to fill
it out. For special circumstances, a short version
UEQ-S (Schrepp et al., 2017b) was developed which
contains only 8 items.
This paper illustrates some evaluation methods for
the short version and a method to make the UEQ
benchmark usable for this short version UEQ-S. In
section 2, we present the structure of the UEQ and the
adapted version UEQ-S. In section 3 a further evalua-
tion of the UEQ-S is presented. Section 4 describes an
adaption of the UEQ benchmark to the short version.
We conclude our article with a conclusion in section
5.
2 STRUCTURE OF THE UEQ
AND THE UEQ-S
The UEQ (Laugwitz et al., 2008) is a frequently used
questionnaire to measure the subjective user expe-
rience of interactive products. Each item of the UEQ
consists of a pair of antonyms, for example:
Figure 1: User Experience Questionnaire - Item example.
Participants can rate each item on a 7-point Likert
scale. The answers are scaled from -3 (fully agree
with negative term) to +3 (fully agree with positive
term). Half of the items start with the positive term,
the others with the negative term (in randomized or-
der).
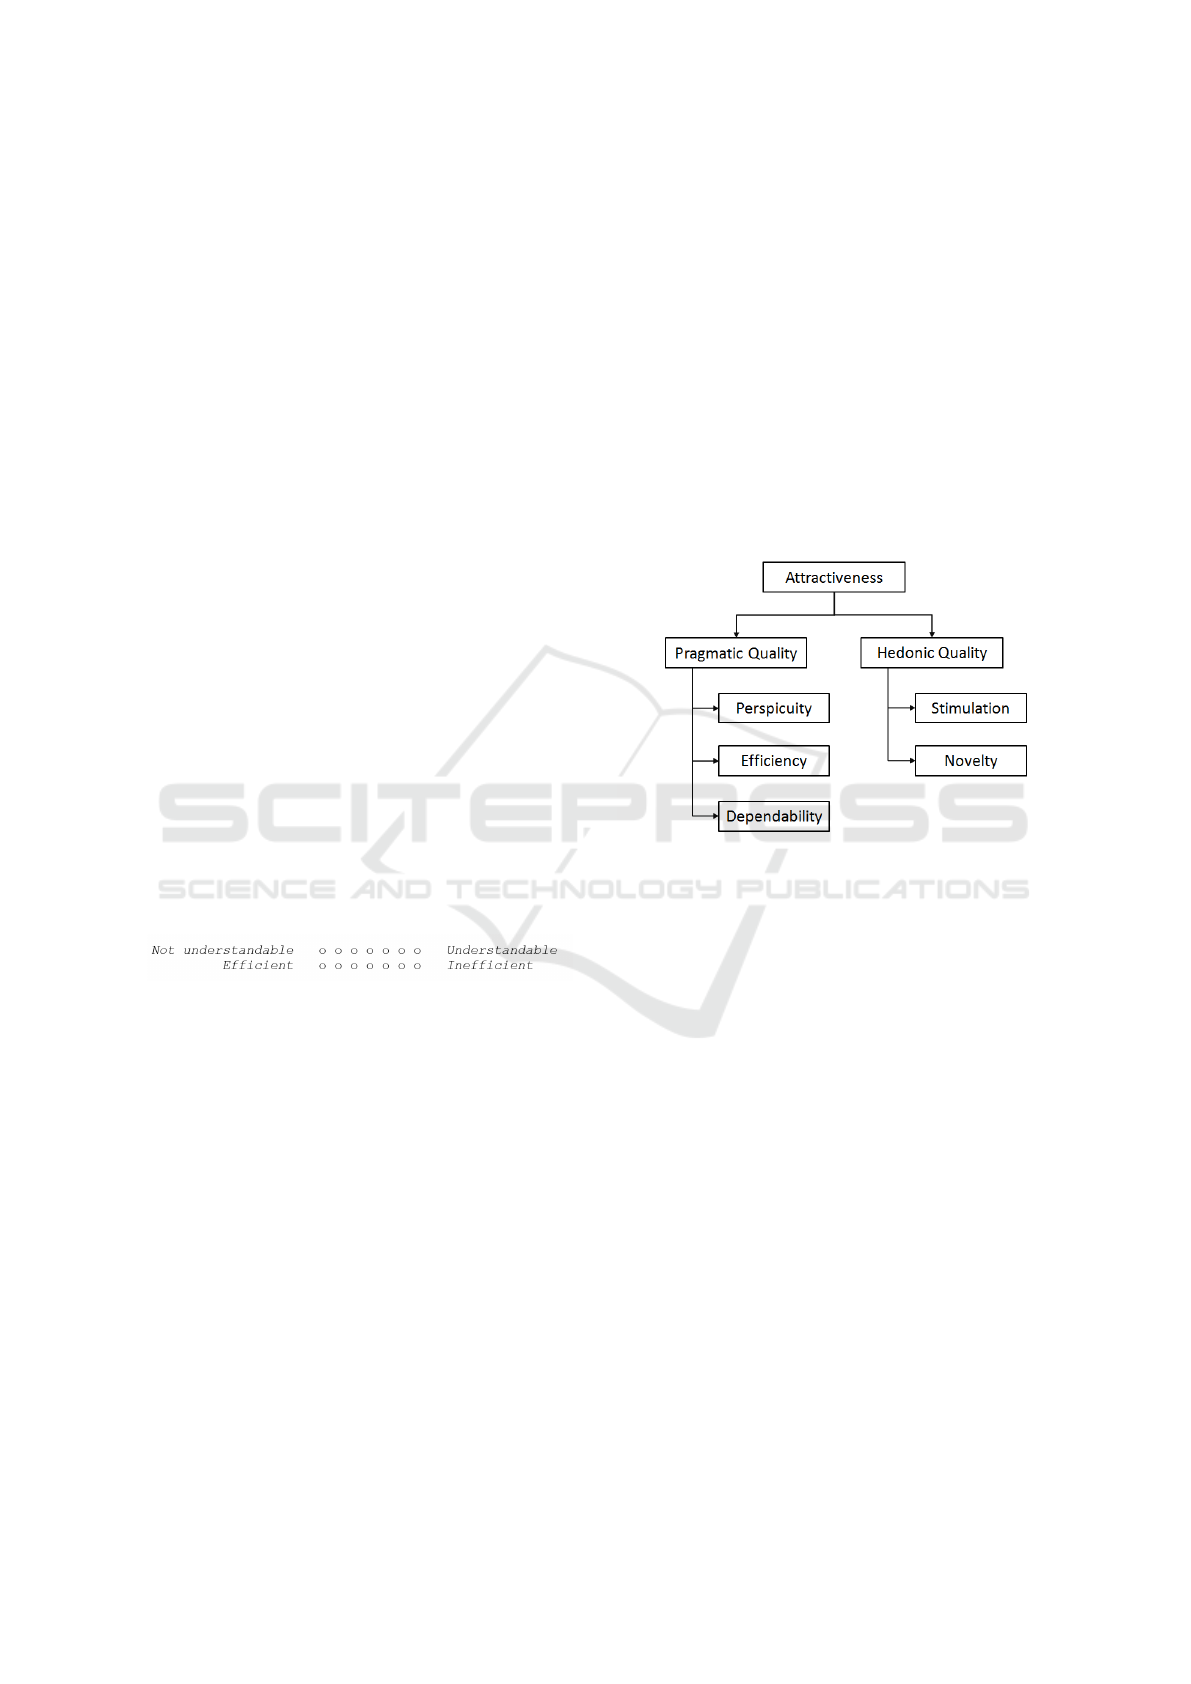
The 26 items are grouped into 6 scales:
• Attractiveness: Describes the overall impression
of the product. Do users like or dislike it? Is it
attractive, enjoyable or pleasing?
• Perspicuity: Describes how easy it is to get fa-
miliar with the product Is it easy to learn? Is the
product easy to understand and unambiguous?
• Efficiency: Can users solve their tasks without un-
necessary effort? Is the interaction efficient and
fast? Does the product react quickly to user in-
put?
• Dependability: Does the user feel in control of the
interaction? Can he or she predict the systems be-
haviour? Does the user feel confident when wor-
king with the product?
• Stimulation: Is it exciting and motivating to use
the product? Is it enjoyable to use?
• Novelty: Is the product innovative and creative?
Does it capture the users attention?
Attractiveness is a pure valence dimension. Per-
spicuity, Efficiency, and Dependability are task or
goal related (pragmatic) quality aspects. Stimulation
and Novelty are hedonic quality aspects, i.e. they re-
late to pleasure or fun while using the product, see
(Schrepp et al., 2006) and (Schrepp et al., 2017a).
Figure 2: Adopted scale structure of the User Experience
Questionnaire (UEQ).
Details concerning the structure and evaluation of
the UEQ can be found in (Laugwitz et al., 2008). The
UEQ in all available languages (there are currently 20
languages available), an Excel sheet for data analysis,
and the UEQ Handbook are available free of charge
at www.ueq-online.org.
Filling out the UEQ does not require too much
time (usually 3-5 minutes are sufficient). However,
there are some special application scenarios that re-
quire an even shorter questionnaire. The list below is
based on our practical experience in conducting the
UEQ. These scenarios are examples to understand the
need for a shorter version of the UEQ.
1. Data is often collected when a user leaves an ap-
plication, for example, a web shop. If the questi-
onnaire contains too many items, then users might
refuse to give feedback (they have finished their
tasks and are in the process of leaving, so motiva-
ting them to spend some more time on feedback
is difficult).
2. Some questions concerning UX are to be included
in an already existing product experience questi-
onnaire. Such questionnaires are sent out after a
APMDWE 2018 - 3rd International Special Session on Advanced practices in Model-Driven Web Engineering
374

customer has purchased a product and has alre-
ady used it for some time. The questionnaires try
to collect data about the entire product experience
and are thus often quite lengthy. It is therefore
difficult to add a full 26 item user experience que-
stionnaire in such cases.
3. Sometimes participants of a study must judge the
user experience of several products in one ses-
sion. Products are presented to the participant in a
random order one after the other and participants
must fill out a UX questionnaire for each of them.
In such a setting, the number of items must be kept
to a minimum, since otherwise the quality of ans-
wers will decrease quickly.
A short version of the UEQ, called UEQ-S, was
designed to address such scenarios. This short ver-
sion only measures the two meta-dimensions pragma-
tic and hedonic quality, each with 4 items. Thus, the
UEQ-S consists of only eight items grouped into two
scales. In addition, the mean value of the eight items
is used as an overall UX value.
The structure of the short version relies on a data-
analytical approach. A data set with 1867 rows of
the German UEQ was collected. Each row reflects
the evaluation of a product with the UEQ by a parti-
cipant. In total, 21 different products were evaluated
(business software, web shops, household appliances,
etc.). From this data set, the 8 items that best repre-
sented the two meta-dimensions were isolated by a
main component analysis (varimax rotation). The re-
sult of the selected items and their respective loadings
on the two meta-dimensions are shown in Table 1.
Details of the design process and results can be found
in (Schrepp et al., 2017b).
Table 1: Loadings of the items of the short version UEQ-S
on the factors pragmatic and hedonic quality
Item Pragmatic Hedonic
clear / confusing 0.71 0.21
inefficient / efficient 0.63 0.39
complicated / easy 0.79 0.10
obstructive / supportive 0.69 0.41
boring / exiting 0.29 0.74
not interesting / interesting 0.36 0.75
conventional / inventive 0.19 0.82
usual / leading edge 0.19 0.86
Thus, the items show the intended scale structure.
Only the item obstructive/supportive yields a relevant,
but still relatively small cross-loading to the other fac-
tor. The other items load strongly on the factor they
belong to and only weakly on other factors. This
could also be confirmed in a first evaluation study that
compared evaluations of the full UEQ with evaluation
with the UEQ-S (Schrepp et al., 2017b).
In addition, it was shown with some smaller data
sets that the scales of the short version (UEQ-S) ap-
proximate the corresponding scales of the full version
(UEQ) reasonably well. The next section presents a
study that replicates these results for the German, En-
glish and Spanish language version with larger target
groups.
3 FURTHER EVALUATIONS OF
THE UEQ-S
In order to get a better understanding of the relation of
the UEQ-S and the full UEQ, a study was set up that
measures the user experience of Amazon and Skype
with German, Spanish and English users. The two
products Amazon and Skype were selected for the
study, since they are widely-known products which
are quite popular in all three countries. In addition,
both products show, with the exception of a transla-
tion of the terms on the user interface, no difference
in these countries, i.e. the user interface is quite simi-
lar in all three countries.
3.1 Setup of the Study
The data for the study were collected in England,
Spain and Germany with Online (England, Germany)
and a pen-and-paper version (Spain) of the UEQ. In
Spain the data were collected at the University of Se-
ville while a lecture. The English and German parti-
cipants were recruited over a social platform (Prolific
Academic).
Participants could choose if they wished to eva-
luate Amazon or Skype. After this decision, they
received a short standard instruction concerning the
UEQ and then filled out the questionnaire. Finally,
the participants were asked to state their age and gen-
der. Each participant evaluated only one product. For
the Spanish data set, age and gender were not recor-
ded.
3.2 Participants
In England, 238 participants evaluated Amazon, and
215 Skype (330 females, 178 males, average age 34
years). In Germany, 144 participants chose to evalu-
ate Amazon and 85 Skype (92 females, 154 males,
average age 29). All participants were native spea-
kers and had sufficient experience with Amazon and
Skype. For Spain, 51 evaluations of Amazon and 62
A Benchmark for the Short Version of the User Experience Questionnaire
375

evaluations of Skype could be collected. It is diffi-
cult and costly to recruit practitioners from compa-
nies (Escalona et al., 2016), so we decided to choose
studends of the university. All Spanish participants
were students at the University of Seville and in the
Master’s program and in the third level of the grade in
computer science.
3.3 Results
The items of the UEQ-S are a subset of the items of
the UEQ. The goal was to investigate if the short ver-
sion of the UEQ can be used to predict the results of
the meta-dimensions of the full UEQ. Thus, the mean
values for all 12 UEQ items belonging to the dimen-
sions Efficiency, Perspicuity and Dependability was
calculated to get a value PQ(UEQ) and the mean value
of the 8 Items belonging to Stimulation and Novelty
to get a value HQ(UEQ). The mean value of all 26
items of the UEQ is denoted as OV(UEQ). These va-
lues are then compared with the values of the 4 prag-
matic items of the UEQ-S (denoted as PQ(UEQ-S),
the 4 hedonic items of the UEQ-S (HQ(UEQ-S) and
all 8 items of the UEQ-S (OV(UEQ-S).
Table 2 shows these data (the numbers in brackets
are the standard deviations).
As we can see from the results, the values obtained
for the meta-dimensions pragmatic quality and hedo-
nic quality obtained from all items of the full version
and just the items from the UEQ-S are quite close.
This confirms results already described in (Schrepp
et al., 2017b) with bigger data sets.
4 ADAPTION OF THE
BENCHMARK TO THE SHORT
VERSION
The UEQ contains a benchmark (Schrepp et al.,
2017a) that helps to judge how good or bad an actu-
ally measured product is in comparison to other pro-
ducts. The benchmark contains data from 9905 per-
sons that evaluated 246 different interactive products.
It would therefore be beneficial to be able to somehow
use this benchmark also for the short version UEQ-S.
Many of the data sets contained in the benchmark
are from industry projects. These data are quite often
confidential and thus their authors contributed the me-
asured scale means for the benchmark, but not the raw
data. Therefore, it is currently not possible to synthe-
sise a benchmark containing only the values for the 8
items of the UEQ-S directly from the available ben-
chmark data set.
Given the good approximation of the full UEQ
to the items of the short version UEQ-S, it seems
plausible to simply calculate the benchmark for the
short version based on the benchmark of the full ver-
sion from the available scale means. Thus, the scale
means for Efficiency, Perspicuity and Dependability
were used to calculate a value for Pragmatic Quality
and the scale means for Stimulation and Novelty were
used to calculate a value for Hedonic Quality for each
product evaluation in the existing benchmark. The
Overall value was calculated from all 6 UEQ scale
means, i.e. including Attractiveness.
Since it was already shown that the items of the
short version allow a relative accurate approximation
to the values for the meta-dimensions of the full ver-
sion, the results of this procedure can be used as a rea-
sonable benchmark for the short version, at least until
such time as enough data are available to calculate a
benchmark for the UEQ-S directly.
This procedure yields the following result:
• Excellent (In the range of the 10% best results):
Pragmatic Q. greater than 1.73, Hedonic Q. grea-
ter than 1.55, Overall greater than 1.58.
• Good (10% of the results in the benchmark data
set are better and 75% of the results are worse):
Pragmatic Q. between 1.55 and 1.73, Hedonic Q.
between 1.25 and 1.55, Overall between 1.4 and
1.58.
• Above average (25% of the results in the bench-
mark are better than the result for the evaluated
product, 50% of the results are worse): Pragmatic
Q. between 1.15 and 1.54, Hedonic Q. between
0.88 and 1.24, Overall between 1.02 and 1.39.
• Below average (50% of the results in the bench-
mark are better than the result for the evaluated
product, 25% of the results are worse): Pragmatic
Q. between 0.73 and 1.14, Hedonic Q. between
0.57 and 0.87, Overall between 0.68 and 1.01.
• Bad (In the range of the 25% worst results): Prag-
matic Q. less than 0.73, Hedonic Q. less than 0.57,
Overall less than 0.68.
Figure 3: Benchmark for the UEQ-S. Results for a hypot-
hetical example product.
APMDWE 2018 - 3rd International Special Session on Advanced practices in Model-Driven Web Engineering
376

Table 2: Mean values and standard deviations for the UEQ and UEQ-S.
Pragmatic Quality Hedonic Quality Overall
PQ(UEQ) PQ(UEQ-S) HQ(UEQ) HQ(UEQ-S) OV(UEQ) OV(UEQ-S)
Amazon England 1.50 (1.05) 1.54 (1.04) 0.95 (1.08) 1.008 (1.03) 1.32 (1.11) 1.272 (0.93)
Spain 1.03 (1.05) 0.99 (1.02) 1.03 (1.02) 0.990 (0.99) 1.08 (1.04) 0.98 (0.96)
Germany 1.36 (0.91) 1.550 (0.95) 0.73 (0.98) 0.701 (0.97) 1.17 (1.00) 1.126 (0.85)
Skype England 1.06 (1.13) 1.167 (1.12) 0.50 (1.08) 0.403 (1.04) 0.90 (1.15) 0.787 (0.94)
Spain 0.93 (0.07) 1.118 (0.93) 0.77 (1.05) 0.723 (1.02) 0.94 (1.01) 0.911 (0.84)
Germany 0.77 (1.12) 0.997 (1.24) 0.44 (1.05) 0.412 (1.04) 0.68 (1.12) 0.698 (1.03)
5 CONCLUSIONS
The short version UEQ-S of the UEQ is intended to
be used in cases where filling out a complete 26 item
UEQ is not possible. The UEQ-S was designed ac-
cording to a data analytical approach on the basis of
the full UEQ. Some first evaluation studies showed
that the items of the UEQ-S are a good approxima-
tion of the UEQ results for pragmatic and hedonic
quality in the sense that the 4 items of the UEQ-S
are quite good predictors for the mean values of the
12, respectively 8, items of the full UEQ assigned to
these meta-dimensions.
However, some more data are required to get a
deeper understanding of the relation between full and
short version. In future work, the Spanish data set
must be checked to see if it is generally valid for the
Spanish version of the UEQ, since only students took
part. This paper presents the results of three additio-
nal validation studies for different language versions,
which confirm the scale structure of the UEQ-S and
again a reasonable congruity of short and full version
of the questionnaire.
One of the key features of the UEQ is a large ben-
chmark data set. The benchmark helps to interpret
results obtained with the UEQ by a comparison to the
results of other products in the benchmark. It is not
directly possible to recalculate a benchmark for the
UEQ-S, since only the scale means are available for
many of the data points in the UEQ benchmark, i.e.
the raw data are not available due to data privacy is-
sues. This paper showed that due to the good approx-
imation of the metadimensions pragmatic and hedo-
nic quality of the 8 items of the short version, it is
possible to use a natural transformation of the UEQ
benchmark for the UEQ-S.
REFERENCES
Batinic, B., Reips, U.-D., and Bosnjak, M., editors (2002).
Online social sciences. Hogrefe & Huber Publishers,
Seattle.
Boy, G. A. (2017). The Handbook of Human-Machine Inte-
raction: A Human-Centered Design Approach. CRC
Press, Milton, 1st ed. edition.
Escalona, M. J., Lopez, G., Vegas, S., Garc
´
ıa-Borgo
˜
n
´
on, L.,
Garcia-Garcia, J. A., and Juristo, N. (2016). A soft-
ware engineering experiments to value mde in testing.
learning lessons.
Hassenzahl, M. (2003). The thing and i: Understanding
the relationship between user and product. In Blythe,
M. A., editor, Funology, pages 31–42. Kluwer Acade-
mic Publishers, Boston [etc.].
Laugwitz, B., Held, T., and Schrepp, M. (2008). Con-
struction and evaluation of a user experience question-
naire. In Holzinger, A., editor, HCI and Usability for
Education and Work, volume 5298 of Lecture Notes in
Computer Science, pages 63–76. Springer Berlin Hei-
delberg, Berlin, Heidelberg.
Preece, J., Rogers, Y., and Sharp, H. (2015). Interaction
design: Beyond human-computer interaction. Wiley,
Chichester, 4. ed. edition.
Schrepp, M., Held, T., and Laugwitz, B. (2006). The influ-
ence of hedonic quality on the attractiveness of user
interfaces of business management software. Inte-
racting with Computers, 18(5):1055–1069.
Schrepp, M., Hinderks, A., and Thomaschewski, J. (2014).
Applying the user experience questionnaire (ueq) in
different evaluation scenarios. In Marcus, A., edi-
tor, Design, User Experience, and Usability. Theo-
ries, Methods, and Tools for Designing the User Ex-
perience, volume 8517 of Lecture Notes in Computer
Science, pages 383–392. Springer International Pu-
blishing, Cham.
Schrepp, M., Hinderks, A., and Thomaschewski, J. (2017a).
Construction of a benchmark for the user expe-
rience questionnaire (ueq). International Journal
of Interactive Multimedia and Artificial Inteligence,
4(4):40–44.
Schrepp, M., Hinderks, A., and Thomaschewski, J. (2017b).
Design and evaluation of a short version of the user ex-
perience questionnaire (ueq-s). International Journal
of Interactive Multimedia and Artificial Intelligence,
4(6):103.
A Benchmark for the Short Version of the User Experience Questionnaire
377
