
Using Data Mining in a Mobile Application for the Calculation of the
Female Fertile Period
Francisco Vaz
1
, Rodrigo Rocha Silva
2,3
and Jorge Bernardino
1,3
1
Polytechnic of Coimbra, ISEC, Rua Pedro Nunes, Coimbra, Portugal
2
FATEC Mogi das Cruzes, São Paulo State Technological College, Brazil
3
CISUC – Centre for Informatics and Systems of the University of Coimbra, Coimbra, Portugal
Keywords: Data Mining, Fertile Period, Sharing Information, Application Architecture, Random Forest Algorithm.
Abstract: There is a great need that many women have for a better calculation of the fertile period, since this
calculation is important to know the best moments to have a sexual intercourse without pregnancy or with
the intention of generating a pregnancy. This work describes the use of data mining of in development a
mobile application for the calculation of the female fertile period. The application contains the main
functionalities needed, such as the insertion of symptoms and moods each day, a calendar with daily events
in which you can see the risk of pregnancy, ovulation day, among other features, taking into account all the
necessary topics, such as the architecture, as well as the data mining using Random Forest algorithm and
some of the main functionalities. The application allows the sharing of information with doctors and/or
partners as well as a prediction of the probability of delay for the next menstrual cycle. These two features
are completely innovative and will allow the success of the application, through a greater number of
downloads.
1 INTRODUCTION
The theme of the female fertile period is quite
present in the lives of all women and some problems
arise about it. At a certain point in a woman's life,
the fertile period gains a lot of importance (Seeley et
al., 2003). However, it is common for many women
to not fully realize what the fertile period is and
what it represents (Wilcox et al., 2000).
According to a study conducted in Britain, for
5686 women of childbearing age, about 9.7% of
women aged 16-44 had a pregnancy in the year prior
to the interview, of which 16.2% were not planned
(Wellings et al., 2013). It is necessary to perform
better medical follow-up, help combat early
pregnancies, and something is needed to serve as a
facilitator in the communication between a couple
for good family planning, so creating an application
is a good solution. Thus, based on the need for good
monitoring.
In this paper we propose the development for an
application to the calculation of the female fertile
period. We propose an architecture that we consider
to be the best for the implementation of the
application and to overcome the problem of
predicting accurately the female fertile period and
giving important information to the user.
We also propose the use of data mining, with the
algorithm Random Forest to calculate the prediction
of delayed menstruation for the next menstruation,
and we finally propose a system of sharing
information between the woman and the doctor (s)
and/or life partner.
With the construction of this application it is
possible for a user to establish a better relationship
with her partner, as well as obtain medical help
without the need to be in person with the doctor,
unless in case of need.
The rest of the paper is organized as follows.
Section 2 discusses the existing work on the data
mining in general and related to the existing
applications to calculate female’s fertile period.
Section 3 discusses the factors and functionalities
that influence the calculation of female fertile
period. Section 4 discusses the proposed
architecture. Section 5 discusses the data mining
approach. Section 6 discusses the proposed
information sharing. Finally, section 7 presents the
conclusions and future work.
Vaz, F., Silva, R. and Bernardino, J.
Using Data Mining in a Mobile Application for the Calculation of the Female Fer tile Period.
DOI: 10.5220/0007228603590366
In Proceedings of the 10th International Joint Conference on Knowledge Discovery, Knowledge Engineering and Knowledge Management (IC3K 2018) - Volume 1: KDIR, pages 359-366
ISBN: 978-989-758-330-8
Copyright © 2018 by SCITEPRESS – Science and Technology Publications, Lda. All rights reserved
359

2 BACKGROUND AND
LITERATURE REVIEW
In this section, we review some works to obtain
more information and knowledge on how to use data
mining and to see its importance in the most diverse
areas, as well as a study of the most popular
applications on the market related to the theme of
the female fertile period.
2.1 Data Mining
As we can see from the study done in this section,
data mining has great utility in many areas. Thus,
this study is important to consolidate our knowledge
and thus propose the use of data mining to predict
the probability of delay in menstruation, in a more
correct and assertive way.
Rygielski et al., (2002) said that through data
mining the extraction of hidden predictive
information from large databases organizations can
identify valuable customers, predict future
behaviours, and enable firms to make proactive,
knowledge-driven decisions.
Palaniappan and Awang (2008) used data mining
techniques to discover hidden patterns and
relationships for effective decision making. They use
data mining techniques namely, Decision Tree,
Naïve Bayes and Neural Network to develop a
prototype Intelligent Heart Disease Prediction
System.
Naik and Samant (2016) used Liver Patient
DataSet for testing the Classification algorithm to
classify the people with and without Liver disorder.
With this study we conclude that is of great
importance to use data mining to better predict the
probability of a woman’s menstruation delay.
2.2 Tools to Calculate Fertile Period
There are several questions that arise when talking
about the female fertile period. With regard to
knowledge of the fertile period, it can be said that it
is relevant for all women of childbearing age, not
only for those who wish to become pregnant, but
also for those who want to know better the
behaviours that arise associated with a phase of the
menstrual cycle (Lampic et al., 2006). To try to
clarify this task, mobile applications were
developed.
In general, these existing applications inform
about the date of the next menstruation of the fertile
period, also allow the comparison of mood states
along the cycle and between cycles, pains, among
other factors. After researching which apps are most
popular and used by women on websites well and
mainly in the Google Play Store, three applications
have come up that were referenced and where a
study was made to realize their features.
The applications referred above were chosen
preferentially because of their number of downloads
at the date this study was done at the beginning of
this stage.
2.2.1 Clue
Clue (GmbH, n.d.-a) Menstrual cycle and ovulation
calendar was considered to be one of the best
menstrual follow-up applications in terms of
accuracy, characteristics and functionalities, also
taking into account its number of downloads
(GmbH, n.d.-b).
2.2.2 Menstrual Calendar
Menstrual calendar (Design, n.d.) is an application
that after its installation, the user will have to answer
some initial questions, such as those that were
mentioned for the Clue application.
2.2.3 Flo
The Flo application (Owhealth, n.d.) provides a
simple way the menstrual cycle control. This
application, as well as those addressed, Clue and
Menstrual Calendar, also requires the user to
respond to the initial questions on the first use.
2.3 Comparison of Existing
Applications
With this previous study, it was possible to have
knowledge of the main functionalities that an
application for the calculation of the fertile period
needs to have. All these applications contain
practically the same functionalities however with a
different design.
Of the main differences between the applications
that were discussed above, some are of greater
relevance:
Clue and Flo are totally free, without advertising;
Pregnancy mode, which only the Calendar of the
Period contains;
Changing the theme of the application, which
only the Calendar of the Period contains;
Clue allows you to save the data in pdf format,
so the user can share it with the doctor.
Table 1 shows the functionalities that each
KDIR 2018 - 10th International Conference on Knowledge Discovery and Information Retrieval
360

application has, where it is possible to observe that
they have practically the same functionalities, but
there are some more relevant differences between
the applications that were discussed in the previous
paragraphs.
Table 1: Characteristics of the different existing
applications to control the female fertile period.
Characteristics
Clue
FreeApp
Menstrual
Calendar
Flo
FreeApp
Intuitivecalendar YES YES YES
Predictingdatesofthe
menstrualcycle
YES YES YES
Visualizationofpregnancy
riskscaledaily
NO YES NO
Possibilityofinserting
contraceptivemethod
YES YES NO
Possibilitytoactivate/
deactivatenotifications
YES YES YES
Personaldiary NO YES YES
Reports YES YES YES
Lifestylemanagement NO NO YES
PregnancyMode NO YES NO
Personalization/
confirmationofautomated
cyclesbytheapplication
YES YES NO
SecurityandPrivacy YES YES YES
Backup YES YES NO
Selectionofseveral
languages
YES YES YES
Themesortemplate NO YES NO
Forums YES YES YES
Alerttodobreastpalpation NO YES NO
Previewentriesperyear NO NO YES
Savedatatopdfandshare
withdoctor
YES NO NO
RemoveAds NO YES NO
This table was made using the applications to
better understand the main features that an
application for this theme should contain.
After all this analysis, it was possible to design
the best possible way an application that could
contain most of the functionalities described in
Table 1, as well as some that are innovative and
none of the applications contains.
Thus, the developed application approached and
concretized two distinct functionalities, which are:
Data mining to predict the delay of menstruation
of the following menstrual cycle;
Sharing information with the partner and/or
doctor(s).
A comparative table of the characteristics of the
studied applications is presented below.
3 THE INFLUENCES ON
CALCULATION FERTILE
PERIOD
These factors and functionalities that resulted from
the conversation with some friends as well as the use
of existing applications in the market, will be
considered as input to the system and inserted by the
user.
Day of the Start of the Last Menstruation: this
corresponds to the first day of the cycle. It is of
utmost relevance for the calculation of the fertile
period.
Number of Days in the Cycle: perceive if it is a
short, long or normal cycle and allows to have
the perception of the regularity of the cycles.
Also having great relevance for the calculation of
the fertile period, because at the last day of the
cycle will be taken 14 days and will be obtained
the probability of the day on which ovulation
occurs. The mean duration of the cycle is 22 to
36 days (Fehring et al., 2006).
Number of Days of Menstruation: For woman
to have more knowledge about her body. The
average duration of menstruation is from 2 to 7
days (Seeley et al., 2003).
Contraceptive Method: in relation to the pill,
the existing calendar allows the user to note
whether the pill has been taken, whether it was
late or note. It should be noted that it is possible
to use any contraceptive method and that the
system will be adapted.
Calendar: this is a very important feature of the
system, since the ovulation day, the days of the
fertile period, the risk of pregnancy (low,
medium and high risk) for each day of the
menstrual cycle, the days of menstruation
inserted by the user and access to the history of
the previous months, are all shown in the
calendar.
Weight: it is a factor that influences the
oscillations of the fertile period. People with low
weight do not have enough amounts of fat, with
this, the cycles become increasingly irregular.
Often menstruation may not even come.
(Teixeira et al., 2013).
Pregnancy: there is the possibility of applying
the mode of pregnancy in the system, if the
woman gets pregnant, serving as reference and
keeping the record of each month of gestation.
The pregnancy mode allows to see the
countdown to the baby’s birth and allows to
Using Data Mining in a Mobile Application for the Calculation of the Female Fertile Period
361

receive a reminder to record the cycle after
pregnancy.
Mood and Symptoms Status: it allows the
woman to make comparisons later between the
phase of the cycle and a particular symptom.
Turns out to be her clinical history related to
symptoms favouring the knowledge of her body
(Seeley et al., 2003).
Data Sharing: this allows an exchange of data
between the doctor and anyone the user wishes to
have access to. That is, the user can always have
the doctor's care without physical presence.
Notifications: it will inform the user about
taking the pill (if applicable) and predicts the day
on which the next menstruation will occur. It
promotes the fact of the daily intake at the same
time, taking to the maximum efficiency of the
same.
4 PROPOSED ARCHITECTURE
For the realization of this application it was
necessary a deliberation for the construction of the
best possible architecture. An architecture that
eventually undergoes some changes in the
development of the application, however, an end
product is reached.
It is an architecture that at the top allows the
visualization of the Android application, which
corresponds to the final application produced for
users as well as doctors or companions.
In order to be able to access the data of all users
of the application, the communication between
REST and MySQL was used.
REST, in addition to communicating with the
database, was also necessary to relate it to the data
mining module, which in this case was WEKA.
Thus, it was possible to predict the probability of a
woman's delay in the period of the next month of her
menstrual cycle (this case will be studied in section
5).
For all this communication to occur between the
application and REST, the data is received on
Android in JSON and is handled according to the
application's intended need to be able to show users
the information in the most correct way.
We assume as an external API, the calendar we
use, because after an intense search, it was
concluded that native Android does not provide a
calendar as intended, only a basic calendar is
available without the possibility of put events on a
particular day.
However, through the calendar provided by
Riotech (“Riontech-CustomCalendar,” n.d.), it was
found that it was possible to give users a better
experience in visualizing their menstrual cycle, with
a very intuitive and simple design.
Even though it was necessary to implement new
methods to the calendar, as was the case of placing
more than one event on the same day, as well as it
was necessary to resolve some bugs.
5 DATA MINING
Using data mining to predict the likelihood of
menstruation delay in the next cycle of the user is
one of the main innovative features that our
application has compared to those that already exist
in the market.
The calculation of the female fertile period is
very important in the life of women, since it
influences their lives to the extent that, if you want
to prevent or have a pregnancy, this calculation can
help. With a better calculation of the fertile period,
and better predictions of delay, it will be possible for
the woman to make the decisions she wants, that is,
whether she intends to become pregnant or not.
We then chose to use Data Mining, using the
WEKA tool using the Random Forest algorithm.
A data set was constructed for this calculation.
The dataset is given in the ARFF (Attribute Relation
File Format) format which is compatible with
WEKA (Manzoor et al., 2015).
DataSet: The data set corresponds to the
probability of delay in calculating the female
fertile period and contains 509 instances. This
data set contains 221 instances with probability
of delay and 288 with no probability of delay.
This data set contains attributes that are favourable
to the calculation of the probability of delay of the
female fertile period. The attributes of our data set
are:
Impatient: This attribute matches the state of
humor impatient. Impatience is a factor that is
important in calculating probability.
Stress: This attribute matches the state of humor
stress. The more a user is stressed, the more
likely it is to deregulate their cycle.
Depressed: This attribute matches the state of
humor depressed. If a user is very depressed
during her menstrual cycle, it may affect the
probability of delay.
Headaches: This attribute matches the
symptoms headaches. Headaches is a fairly
KDIR 2018 - 10th International Conference on Knowledge Discovery and Information Retrieval
362

common factor during menstruation of women,
however it may condition your menstrual cycle.
Abdominal Cramps: This attribute matches the
symptoms abdominal cramps. Abdominal
cramps are a factor that also conditions the cycle
of a user to the extent that there may be quite
strong pains during the menstrual cycle.
Probability of Delay: This attribute matches
possibility of the delay occurs based on the
previous attributes.
5.1 Evaluation of Classification
Algorithm using Weka
We evaluate the performance of the classification
algorithm using Confusion Matrix.
Confusion Matrix is a table, as shown in Table 2,
that summarizes the classification performance of a
classifier with respect to some test data (Shultz and
Fahlman, 2017). Confusion Matrix contains
information about actual and predicted
classifications done by classification systems.
Table 2: Confusion Matrix.
ActualValue(asconfirmedbyexperiment)
PredictedValue
(predictedbythetest)
Positives Negatives
Positives
TP
TruePositive
FP
FalsePositive
Negatives
FN
FalseNegative
TN
TrueNegative
Defining the terms of the confusion matrix:
True Positives (TP): In this case we predicted
“there is a delay” and do have the delay.
True Negatives (TN): In this case we no
predicted the delay and do not have the delay.
False Positives (FP): In this case we predicted
delay but don’t actually have the delay.
False Negatives (FN): In this case we predicted
no delay but actually do have the delay.
We also have the value of precision and recall that
are provided through the Weka as well as the
confusion matrix.
Precision is the number of True Positives divided
by the number of True Positives and False Positives.
Basically, it is the number of positive predictions
divided by the total number of positive class values
predicted. Recall is the number of True Positives
divided by the number of True Positives and the
number of False Negatives. Basically, it is the
number of positive predictions divided by the
number of positive class values in the test data.
The computation of precision and recall values is
as follows:
Precision = TP / (TP + FP)
Recall = TP / (TP + FN)
The performance of the classification algorithms
tested is based on accuracy. Calculation of Accuracy
value:
Accuracy = (TP + TN) / (TP + FP +
TN + FN).
5.2 Decision Tree
We apply the Decision Tree algorithm to DataSet, in
these 501 cases, the classifier predicted probability
of occurring delay 214 times and predicted
probability of not occurring delay 287 times. In fact,
in 214 instances of the sample probability of delay
occurs and in 287 no delay occurs.
Table 3 shows a precision=0.667 and
recall=0.737 for “delay”. Which means that for
precision, some of the times “delay” was predicted,
66.7% of the time the system was in fact correct. For
recall it means that out of all times “delay” should
have been predicted, 73.7% of cases were correctly
predicted.
For “no delay”, precision=0.952 and
recall=0.934 which means that for precision, out of
the times “no delay” was predicted, 95.2% of the
time the system was in fact correct. For recall it
means that out of all times “no delay” should have
been predicted, 93.4% of cases were correctly
predicted.
The results of application Decision Tree
algorithm to Data Set are shown in Table 3.
Table 3: Confusion Matrix of Application Decision Tree
Algorithm to dataset.
True1
(delay)
True2
(nodelay)
Class
Precision
Pred.1 (delay) 56 20 66.7%
Pred.2(nodelay) 28 397 95.2%
Recall 73.7% 93.4%
5.3 Naïve Bayes
We apply the Naïve Bayes algorithm to DataSet, in
these 501 cases, the classifier predicted probability
of occurring delay 214 times and predicted
probability of not occurring delay 287 times. In fact,
in 214 instances of the sample probability of delay
occurs and in 287 no delay occurs.
Using Data Mining in a Mobile Application for the Calculation of the Female Fertile Period
363
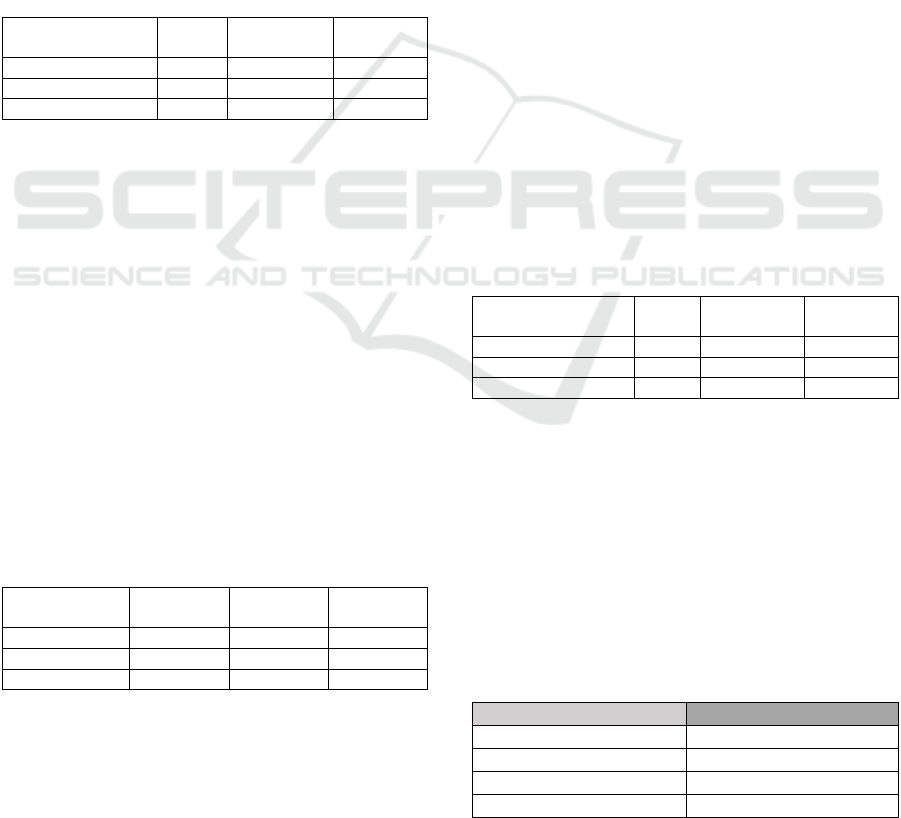
Table 4 shows a precision=0.933 and
recall=0.368 for “delay”. Which means that for
precision, some of the times “delay” was predicted,
93.3% of the time the system was in fact correct. For
recall it means that out of all times “delay” should
have been predicted, 36.8% of cases were correctly
predicted.
For “no delay”, precision=0.898 and
recall=0.995 which means that for precision, out of
the times “no delay” was predicted, 89.8% of the
time the system was in fact correct. For recall it
means that out of all times “no delay” should have
been predicted, 99.5% of cases were correctly
predicted.
The results of application Naïve Bayes algorithm
to Data Set are shown in Table 4.
Table 4: Confusion Matrix of Application Naïve Bayes
Algorithm to dataset.
True1
(delay)
True2
(nodelay)
Class
Precision
Pred.1(delay) 28 48 93.3%
Pred.2(nodelay) 2 423 89.8%
Recall 36.8% 99.5%
5.4 k - Nearest Neighbors
We apply the k – Nearest Neighbors algorithm to
DataSet, in these 501 cases, the classifier predicted
probability of occurring delay 214 times and
predicted probability of not occurring delay 287
times. In fact, in 214 instances of the sample
probability of delay occurs and in 287 no delay
occurs.
Table 5 shows a precision=0.507 and
recall=0.461 for “delay”. Which means that for
precision, some of the times “delay” was predicted,
50.7% of the time the system was in fact correct. For
recall it means that out of all times “delay” should
have been predicted, 46.1% of cases were correctly
predicted.
Table 5: Confusion Matrix of Application Nearest
Neighbors Algorithm to dataset.
True1
(delay)
True2
(nodelay)
Class
Precision
Pred.1(delay) 35 41 50.7%
Pred.2(nodelay) 34 391 90.5%
Recall 46.1% 92%
For “no delay”, precision=0.905 and recall=0.92
which means that for precision, out of the times “no
delay” was predicted, 90.5% of the time the system
was in fact correct. For recall it means that out of all
times “no delay” should have been predicted, 92%
of cases were correctly predicted.
The results of application Nearest Neighbors
algorithm to Data Set are shown in Table 5.
5.5 Random Forest
We are applying the random forest algorithm to
DataSet, in these 501 cases, the classifier predicted
probability of occurring delay 214 times and
predicted probability of not occurring delay 287
times. In fact, in 214 instances of the sample
probability of delay occurs and in 287 no delay
occurs.
Table 6 shows a precision=0.836 and
recall=0.605 for “delay”. Which means that for
precision, some of the times “delay” was predicted,
83.6% of the time the system was in fact correct. For
recall it means that out of all times “delay” should
have been predicted, 60.5% of cases were correctly
predicted.
For “no delay”, precision=0.933 and
recall=0.979 which means that for precision, out of
the times “no delay” was predicted, 93.3% of the
time the system was in fact correct. For recall it
means that out of all times “no delay” should have
been predicted, 97.9% of cases were correctly
predicted. The results of application Random Forest
algorithm to Data Set are shown in Table 6.
Table 6: Confusion Matrix of Application Random Forest
Algorithm to dataset.
True1
(delay)
True2
(nodelay)
Class
Precision
Pred.1(delay) 46 30 83.6%
Pred.2(nodelay) 9 416 93.3%
Recall 60.5% 97.9%
5.6 Discussion of Results
We use the dataset explained above. The dataset
contains 501 instances with 5 independent variables,
variables corresponding to mood states and
symptoms that influence the calculation, and a class
variable corresponding to the value of whether or
not there is a delay. The performance of these
classification algorithms based on Accuracy was
compared in Table 7.
Table 7: Accuracy Measure of Classification Algorithm.
Algorithm Dataset
DecisionTree 90.4%
NaïveBayes 90.1%
K
–
Nearest Neighbors 85%
RandomForest 92.2%
KDIR 2018 - 10th International Conference on Knowledge Discovery and Information Retrieval
364
Decision Tree algorithm, Naïve Bayes algorithm
and Random Forest algorithm perform better than K
– Nearest Neighbors algorithm because precision
and recall values are better.
Concluding Weka estimates a lowest accuracy
for K – Nearest Neighbors and better to Random
Forest. These results suggest that, among the tested
machine learning algorithms, Random Forest is the
classifier that obtains the best results.
After analysing the results, we can conclude that
having a good precision doesn’t mean that a good
accuracy is also achieved. The same can be said if
the results indicate a good accuracy, that won’t mean
that a good precision was obtained.
Through this more reasoned study, we could then
conclude that the algorithm to be used in the
application to predict the probability of delay of the
next menstruation will be Random Forest, which
will be used for the tests that follow, because it
obtained a better accuracy compared to the other
classification algorithms.
5.7 Test Results using Random Forest
in the Application
After verifying that the best algorithm is Random
Forest, we did then do tests in the application, with
this algorithm.
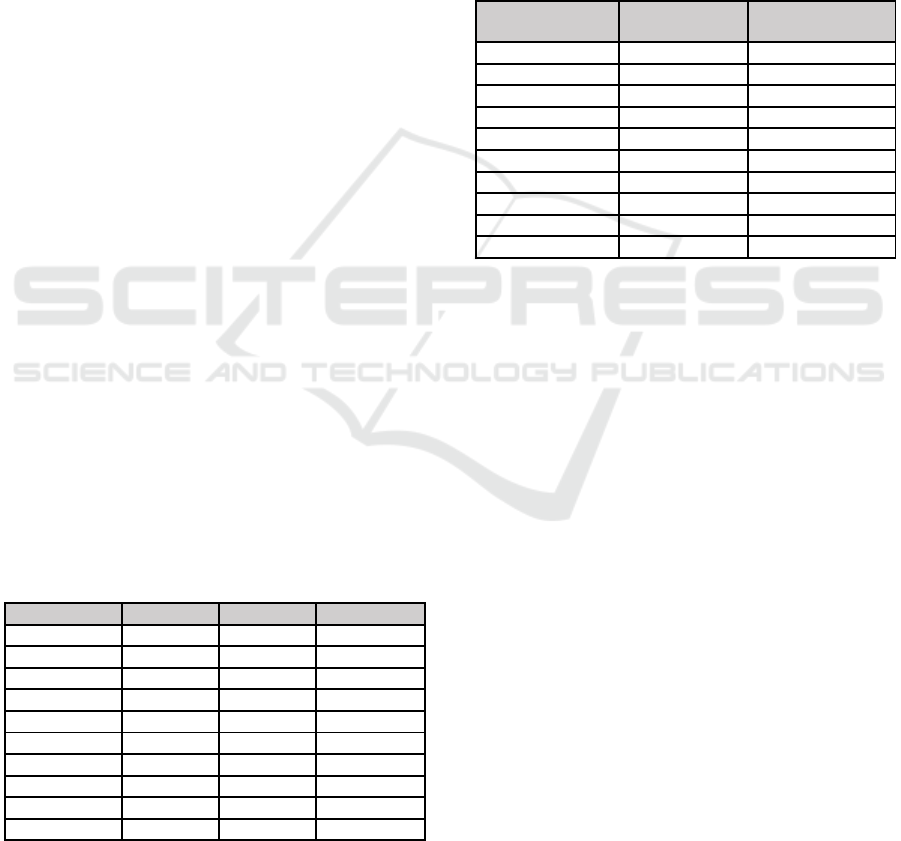
Table 8 (a) and Table 8 (b) shows the results
obtained regarding the probability of delay of certain
cycles of a random user, through the application. It
should be noted that all calculated probabilities vary
from woman to woman, since the body of each is
different. So, the more the user uses the application,
the smarter it gets, inserting a new row in the data
set, with the values of the inputs/attributes and their
probability, at each menstrual cycle.
Table 8 (a): Results obtained regarding the probability of
delay of certain cycles of a random use.
Impatience Stress Depressed Headaches
No No No 1
No No Yes 1
Yes No Yes 3
Yes Yes No 4
No No No 6
No Yes No 1
Yes No Yes 2
No Yes Yes 5
Yes Yes Yes 1
Yes Yes Yes 6
By inserting the values of the attributes in the
data set each cycle will make the application more
effective, obtaining more realistic and assertive
probabilities considering the user of the same. So,
the forecast of delay in the following month will be
more correct according to the previous data of the
user.
When analysing Table 8, we cannot reach
concrete results, because everything varies from
woman to woman, however, to have notion, for all
attributes with a value of 1 and it is not very difficult
to delay menstruation, with the attributes all with a
value of 6 and with a yes value, there is a high
probability that there will be a delay.
Table 8 (b): Results obtained regarding the probability of
delay of certain cycles of a random use.
AbdominalCramps
DelayProbability
(%)
NoDelayProbability
(%)
1 0.0017 0.9982
1 0.0051 0.9948
3 0.3552 0.6448
5 0.3030 0.6969
6 0.2139 0.7861
6 0.0989 0.9010
2 0.0512 0.9487
5 0.6069 0.3931
1 0.4325 0.5675
6 0.8621 0.1378
6 PROPOSED INFORMATION
SHARING
Another of the great innovative features of this
application is the sharing of information of a
particular user, with his doctor and/or companion. It
is a very important feature since it allows the doctor
to have a better knowledge of the health, and the
behavior of the body of his patient, as well as it is
important for the relationship between the couple, so
that they know each other better.
It should be noted that there are some
applications that allow the user to share information
with who they want, but only through an image or a
pdf with the information. Already in our application,
the doctor or the companion can have access to the
information they shared with the application itself,
that is, they have a proper login where they can see
all the information that was shared with them.
The sharing process is a simple process that is
only possible when the user adds the contact you
want to your contact list, that is, before the user can
share, you must add the desired contact to your
contacts in the application. After adding the contact,
you can share and the doctor or partner she shared
will receive a notification on the mobile phone
Using Data Mining in a Mobile Application for the Calculation of the Female Fertile Period
365

where, when you open it will appear all the
information that the woman shared.
Shows two of the application windows, in which
you can see, on the left side the calendar with certain
events on the selected day and for sharing, the user
will click the share button in which the window on
the right, the associated contacts are arranged. After
sharing and receiving notification from the woman,
the doctor and/or the partner will see the left window
as the user shared it.
In conclusion, through this functionality it is
possible to facilitate communication between a
couple on family planning. It also serves to aid in the
reduction of unwanted early pregnancy.
Undoubtedly it is a feature that does not yet exist
and differs from existing applications and is a
benefit for us.
7 CONCLUSIONS AND FUTURE
WORK
This work describes the importance of a mobile
application for the calculation of the female fertile
period. The fact that this application has the option
of data sharing is an increased value, since it allows
a doctor-patient communication, quite efficient. It
also allows the visualization of the probability of
delay in menstruation for the next menstrual cycle,
functionality comes from the use of data mining and
allows women to make decisions about possible
sexual activities, for example. Finally, this
application allows to save and optimize resources,
such as the time spent on visits and consultations, as
well as optimize the diagnosis by the doctor, because
it has a history of the patient in question.
As future work we intend to improve the design
of the application, a property that requires some time
to be quite intuitive and simple. Another of the
features we want to improve is the use of data
mining to predict the probability of delay in the next
menstruation, with the insertion of the necessary
data, like the inputs, at the end of each menstrual
cycle to the data set in order to make it more
efficient and complete. Finally, we intend to
improve the functionality of information sharing,
and in addition to the calendar, we want the user to
be able to share all the information they have acess
to in the application, such as the contraceptive
method she use, her weight, among others, for a
better experience.
REFERENCES
Euzenat, J. & Shvaiko, P., Ontology matching. Springer,
2007.
Design, S. (n.d.). Calendário-Menstrual-app. Retrieved
September 2, 2017, from https://play.google.com/
store/apps/details?id=com.popularapp.periodcalendar
&hl=pt_PT.
Fehring, R. J., Schneider, M., & Raviele, K. (2006).
Variability in the Phases of the Menstrual Cycle.
Journal of Obstetric, Gynecologic & Neonatal
Nursing, 35(3), 376–384.
GmbH, B. (n.d.-a). Clue-app. Retrieved September 1,
2017, from https://www.helloclue.com.
GmbH, B. (n.d.-b). Clue-Download. Retrieved September
2, 2017, from https://play.google.com/store/apps/
details?id=com.clue.android&hl=pt_PT.
Lampic, C., Svanberg, A. S., Karlström, P., & Tydén, T.
(2006). Fertility awareness, intentions concerning
childbearing, and attitudes towards parenthood among
female and male academics. Human Reproduction,
21(2), 558–564. https://doi.org/10.1093/humrep/
dei367.
Manzoor, U., Balubaid, M. A., Usman, M., & Mueen, A.
(2015). Ontology-Based Clinical Decision Support
System for Predicting High-Risk Pregnant Woman.
International Journal of Advanced Computer Science
and Applications, 6, 6.
Owhealth. (n.d.). Flo-app. Retrieved September 2, 2017,
from https://play.google.com/store/apps/details?id=org
.iggymedia.periodtracker&hl=pt.
Riontech-CustomCalendar. (n.d.). Retrieved September 1,
2017, from https://github.com/Riontech/
CustomCalendar.
Seeley, R. R., Stephens, T. D., & Tate, P. (2003).
Anatomia e Fisiologia. (Lusociência, Ed.) (6
a
Edição).
Loures: Martin J. Lange.
Shultz, T. R., & Fahlman. (2017). Encyclopedia of
Machine Learning and Data Mining. Springer
Science+Business Media New York 2017.
Teixeira, A. L. S., Damasceno, V. O., Dias, M. R. C.,
Lamounier, J. A., & Gardner, R. M. (2013).
Association between Different Phases of Menstrual
Cycle and Body Image Measures of Perceived Size,
Ideal Size, and Body Dissatisfaction. Perceptual and
Motor Skills, 117(3), 892–902.
Wellings, K., Jones, K. G., Mercer, C. H., Tanton, C.,
Clifton, S., Datta, J., … Johnson, A. M. (2013). The
prevalence of unplanned pregnancy and associated
factors in Britain: Findings from the third National
Survey of Sexual Attitudes and Lifestyles (Natsal-3).
The Lancet, 382(9907), 1807–1816.
Wilcox, A. J., Dunson, D., & Baird, D. D. (2000). The
timing of the “fertile window” in the menstrual cycle:
day specific estimates from a prospective study. BMJ,
321, 1259–1263.
KDIR 2018 - 10th International Conference on Knowledge Discovery and Information Retrieval
366
