
The Validation of the Sierra Kappa Scale (SKS)
Yulinda Siregar, Itsar Bolo Rangka, Sisca Folastri, Lusiana Wulasari, Solihatun Solihatun, Christine
Masada H. Tobing, and Miskanik Miskanik
Department of Guidance and Counseling, Faculty of Education and Social Sciences, Universitas Indraprasta PGRI Jl.
Raya Tengah No. 80. Kel. Gedong, Kec. Pasar Rebo, Jakarta Timur 13760, Indonesia
itsarbolo.rangka@unindra.ac.id
Keywords: Validation, Spirit, Work Carried, Rasch Model, Psychometrics Properties.
Abstract: This article discusses concept and measurement of Sierra Kappa Scale (SKS) in an Indonesian context. SKS
designed to measure morale manifested into behaviour, feelings, adaptability, and sensitivity of the work
carried. The study used survey method and data analysis based upon the framework of modern
psychometrics approach. In this study Rasch Model was used to measure the psychometrics properties of
the 25 items of SKS. Initial set of items was administered to employees in government and private
institutions (N=443). The results of this study showed that the SKS supported the suitability of solid
invariance, and robustness of the scale. Unfortunately, only 21 items have ideal measurement estimates. The
internal consistency and psychometrics properties, was also appropriate. The article concludes by discussing
research and practical implications of the scale in human works context. This instrument has a very high
quality of validity and reliability to be applied in a measure of the spirit at work.
1 INTRODUCTION
Human resources play a significant part and is
looked at as the major driving factor in shaping one's
success in working. To draw the individual
resources required by the agency in order to provide
positive contribution to all the activities of the
institution in achieving its objectives, every
employee proposed to have high morale so that will
build up high work productivity.
Spirit is a very important thing to be noticed by
the management if they want every employee can
contribute positively to the achievement of agency
goals (Locke and Latham, 1990). An employee has a
high spirit tend to see work positively. Encourage
the spirit of the employees should be done to
encourage the achievement of good and effective
performance so that leaders have satisfaction with
the performance of employees (Brahmasari and
Suprayetno, 2009). The facts are: leaders should also
understand their own values and goals in order to
express themselves accurately and openly (Anderson
and Stockton, 2001); A wide range of people brings
different challenges and advantages in terms of
ideas, creativities, styles, and innovations into the
workplace (Chuang, 2013). Needed a way to direct
the power and potential of a person to work to
achieve goals that have been specified.
The drive of a person to work is different from
others so that human behavior tends to vary. The
spirit of work is formed from the attitude of
employees in the face of work situations in the
company. Spirit is a part of motivation where the
condition or energy that moves the employees are
directed or directed to achieve corporate
organization goals. The mental attitude of employees
who are pro and positive to the work situation that
strengthens the spirit of work to achieve maximum
performance (Mangkunegara, 2005).
Good performance is the basis for determining
the effectiveness of the activities, especially the
operational effectiveness, the organization and
employees based on predetermined targets,
standards and criteria. Good performance also refers
to the ability of an enterprise to achieve such
objectives as high profit, quality product, large
market share, good financial results, and survival at
pre-determined time using relevant strategy for
action (Obiwuru et al., 2011)
Besides, Goncalves (2013) said that reward
power can be used to punish (passive coercion),
when rewards are withheld in response to poor
Siregar, Y., Rangka, I., Folastri, S., Wulasari, L., Solihatun, S., Tobing, C. and Miskanik, M.
The Validation of the Sierra Kappa Scale (SKS).
In Proceedings of the Annual Conference on Social Sciences and Humanities (ANCOSH 2018) - Revitalization of Local Wisdom in Global and Competitive Era, pages 135-141
ISBN: 978-989-758-343-8
Copyright © 2018 by SCITEPRESS – Science and Technology Publications, Lda. All rights reserved
135

performance. The purpose to determine the level of
employee morale for leadership can do coaching and
formulate an effective and efficient work program. It
means also able to maintain and improve morale,
passion and passion of work, because the work in
accordance with the capacity of the employees
themselves. Furthermore, morale also spur
competition in achieving in a company or institution
through healthy competition between
individual/team work.
Spirit involves in it the direction or purpose of
behaviour, the power of response, and the
persistence of behaviour. In addition, the term
includes a number of concepts of encouragement,
necessity, incentive, reward, reinforcement, goal
setting, and expectancy (Campbell, 2002). Basically,
humans always want things that are okay, so the
driving force or mover to work depends on the
expectations that will be obtained if the hope comes
true then someone will tend to increase morale.
The spirit of work is a condition in which
employees need a full appreciation of their work, get
a comfortable atmosphere in the job, safety in work,
good salary, interesting jobs and wise discipline of
each leader (Riyadi, 2011). One of the factors that
affect work productivity is the lack of employee
morale where one of them is a matter of lack of
work spirit on an agency leader. The spirit of work is
a condition or state in an agency that wants to
increase profits greater than before, therefore the
spirit of work plays an important role in obtaining
maximum productivity (Agusta, 2013; Susanty and
Baskoro, 2013) because the purpose of the spirit of
work is to give morale to every employee in order to
perform their duties effectively and efficiently.
Every human being has a need that the
emergence of the spirit depends on the interests of
the individual. Abraham Harold Maslow put forward
the "Hierarchy of needs theory" to answer about the
level of human need. After all, the individual as an
employee cannot escape from his needs. The needs
are; physiological needs, sense of security, love and
belonging, self-esteem, and self-actualization
(Sudrajat, 2008; Sri Mendari, 2013).
Instruments for measuring spirit of work have
been widely developed, among others by Kinjerski
in 2006 and 2013 (Kinjerski and Skrypnek, 2006;
Kinjerski, 2013). Unfortunately, there is not much
information that can be found related to the spirit of
work that is more specific.
In this study, the developed instrument is a work
spirit tool that is oriented in the field of physical
work. Previously, this information has been
compiled referring to Blum's opinion of 1968
(Azwar, 1999). The item selection is done based on
item-total correlation to 64 items, and the best 25
items are obtained. Unfortunately, the subject
documentation used in the tests, item statistics, and
scalability reliability reports no longer exists.
Azwar, (1999) suggested validating the Sierra Kappa
Scale (SKS) because it is a scale that can be used to
measure employee morale especially in the physical
field. The kappa statistic is the most widely used
measure for the performance of models generating
presence–absence predictions (Allouche, Tsoar and
Kadmon, 2006). The popularity of kappa has led to
the development of many extensions, including,
kappas for three or more raters, kappas for groups of
raters and kappas for ordinal categories (Warrens,
2013).
2 METHODS
The study involved 443 respondents, consisting of
male = 121 (27,31%), and female = 332 (72,69%).
The respondent's age characteristics were
spread over the 17–21 years (20.54%), 22-27 years
53.95%), 28-34 years (13.77%), 34-40 years
(5.42%), 41 - 50 years (5.87%), and 51 years old
(0.45%). Furthermore, the employment status of the
respondents was permanent workers (46.95%),
casual workers (20.54%), and contract workers
(32.51%). Duration of work of the respondents is
also our concern, where there are 22.57% of
respondents work less than a year, 38.15% work
between 1-3 years, 23.02% have worked 3-6 years,
11.51% have worked 6 - 10 years, 4.29% have
worked 10 - 20 years, and 0.45% have worked for
more than 20 years.
Administration of SKS is conducted from
December 1, 2017 to January 13, 2018 with Survey
Monkey Platform. In the data collection period
founded 675 people who filled the SKS, but only
443 respondents who completed SKS well; the rest
232 leave the filling SKS in the middle of the road
(not complete).
The SKS consists of 25 items with five answer
options (Likert rating). The answer option is
negative, i.e. item no. 1, 3, 4, 6, 7, 8, 13, 18, and 19.
The rest are positive statement items. On the positive
statement the weight of the ratings is given 5 for
always, and 1 for never. On the contrary, on the item
of weighting the negative weight rating is given 5
for never and 1 for always.
The indicators used to construct the SKS
instruments include: (1) the least aggressive
behaviour that leads to aggression, (2) Individuals
work with a sense of happiness and other pleasant
ANCOSH 2018 - Annual Conference on Social Sciences and Humanities
136

feelings, (3) the individual can adjust to his / her
colleagues well, and (4) his ego is deeply involved
with his work (Azwar, 1999).
In administering SKS, we convey that the filling
of the SKS is voluntary and there is no coercion or
binding things on the respondents. All respondents'
answers are credentials.
3 RESULTS AND DISCUSSIONS
3.1 Reliabilities and Separation Index
Reliability refers to the ability possessed by the
instrument to produce meaningful information; in
this case an instrument can explain how far the
measurements made many times will produce
convincing information (Sumintono and Widhiarso,
2014, 2015). High reliability results provide
confidence that individual indicators are all
consistent with their measurements (Aryani and
Rosinta, 2011).
We estimate the reliability of the SKS in
different ways, in addition to estimating the
interaction between items and person when the SKS
is administered, we also estimate the degree of
reliability of the item and person independently. The
reliability information referred to is presented in
Table 1.
Table 1: Reliability scores generated by SKS
instruments.
Aspects of Reliability
Value
Mean
Person
0.77
0.66
Item
0.99
0.00
Cronbach Alpha (KR-20) Person Raw Score "Test" Reliability
= 0.81
Table 1 indicates that overall the SKS instrument
produces good reliability (0.81). Reliability at the
item level in the SKS also gets an excellent score
(0.99). Unfortunately, the reliability of the item is
not followed by the reliability of the person
(respondent), where the reliability value of the
person is only in good enough category (0.77). The
next estimate is to know the amount of separation
index both on person and item in SKS.
Table 2: Score of separation index generated by SKS
instrument.
Aspect
Magnitude of Separation Index
Person
1.83
Item
12.25
The reliability estimates in particular on the
person and item in the SKS are also confirmed on
the size of the separation index. Table 2 indicates
that the capabilities generated by SKS items can
result in 13 data groupings, or in other words the
hierarchy of item difficulty is very large.
Meanwhile, the person only able to produce 2
groups of respondents only, or in other words SKS is
only able to recognize a typical group that has a high
and low work spirit.
3.2 Estimate of Unidimensional
In contrast to factor analysis, Rasch modelling has
different perspectives in identifying dimensions in
measurement. The existence of dimensions is not
only seen based on the interrelationship between the
grains because it is very possible that the particular
item is a separate dimension.
To perform dimensionality analysis on SKS is
used Principal Component Analysis (PCA). This is
equivalent to factor analysis which one of the
objectives is to evaluate whether the developed
instrument measures what should be measured
(Validity) and estimates the diversity in an
instrument. The PCA test results in the SKS are
presented in Table 3.
Table 3: Standardized residuals variance (in
eigenvalue units).
Observed
Expected
Total raw variance in Observations
100.0%
100.0%
Raw variance explained by measures
39.8%
41.0%
Raw variance explained by persons
8.9%
9.1%
Raw Variance explained by items
31.0%
31.9%
Raw unexplained variance (total)
60.2%
59.0%
Unexplained variance in 1st contrast
9.7%
16.2%
Unexplained variance in 2nd contrast
5.9%
9.7%
Unexplained variance in 3rd contrast
5.1%
8.5%
Unexplained variance in 4th contrast
4.0%
6.6%
Unexplained variance in 5
th
contrast
3.6%
6.0%
Based on the data in Table 3 it was found that
the variance that can be measured by SKS is 39.8%.
This indicates that the unidimensional requirements
The Validation of the Sierra Kappa Scale (SKS)
137
of the SKS have been met (> 20%). Furthermore, the
raw variance measure is divided into 8.9% person,
and item 31.0%.
Although unidimensional requirements have
been achieved, there is still a considerable gap
between Raw variance explained by measures and
the total raw unexplained variance. This indicates
that the quality of respondents is good (honest and
serious) when the SKS is administered.
3.3 Partial Credit Model (PCM)
Another test property measurement problem is the
need for verification process on the answer choice of
validated instrument. The amended verification is to
ascertain whether the choice of answers given in the
SKS is confusing to the respondent or not. To
estimate used the Partial Credit Model (PCM) as
presented in Table 4.
Table 4: Category Structure, Model="R".
Label
Statement
Observed
Andrich
Average
Threshold
1
Strong Disagree
-0.56
None
2
Disagree
-0.24
-1.14
3
Neutral
0.26
-0.95
4
Agree
0.94
0.41
5
Strong Agree
1.44
1.67
There are two indicators to test whether the
respondent is confused or not, namely by observing
the value of Observed Average and Andrich
Threshold. In Table 4 it is known that both the
Observed Average and Andrich Threshold values
both show a monotonic increase in value; from the
smallest logit to label 1 to the largest logit for label
5. This indicates that there is no confusion in the
respondent self when administering the SKS. In
other words, the choice of answers available on the
SKS is correct and no revisions are necessary.
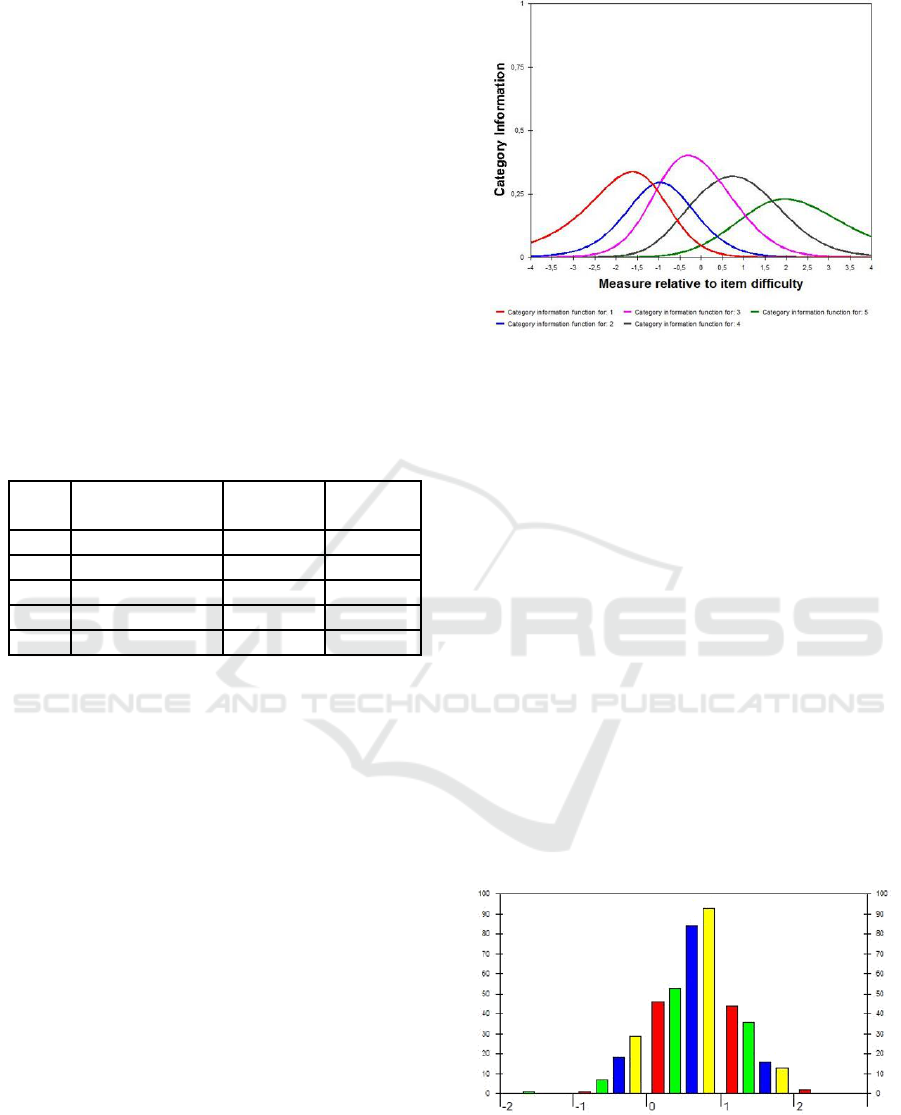
The information shown in Table 4 can also be
confirmed through Figure 1, where most of the
answer options available in the SKS provide
equitable information.
Figure 1: Category information and maximum information
curve for a well-behaved polytomous item.
3.4 Person Fit and Person Measure
Person fit is the measure used to identify whether
there are respondents or persons who fill the SKS
provide the appropriate pattern (expected) or not.
The criteria used to check the fit person are: (a)
Acceptable Mean Outfit Value (MNSQ) = 0.5
(Sumintono and Widhiarso, 2014, 2015; Bond and
Christine M. Fox, 2015; Rangka, 2017).
Based on 443 respondents who fill the SKS
known there are 68 respondents categorized misfit,
i.e. respondents who do not give unnatural answers
or in other words the respondents are not serious
when filling SKS. Thus, only 375 respondents who
take SKS seriously.
Furthermore, based on individual measure
estimation, it is known that respondent No 009 is
respondent who has a very high morale (2.14 logit).
On the other hand, respondents no 194 were
respondents who had the lowest morale (-1.51 logit).
Figure 2: Person measure distribution bar.
In general, overall employee morale is above
average. This is evidenced in Figure 2 where the
person measure distribution bar is more likely to the
right.
ANCOSH 2018 - Annual Conference on Social Sciences and Humanities
138
3.5 Item Fit and Item Measure
Item Fit and Item Measure are a core part of the SKS
validation process. In this section we evaluate which
items are in the appropriate SKS to measure
employee morale. The criteria for estimating the
Item Fit and Item Measure items used (MNSQ
Outfit, ZSTD, and Pt Measure Corr.) are similar to
those used in Person Fit and Person Measure (See
3.4 section on this article).
Table 5: Item misfit based on outfit MNSQ and outfit
ZSTD values.
No
Item
Outfit
Outfit
MNSQ
ZSTD
8
I feel that friends in
my workplace cannot
be invited to work
together
2.55
9.9
7
Before
work, my mind
was hard
to focus on
work
1.93
9.9
13
With the rewards I get
right now I feel no
need to work any
better
1.82
9.9
18
I do not believe that I
can work any better
1.78
9.7
Based on Table 5 above, it is known that 4 items
from 25 items of SKS are misfit and outlier items.
The items in question cannot be used in the
measurement because they cannot produce
meaningful information to measure employment
morale. This is confirmed from the range of Outfit
MNSQ and Outfit ZSTD values that exceed the
specified criterion of measurement criteria.
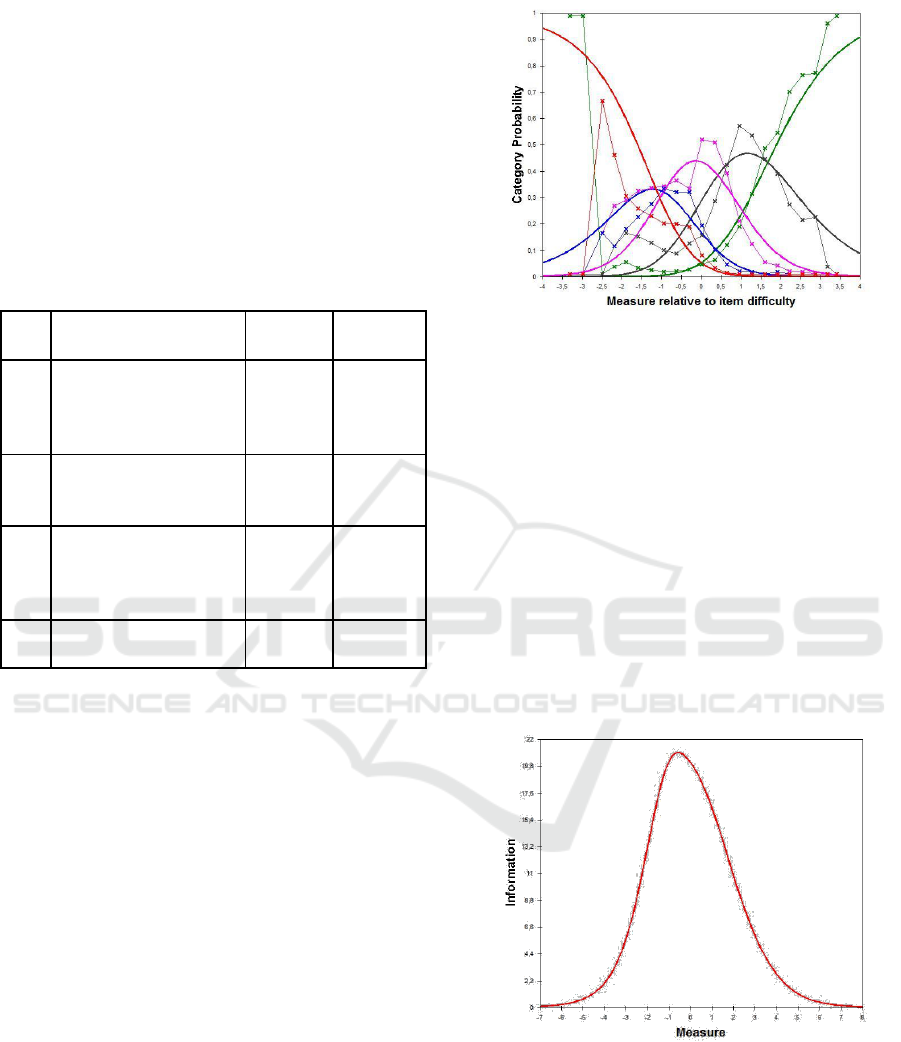
To illustrate how the misfit conditions in the
SKS instrument items can be seen in Figure 3.
Ideally, the dotted line will follow the pattern on the
straight line of the normal curve. Dotted lines that
stray away from straight line patterns indicate there
is a particular problem.
Figure 3: Data-based relative frequencies of categories in
each interval along the latent variable.
Further, item measure is an estimate for
determining items that have a certain degree of
complexity in the SKS. The most difficult item to be
approved by all respondents is item No. 24, "I get
irritable when my work is not done"; and the easiest
to approve is item no 5 "There is a sense of
satisfaction in my heart if the work I do is done on
time".
3.6 Test Information Function
Estimated test information function aims to
determine the amount of information that can be
produced by the SKS instrument.
Figure 4: Distribution of test information function of SKS.
In Figure 4 it is known that the SKS instrument
only works optimally on the respondents who have a
moderate spirit of work.
The Validation of the Sierra Kappa Scale (SKS)
139

4 CONCLUSIONS
Estimation and measurement of properties contained
in the SKS shows that in general the SKS is an
instrument that meets the requirements to measure
the spirit of work in the work. To get maximum
measurement result from SKS, SKS users need to
eliminate 4 items from SKS, namely item No. 8, 7,
13, and 18 because of misfit indicated. Thus, there
are only 21 items that meet the maximum
measurement requirements.
Furthermore, it is necessary to consider the
preparedness and seriousness aspect of the
respondents in administering the SKS. The
respondents need to be given sufficient information
related to the SKS before the respondents do the
filling SKS.
ACKNOWLEDGEMENTS
We thanks to the volunteers who helped disseminate
this SKS through social media, e-mail and other
online networks. We also express our great
appreciation to Mrs. Maria Oktasari, and Hayu
Stevani who have helped the preparation of this
instrument.
REFERENCES
Agusta, L., 2013. Pengaruh pelatihan dan motivasi kerja
terhadap kinerja karyawan CV Haragon Surabaya,
Agora, 1(3), pp. 1399–1408.
Allouche, O, Tsoar, A., Kadmon, R., 2006. Assessing the
accuracy of species distribution models: prevalence,
kappa and the true skills statistic (TSS), Journal of
Applied Ecology. Vol. 43, p.1223-1234.
Anderson, A., Stockton, L., 2001. Snakes Versus Ladders:
A Validation of Laddering Technique as a Measure of
Hierarchical Structure, Journal of Constructivist
Psychology, Vol. 14, No. 2, pp. 85-105.
Aryani, D., Rosinta, F., 2011. Pengaruh kualitas layanan
terhadap kepuasan pelanggan dalam membentuk
loyalitas pelanggan, BISNIS and BIROKRASI: Jurnal
Ilmu Administrasi dan Organisasi, 17(2).
Azwar, S., 1999. Skala Penyusunan Psikologi, Pustaka
Pelajar. Yogyakarta.
Bond, T. G., Christine M. Fox. 2015. Applying the Rasch
Model Fundamental Measurement in the Human
Sciences, Routledge Taylor and Francis Group. New
York, Third Edition.
Brahmasari, I. A., Suprayetno, A., 2009. Pengaruh
motivasi kerja, kepemimpinan dan budaya organisasi
terhadap kepuasan kerja karyawan serta dampaknya
pada kinerja perusahaan (Studi kasus pada PT. Pei Hai
International Wiratama Indonesia), Jurnal Manajemen
dan kewirausahaan, 10(2), p. pp-124.
Campbell, J. P., 2002. Modelling the Performance
Prediction Problem in Industrial and Organizational
Psychology, Handbook of Industrial and Organization
psychology, Jaico Publishing House. Mumbai.
Chuang, F. S., 2013. Essential skills for leadership
effectiveness in diverse workplace development,
Online Journal for Workplace Education and
Development. Vol. 6. No. 1, p. 1-23
Goncalves, M., 2013. Leadership style: The Power to
influence others’ in Journal of Business and Social
Science. Vol. 4 No. 4, p. 1-3.
Kinjerski, V., 2013. The spirit at work scale: Developing
and validating a measure of individual spirituality at
work, in Handbook of Faith and Spirituality in the
Workplace. Springer, pp. 383– 402.
Kinjerski, V., Skrypnek, B. J., 2006. Measuring the
Intangible: Development of the Spirit at Work Scale, in
Academy of management proceedings. Academy of
Management, pp. A1–A6.
Locke, E. A., Latham, G. P., 1990. Work motivation and
satisfaction: Light at the end of the tunnel,
Psychological Science, 1(4), 240–246.
Mangkunegara, A. P., 2005. Evaluasi Kinerja, Refika
Aditama. Bandung.
Obiwuru T. C, Okwu, A. T, Akpa, V. O., Nwankwere, I.
A., 2011. Effect of leadership style on organizational
performance: A survery of selected small-scale
enterprises in ikosi-ketu council development area of
lagos state, Nigeria, Australian Journal of Business
and Management Research. Vol. 1 No. 7, p.100-110).
Rangka, I. B., 2017. Profil Perencanaan Karir Siswa
Sekolah Menengah Kejuruan dengan Pemodelan Rasch
Berdasarkan Jenis Kelamin, Konselor, 6(2), pp. 39–48.
Riyadi, S., 2011. Pengaruh kompensasi finansial, gaya
kepemimpinan, dan motivasi kerja terhadap kinerja
karyawan pada perusahaan manufaktur di Jawa Timur,
Jurnal manajemen dan kewirausahaan, 13(1), pp. 40–
45.
Sri Mendari, A., 2013. Aplikasi teori hierarki kebutuhan
Maslow dalam meningkatkan motivasi belajar
mahasiswa, Widya warta, 34(1).
Sudrajat, A., 2008. Teori-teori motivasi, Available at
http://akhmadsudrajat. wordpress.
com/2008/02/06/teori-teori motivasi [diakses di
Bandung: 9 Oktober 2012].
Sumintono, B., Widhiarso, W., 2014. Aplikasi model
Rasch untuk penelitian ilmu-ilmu sosial (edisi revisi).
Trim Komunikata Publishing House.
Sumintono, B., Widhiarso, W., 2015. Aplikasi pemodelan
rasch pada assessment pendidikan. Trim Komunikata.
Susanty, A., Baskoro, S. W., 2013. Pengaruh Motivasi
Kerja dan Gaya Kepemimpinan terhadap Disiplin
Kerja Serta Dampaknya pada Kinerja Karyawan studi
ANCOSH 2018 - Annual Conference on Social Sciences and Humanities
140

Kasus pada PT. PLN (Persero) Apd Semarang),
J@ TI UNDIP: JURNAL TEKNIK INDUSTRI, 7(2),
pp. 77–84.
Warrens, J. M., 2013. A comparison of the cohen’s kappa
and agreement coefisients by corrrado gini,
International Journal of Recent Research and Applied
Studies. Vol. 16. No. 3, p.345-351.
The Validation of the Sierra Kappa Scale (SKS)
141
