
Effect of Profitability, Growth of Sale, Size of Firm on Dividend
Policy and Automotive Sector Sub in Part in 2012-2016
Ida Nuryana
Faculty of Economics and Business, Universitas Kanjuruhan Malang, Malang, Indonesia
mediaidafeb@unikama.co.id
Keywords: Profitability, growth of sale size of firm.
Abstract: The results in this study are based on the formulation of the problem is how the effect of profitability, growth
of sale, size of firm to dividend policy in the automotive and component sub-sector in 2012-2016. The main
objective of this study was to determine the effect of profitability, growth of sale, size of firm to dividend
policy in the automotive and components sub-sector in 2012-2016. The method used in this research is
quantitative. This method is used to determine the effect of one variable with another variable. The instrument
used was secondary data as well as to analyze the data used multiple linear regression. Based on the results it
can be concluded that there are significant profitability, growth of sale to dividend policy.
1 INTRODUCTION
The Company is a body set up by an individual or
institution with the primary purpose is to gain,
another goal is no less important that it can continue
to survive in the competition. Management in an
enterprise has an important role in carrying out the
responsibilities that have been received, one of which
is keeping the loyalty or trust of investors to remain
invested in the company. Investment is an investment
directly or indirectly, short term and long term, with
the purpose of profits or expected benefits or other
forms of benefits as a result of the investment itself,
briefly Investment is giving wealth to be managed by
a company in hopes of getting a high dividend,
Dividend policy is often regarded as a signal to
investors in assessing the merits of the company. This
is due to the dividend policy can take effect on stock
prices of companies. Dividend policy is also one of
the factors that affect the value of the company,
basically the company's value is measured from
several aspects, one of which is the market price sahar
firms. Because the company's market price reflects
investors' assessment of the overall equity held.
Companies with relatively stable dividend will be
attractive to investors, so that demand for stocks will
rise and stock prices will also rise. This is because
investors take into account the investment income
that will be obtained later.
Nursandari (2015), Hanafi (2004) Determination
of the dividend policy is influenced by factors that are
differentiated into two groups, namely financial
factors that include growth prospects, cost of capital,
profitability, corporate funding needs, liquidity,
ability to borrow, debt repayment needs, the stability
of the dividend and the expansion rate of assets and
non-financial factors which include tax laws, debt
covenant restrictions, capital market opportunities,
company, the position of shareholders as taxpayers.
In other words, the greater the benefits the greater the
company's ability to pay dividends. Determination of
which are influenced by the profitability is to measure
the ratio of the Traffic company makes a profit in
relation to sales, total assets and total itself, this ratio
is considered by prospective investors and
shareholders as it relates to the stock price and the
dividend will be accepted. One measure that is often
used is the return on assets (ROA),
According Santika and Kusuma (2002) the effect
of profitability as an indicator of the company's
performance a positive influence on the company.
Due to the improved performance of the company
will increase the ROA and ROE. Goddess (2008),
Marpaung and Hardianto (2009) in this study, the
influence profitability to dividend policy, while
according Meilina (2013) profitability does not have
an influence on dividend policy.
544
Nuryana, I.
Effect of Profitability, Growth of Sale, Size of Firm on Dividend Policy and Automotive Sector Sub in Part in 2012-2016.
In Proceedings of the Annual Conference on Social Sciences and Humanities (ANCOSH 2018) - Revitalization of Local Wisdom in Global and Competitive Era, pages 544-555
ISBN: 978-989-758-343-8
Copyright © 2018 by SCITEPRESS – Science and Technology Publications, Lda. All rights reserved

2 LITERATURE REVIEW
Martono and Harjito (2005) defines the dividend
policy (dividend policy) is a decision whether the
profits obtained at the end of the year the company
will be distributed to shareholders in the form of
dividends or be retained to increase the capital used
to finance investment in the future. The dividend
payout ratio (dividend payout ratio) determine the
amount of profit to be shared in the form of cash
dividends and retained earnings as a source of
funding. The dividend payout ratio indicates the
percentage of corporate profits paid out to
shareholders in the form of dividends.
The amount of the dividend depends on the
dividend policy of each company. According Suharli
(2006), in general, adopted dividend policy the
company is one of these policies, namely:
• Constant dividend payout ratio, there are several
ways set the dividend payout ratio that is
distributed permanently in a specific percentage
or ratio, namely:
(1) pay the amount fixed percentage of annual
income,
(2) determining the dividend to be given in a
year is equal to the amount fixed percentage
of profit the previous year, and
(3) determine the projected payout ratio for the
long term.
• Stable per share dividend.
2.1 Policies that Determine the Amount
of Dividends in the Fixed Amount
This policy shows the company to maintain high
profits.
2.1.1 Profitability
Profitability ratio is the ratio to assess the company's
ability to make a profit Kashmir (2010). This ratio
also provides a measure of the effectiveness of
management of a company. This is demonstrated by
the make profit from sales and investment income.
One of the profitability ratio is the ratio of earnings
per share (Earning Per Share) or also known as book
value ratio. Simamora (2012) profitability can be
measured in terms of absolute rupiah, such as net
income, or based on the ratio. Analysis of profitability
(profitability analysis) consists of tests conducted to
evaluate the performance of a particular company's
profit for the year. The results are then combined with
other data in order to potential earnings power of the
company, which is considered important for the
managers, creditors, and shareholders for the long
term the company must operate with a satisfactory
profit in order to stay alive. Significant earnings
capacity also for other financial statement users, such
as suppliers and unions, who are interested in
fostering sustainable relationships with companies
that are financially healthy.
2.1.2 Growth of Sale (Sales Growth)
According Kesuma (2009), sales growth (growth of
sales) is an increase in sales from year to year or from
time to time. Companies that have high sales growth
rates will require more investment in different
elements of the assets, either fixed assets or current
assets. The management need to consider the
appropriate funding source for the asset purchases.
Companies that have high sales growth will be able
to meet its financial obligations if the company
finance its assets with debt, and vice versa. According
to (Riyanto, 2001), the growth of the company is one
of the factors that affect dividend policy. The faster
the growth rate of a company, the greater the need for
the necessary funds to finance the company's growth.
The greater the funding needs for the foreseeable
future, the company is more than happy to hold the
profits from the pay it as dividends to shareholders.
2.1.3 Size of Firm (Company Size)
Brigham and Houston (2001), the size of the company
is the average total net sales for the year to several
years. In this case the sale is greater than the variable
costs and fixed costs, it will obtain the amount of
income before taxes otherwise if the sale is smaller
than the variable costs and fixed costs.
2.2 Overview of Empirical
2.2.1 Effect of Profitability on Dividend
Policy
Goddess (2008) Profitability negatively affect
dividend policy, if a company has a high income will
be used for operations or for investments that will
reduce the distribution of dividends. Marpaung and
hardianto (2009) had a negative effect on the
profitability of the dividend policy, the higher the
profit earned by the company then used for operations
so that dividends received by investors is low. Hayati
(2013) profitability has a positive effect dividend
policy by using ROA (Return on Assets) explains that
the level of corporate profitability will have an impact
on increasing the dividend by the company.
Effect of Profitability, Growth of Sale, Size of Firm on Dividend Policy and Automotive Sector Sub in Part in 2012-2016
545
2.2.2 Effect of Sale Growth on Dividend
Policy
Darminto (2007), the company has a sales growth rate
higher, tend to use the loan capital that is more than
the company whose growth rate is low. The higher
level of sales growth of the company, the greater the
use of loan capital which means it should provide the
funds to repay the loan principal and the interest,
which in turn reduces the amount of dividend per
share (DPS).
Laksono (2006) growth of sale have the positive
impact on the dividend policy because when the
company experienced growth in sales is high enough,
then the revenue to be received by the company will
increase and distribution of dividends to be received
by a larger investor.
Clarensia, and Azizah Rahayu (2011) said sales
growth had a negative effect on the dividend policy
for when sales of the company increased the revenue
generated will be used to finance the company, so that
dividends received by investors is low.
2.2.3 Effect Size of Firm on Dividend Policy
Goddess (2008) size of the firm have a positive
impact on the dividend policy. When the assets of the
company published on the Indonesian stock exchange
increases, the dividend will be given to high investor.
This indicates that the dividend policy is very
important for investors because in improving their
economy, companies are expected to provide high
dividends.
Wisdom and Astuti (2013) size of the firm have a
positive impact on the dividend policy, if the size of
the company has resulted in an increase in the number
of high dividend. As expected by investors when
investing to the company, when a manager does a
high dividend, investors would believe the company
is in the prosperity of their economies.
Hatta (2002) and Nuringsih (2005) states the size
of the firm have a positive impact on the dividend
policy. Companies that have large assets tend to pay
a large dividend to shareholders to maintain the
reputation among investors.
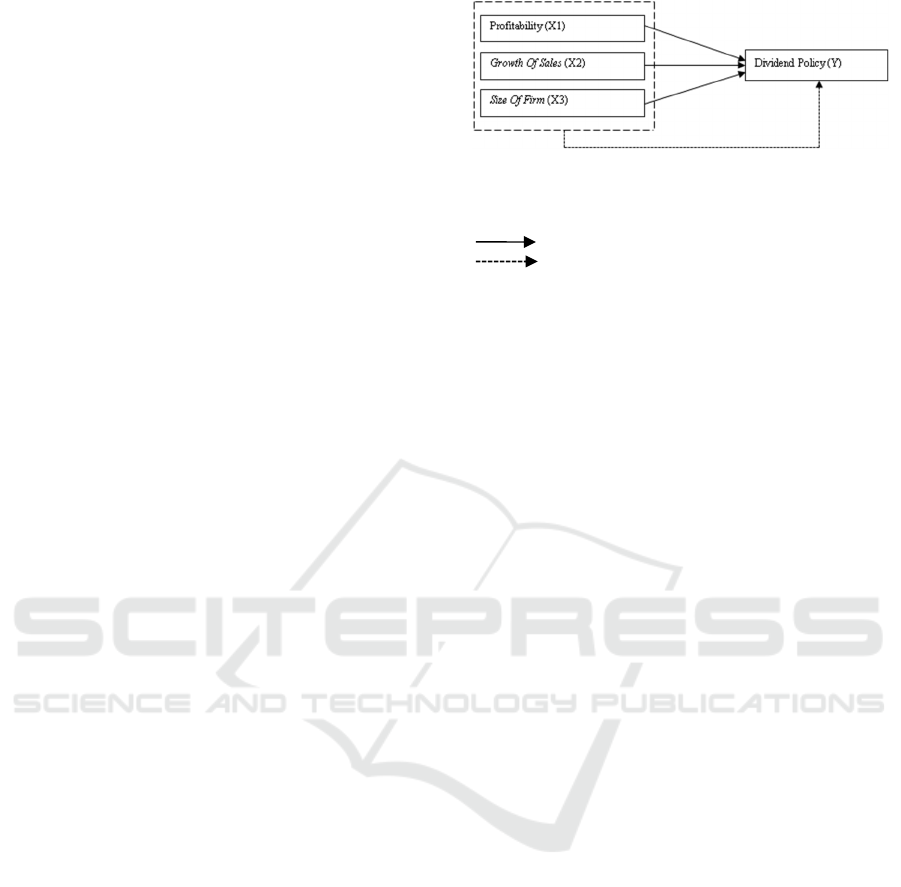
2.3 Conceptual Framework
Based on the theory and the results of previous studies
conducted by several researcher, the conceptual
framework in this study are as follows:
Information:
X1 : profitability
X2 : Growth of Sales
X3 : Size of Firm
: Effect of Partial
: Effect of Simultaneous
Figure 1: Effect of profitability, growth of sale size of firm
against dividend policy on automotive and parts subsector
year 2012-2015.
2.4 Hypothesis
Sugiono (2013) hypothesis is a temporary answer to
the formulation of research problems, where the
formulation of research problems has been expressed
in the form of questions. Is said to be temporary
because a new answer given is based on the theory.
H1 : Profitability, Growth of sale, Size of firm
influence simultaneously to dividend policy.
H2 : There are currently no influence on the
profitability of the dividend policy.
H3 : Influences of Growth of sale to dividend
policy.
H4 : Influences of the Size of the firm to dividend
policy.
3 RESEARCH METHODS
The research is descriptive research with quantitative
approach that is by analyzing the Financial
Statements, which are categorized on autos and parts
subsector. It said quantitative approach because the
data used is empirical data and variables used have
units that can be measured. This study contained in
the Financial Statements published by
www.idx.co.id. in the period 2012-2016.
3.1 The Scope of Research
The scope of the research aims to avoid discussion
widespread or deviate from the desired purpose and
more focused then the problem will be addressed in
this study is limited to the profitability growth of sale
size of firm to dividend policy on autos and parts
subsector years 2012-2016.
ANCOSH 2018 - Annual Conference on Social Sciences and Humanities
546

3.2 Population and Sample
The population in this study are automotive
companies and component listing on the Indonesian
Stock Exchange (BEI). The population found in the
automotive and component sub-sectors, namely 40
companies but listed on the Indonesia Stock
Exchange (IDX) 14 companies while still active with
11 companies. The criteria used in this study are:
• The company has been listed on the Stock
Exchange during the period of 2012-2016.
• The company publishes the financial statements
for 2012-2016
• The company paid dividends in 2012-2016.
• Based on the above criteria, then there are 7
companies that meet the criteria:
Table 1: Issuer name and part automotive subsector
in Indonesia stock exchange.
No. Issuer name
stock
code
Year DPR
1
Astra
International
Tbk
ASII
2012 0.317
2013 0.314
2014 .450
2015 .450
2016 .456
2 Astra Otoparts AUTO
2012 0.676
2013 0.423
2014 0.295
2015 0.505
2016 0,531
3
Indo Kordsa
Tbk d, h Branta
Mulia Tbk
BRAM
2012 .419
2013 0,833
2014 0.361
2015 .570
2016 0.262
4
Goodyear
Indonesia Tbk
GDYR
2012 0,848
2013 0,005
2014 0,017
2015 0.198
2016 0.361
5
Gajah Tunggal
Tbk
GJTL
2012 0,050
2013 0.051
2014 0.083
2015 .290
2016 0.129
6 Indospring Tbk INDS
2012 0,001
2013 .290
2014 .116
2015 .182
2016 0.383
7
Congratulations
Perfect Tbk
SMSM
2012 0.529
2013 0.714
2014 .429
2015 0.655
2016 0,427
3.3 Operational Definition
3.3.1 Dividend Policy (Y)
Dividend policy is a decision whether the profits
obtained at the end of the year the company will be
distributed to shareholders in the form of dividends or
be retained to increase the capital used to finance
investment in the future, the dividend policy is
measured using indicators dividend payout ratio.
3.3.2 Profitability (X1)
Profitability ratio is the ratio to assess the company's
ability to make a profit, the ratio of profitability
measurement using return on assets (ROA).
3.3.3 Growth of sale (X2)
Sales growth (growth of sales) is an increase in sales
from year to year or from time to time, indicator
measurement using current year net sales divided by
net sales of the previous year.
3.3.4 Size of Firm (X3)
The size of the company is the average total net sales
for the year to several years Measurement using the
natural logarithm of total assets.
3.4 Data Types
The data source is an important factor to be
considered in determining the methods of data
collection, data source or type of data consists of
primary data and secondary data.
3.4.1 Secondary Data
Secondary data is data obtained or collected by the
person who conducted the research from sources that
already exist (Hasan 2002), this data is used to
support the primary information that has been
obtained is of material prior research literature library
books and so forth.
The data used in this research is secondary data
such as financial report company Composite Stock
Price Index number of shares traded and the number
of shares of manufacturing industry (sub-sectors of
the automotive and components) in circulation, data
the company obtained from the Indonesia Stock
Exchange that are in the network namely
internetwww.idx.co.id.
Effect of Profitability, Growth of Sale, Size of Firm on Dividend Policy and Automotive Sector Sub in Part in 2012-2016
547
3.5 Data Collection
The data collection methods used by the researchers
in this study is documentation, documentation
method is a collection of data that comes from a
written source in the form of financial statement data
autos and parts subsector of the year 2012-2016.
3.6 Data Analysis
The analysis technique used to identify independent
variables affect the dependent variable used multiple
linear regression equation, the dependent variable
(dependent variables) in this study is the dividend
policy and as an independent variable (independent
variable) is Profitability Growth of sale size of firm.
3.6.1 Indicators Measuring the Variables X
and Y
• Dividend Policy (Y)
Dividend policy is measured using indicators
dividend payout ratio,
DPR =
• Profitability (X1)
Using measurements (return on assets / ROA)
• Growth of Sale (X2)
Measuring the level of sales growth the
company used the formula:
Where:
GS: Growth of Sale
St: net sales year-to t
St-1: Net sales year-to t-1
• Size of Firm (X3)
Measure size of firm using the natural logarithm
of total assets,
Size of company (Size) = Ln (Total Assets)
3.6.2 Descriptive Analysis
According Sugiyono (2013) descriptive analysis are
statistics used to analyze the data in a way to describe
or depict the data that has been collected as it is
without the intention of making conclusions apply to
the public or generalization, analysis descriptive
statistics has the objective to determine a general
overview of all the variables used in this study by
looking at the table of descriptive statistics.
• Classic Assumption Testing
The use of classic assumption test aims to
identify and test the feasibility of the regression
model used in this study, other goal to ensure
that in the regression model used have normally
distributed data free of autocorrelation
multikolinieritas and heterokedistisitas.
• Normality Test
Data normality test aims to test whether the
regression model independent variables and the
dependent variable has a normal distribution and
no, good regression model is to have the data
distribution is normal or nearly normal Ghozali
(2005) to test the normality of the data can be
done in two ways first by see graph normal
probability plot basis for a decision on the
graphic display normal probability plots
referring to Ghozali (2005), namely:
1) If the data (point) spread around the
diagonal line and follow the direction of
the diagonal line indicating a normal
distribution pattern so that the regression
model can meet the assumptions of
normality,
2) If the data (point) spread far from the
diagonal line and or do not follow the
direction of the diagonal line means do not
show a normal distribution pattern so that
the regression model did not meet the
assumptions of normality, the normality
test other better is by using statistical
analysis.
• Heterokedastisitas Test
Heterokedastisitas test aims to test whether the
regression occurred inequality residual variance
from one observation to another, if the variance
of the residuals of the observations to other
observations still called homokedastisitas,
• Multicoloniarity Test
The purpose of the test multicoloniarity is to test
whether the regression model has a correlation
between independent variables, multicoloniarity
occur if there is a linear relationship between the
independent who engage in the model, if there
is a phenomenon multicoloniarity is high then
the standard error of regression coefficients will
be even greater as a result confidence internal
for estimating parameters of increasingly width,
test multicoloniarity is done by regressing
ANCOSH 2018 - Annual Conference on Social Sciences and Humanities
548

analysis models and test the correlation between
the independent variables using variance
inflation factor (VIF), limit (cut off) from VIF>
0 and the value of tolerance if VIF is greater than
10 and the value of tolerance is less than 0 , 10
and collinearity level of more than 0.95 then
there multicoloniarity (Ghozali2005).
• Autocorrelation Test
Test the third in assuming further test the
autocorrelation test autocorrelation occurs when
there is a deviation of an observation by
irregularities another or occur correlations
between observe according to time and place,
the consequences of a correlation in a regression
model is a variable not using not describe the
variable population further again, there are
several ways that can be used to detect the
presence of autocorrelation one with test
dusbinwaston (DW-test), test Dusbin-Waston
only used for autocorrelation level one (first-
order autocorrelation) and requires constant or
intercept in the regression model, and no more
variable between the independent variables
(Ghozali2005).
0 <DW <dl : Happen autocorrelation
dl ≤ DW ≤ du : Can not concluded
du <DW <4-du : No autocorrelation
4-du ≤ DW ≤ 4-dl : Can not concluded
4-dl <d <4 : There autocorrelation
Information:
DL : The lower limit of DW
DU : The upper limit of DW
3.6.3 Linear Regression Analysis
Multiple regression analysis is used to determine the
effect of free variables in influencing the dependent
variable is jointly or partially, with a multiple linear
regression equation in this study are:
Y = β1X1 + β2X2 + β3X3 + ε
Information:
Y : Dividend Policy
X1: Profitability
X2: Growth of sale
X3: Size of firm
1) Test Statistic F (Simultaneous Testing)
The statistical test F basically indicates whether
all the independent variables included in the
model have influence together on the dependent
variable (Ghozali2005), F test used to determine
whether the independent variable (X)
simultaneously significant effect on the
dependent variable (Y), criteria decision-
making, namely:
• If significant value F <0.05, then the
independent variables significantly
influence the dependent variable.
• If a significant F value> 0.05, no significant
effect of independent variables on the
dependent variable.
2) Coefficient of Determination
The coefficient of determination (R2) to
measure how far the ability of the model to
explain variations in the dependent variable
(Ghozali 2005), Rated R ² have the interval
between 0 and 1, greater ² (close to 1), the better
the results for the model regression and getting
closer to 0, then the independent variable overall
unable to explain the dependent variable
(Ghozali 2005), the R2 small means the ability
of these variables in explaining the dependent
variable is very limited, value close to 1 means
that the independent variables give all the
information needed to predict the variation of
the dependent variable (Ghozali 2005 ).
3) Statistic t test (Test Partial)
The statistical test t basically shows how far the
influence of the independent variables
individually in explaining the variation of the
dependent variable (Ghozali2005), t test
(partial) conducted to test the effect of
independent variables individually or partially
independent variable on the dependent variable.
• If the value is significantly t≤0,05 the
independent variables significantly
influence the independent variables.
If significant value t ≥ 0.05, independent variables
did not significantly affect the independent variables.
4 RESEARCH RESULT
4.1 Description Data
4.1.1 Profitability
Profitability is the ability of the company makes a
profit in relation to total sales of assets or equity
capital thus for long-term investors would be very
concerned with this profitability analysis. While ROA
is a profitability ratio that can demonstrate the ability
of the company makes a profit. Based on the results
of the data obtained by researchers showed
Profitability amount collected from 7 companies as
samples during the period 2012-2016.
Effect of Profitability, Growth of Sale, Size of Firm on Dividend Policy and Automotive Sector Sub in Part in 2012-2016
549

Table 2: Profitability.
No.
stock
code
2012 2013 2014 2015 2016 MEAN
1 ASII 10% 12% 14% 15% 11% 10%
2 AUTO 16% 13% 8% 17% 12% 9%
3 BRAM 12% 13% 2% 15% 4% 5%
4 GDYR 16% 5% 4% 2% 13% 8%
5 GJTL 6% 9% 1% 2% 2% 4%
6 INDS 11% 8% 7% 6% 4% 6%
7 SMSM 19% 19% 20% 24% 21% 21%
Average 12% 11% 8% 8% 7% 9%
Maximum 19% 19% 20% 24% 21% 21%
minimal 4% 5% 1% 2% 1% 4%
Source: Data processed.
Based on the above table shows in 2012-2016 the
company Astra International Tbk, Astra Otoparts
Indo Kordsa Tbk d, h Branta Mulia Tbk, Goodyear
Indonesia Tbk, Elephant Tunggal Tbk, Indospring
Tbk, Congratulations Perfect Tbk experience
fluctuations in profit every year. As happened in PT
Gajah Tunggal Tbk in 2012 they had a sufficient
profit lower than in 2013 and then decline very
sharply pointed out in 2014 with a total amount of 1%
means that the possibility of profit of the company.
4.1.2 Growth of Sale
Sales growth (Growth of Sale) an increase in sales
from year to year or from time to time, Based on the
results of the data obtained by researchers showed the
number of Growth of sale collected from 7 companies
as samples during the period 2012-2016.
Table 3: Value growth of sale.
No.
stock
code
2012 2013 2014 2015 2016 MEAN
1
ASII 13.981% 15.679% 13.099% 14.324% 8.679%
13.152%
2
AUTO 17.722% 10.410% 19.209% 14.515% 4.338%
13.239%
3
BRAM 5.254% 11.384% 45.856% 5.175% 17.294%
16.993%
4
GDYR 7.207% 9.137% 1.520% 16.218% 13.193%
9.455%
5
GJTL 20.170% 6.226% 17.094% 5.811% 7.689%
11.398%
6
INDS 2.378% 19.596% 15.265% 9.664% 11.113%
11.603%
7
SMSM 15.758% 19.689% 9.665% 10.951% 6.459%
12.505%
Avera
g
e 11.78% 13.16% 17.39% 10.95% 9.82% 12.621%
Maximum 20.170% 19.689% 45.856% 16.218% 17.294% 23.845%
minimal 2.378% 6.226% 1.520% 5.175% 4.338% 3.927%
Source: Data processed.
Based on these data can be seen in years 2012-
2015 the company Astra International Tbk, Astra
Otopart Tbk, Indo Kordsa Tbk dh Branta Mulia Tbk,
goodyear Indonesia Tbk, Elephant Tuggal Tbk,
Indospring tbk, Congratulations Perfect Tbk,
fluctuation in sales each year. Companies that
perform sales growth is higher than the profits to be
earned by the investor will be increased as well. As
indicated by the company PT Indospring Tbk, which
in 2012 had total sales of 2%, then in 2013 increased
by 19%, this indicates that the company is able to
operate funds properly, so that such behavior can
attract investors in investing in the company.
4.1.3 Size of Firm
Firm size (Size of firm) is the average TOTL net sales
for the year to several years. Based on the results of
ANCOSH 2018 - Annual Conference on Social Sciences and Humanities
550

the data obtained by researchers showed the number
of size of firm collected from 7 companies as samples
during the period 2012-2016.
Table 4: The total value of assets (in millions).
No.
stock
code
2012 2013 2014 2015 2016 MEAN
1 ASII
11,946,777 12,113,266 12,273,703 12,371,709 12,410,787
12,223,248
2 AUTO
15,756,297 15,999,497 163 506 094 16,481,413 16,478,501
45.64436
million
3 BRAM
14,322,399 14,614,572 14,891,494 15,159,417
15.26886
million
14,851,348
4 GDYR
16,481,905 13,996,381
14,124,876 14,260,642 14,374,447
14.64765
million
5 GJTL 16,262,554 16,370,393 16,546,675 16,590,776 16,678,254
16.48973
million
6 INDS 14,640,854 14,753,143 11,966,361 12,056,812 12,187,862 13,121,006
7 SMSM 13,943,778 14,180,989 14,346,787
14.37478
million
14,613,066
14.29188
million
MEAN 14,764,938 14,575,463 35,379,427 14,470,793 14,573,111 18,752,746
MAX 16,481,905 16,370,393 163 506 094 16,590,776 16,678,254 45,925,484
MIN 11,946,777 12,113,266 11,966,361 12,056,812 12,187,862 12,054,216
Source: Data processed.
Based on these data can be seen in the year 2012-
2016 the company Astra International Tbk, Astra
Otoparts Indo Kordsa Tbk dh Branta Mulia Tbk,
Goodyear Indonesia Tbk, Elephant Tuggal Tbk,
Indospring Tbk, Congratulations Perfect Tbk, the
Company had total assets were stable in the last 5
years as experienced in the company of PT. Astra
International Tbk PT. Gajah Tunggal Tbk, PT
Selamat Sempurna Tbk from all three companies that
have total assets higher in each year.
Based on the results of the data obtained by
researchers showed the amount of dividends collected
from 7 companies as samples during the period 2012-
2016
Table 5: Value Dividend Policy (DPR).
No. stock code 2012 2013 2014 2015 2016 Avera
g
e
1 ASII 0.317 0.314 .450 .450 .456 0,397
2 AUTO 0.468 0.423 0.295 0.405 0,531 .560
3 BRAM .419 0,833 0.361 .570 0.262 0.489
4 GDYR 0,848 0,005 0,017 0.198 0.361 0.286
5 GJTL 0,050 0.051 0.083 .290 0.129 0.121
6 INDS 0,0015 .290 .116 0,282 0.185 0.615
7 SMSM 0.529 0,071 .429 0.655 0,427 0,622
Average 0,462 .424 .393 0,579 .350 .441
Maximum 0.468 0,071 .116 0.382 0,531 0,622
minimal 0,001 0,005 0,017 0.198 0.129 0.121
Source: Data processed.
Based on the above data can be seen in the years
2012-2015 the company Astra International Tbk
Astra Otoparts Indo Kordsa Tbk dh Branta Mulia Tbk
Elephant Tuggal Perfect Tbk Congratulations to
distribute dividends to investors in accordance with
the decisions the company must pay attention to
profits from the company. As the company PT. Astra
International Tbk conduct a dividend every year with
a high enough value of other automotive companies.
Effect of Profitability, Growth of Sale, Size of Firm on Dividend Policy and Automotive Sector Sub in Part in 2012-2016
551
4.2
Analysis of Results
4.2.1 Classic Assumption Test
The use of classic assumption test aims to identify and
test the feasibility of the regression model used in this
research another aim to ensure that in the regression
model used have normally distributed data free of
autocorrelation multikolinieritas and
heterokedistisitas.
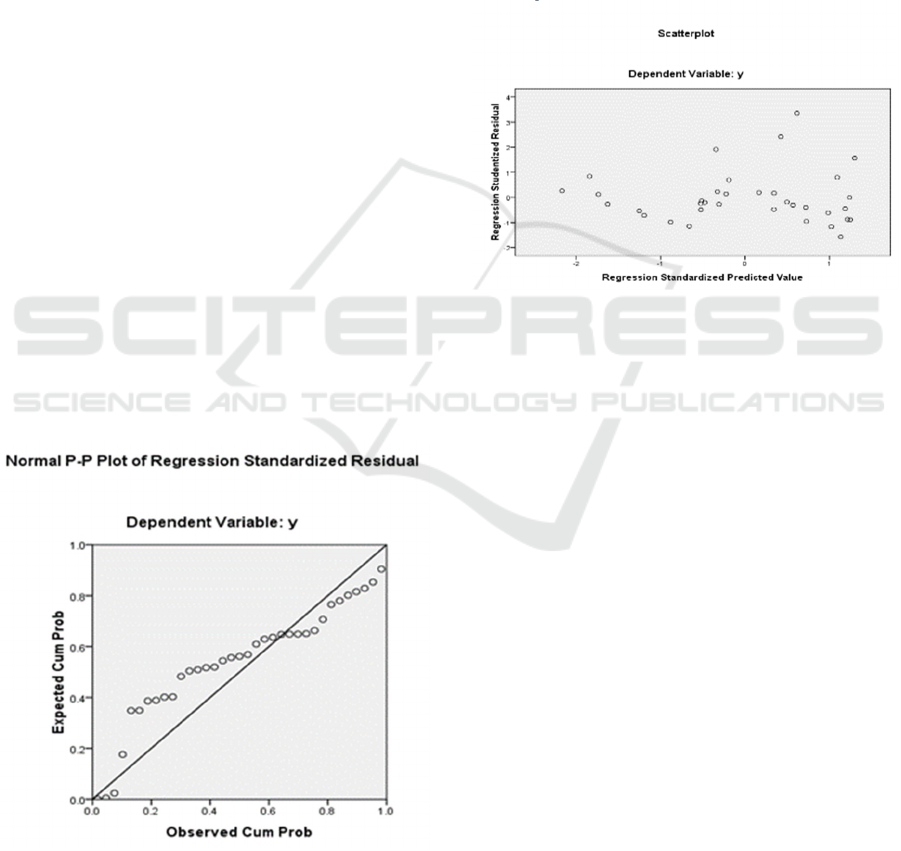
• Normality test
Data normality test aims to test whether the
regression model independent variables and the
dependent variable has a normal distribution and
no good regression model is to have the data
distribution is normal or nearly normal Ghozali
(2005), namely:
1) If the data (point) spread around the
diagonal line and follow the direction of
the diagonal line indicating a normal
distribution pattern so that the regression
model can meet the assumptions of
normality
2) If the data (point) spread far from the
diagonal line and or do not follow the
direction of the diagonal line means do not
show a normal distribution pattern so that
the regression model did not meet the
assumptions of normality Testing
normality else better to do is to use
statistical analysis.
Figure 2: The test result data normality.
In the image-probability plot shows that
the dots are still spread around the diagonal
line and its distribution follows the diagonal
line. So the graph shows that the regression
model of distributed normality.
• Heterokedastisitas test
Heteroskedastisitas testing is done by using the
scatterplot between standardized predictive
values (ZPRED) with a standardized residual
value (SRESID). This test is to determine
whether there is a relationship between
independent variables with residual value. Tests
on the classical assumption shows that there is
no heteroskedastisity this scatter plot shown in
Figure 3.
Figure 3: Scatter plots.
In the picture distribution or plot in the
scatterplot can be spread and does not form a
specific pattern above zero and below zero in the
residual studetized axis or Y axis and the right
hand and the left axis of standardized predicted
value.
• Multicoloniarity test
Multicolinierity test is used to determine
whether there is a high correlation between
independent variables. Multikolinieritas testing
is done by using the value of tolerance value or
Varian Inflation Factor (VIF) are shown in
Table 4.5. Based on the test results indicate
multikolinieritas tolerancenya value less than
0.10 but VIF value no greater than 10 so that it
can be concluded that there is no
multicollinearity.
• Autocorrelation test
Autocorrelation test is performed to determine
whether the linear regression model is no
correlation between bullies error in period t with
bullies error in period t-1 (previous). To detect
the presence or absence of auto correlation in
this study used the Durbin-Watson test (DW
Test). The analysis showed a value of 1.971 DW
that are shown in Table 4.5 to the amount of data
ANCOSH 2018 - Annual Conference on Social Sciences and Humanities
552
(n) 35 and the Durbin-Watson table with a 0.05
earned value dU 1.6528 and dL by 1.2833. DW
count value is between 0 and dL (1.2833) so that
it can be concluded not happen autokolerasi can
be seen intable 4:15.
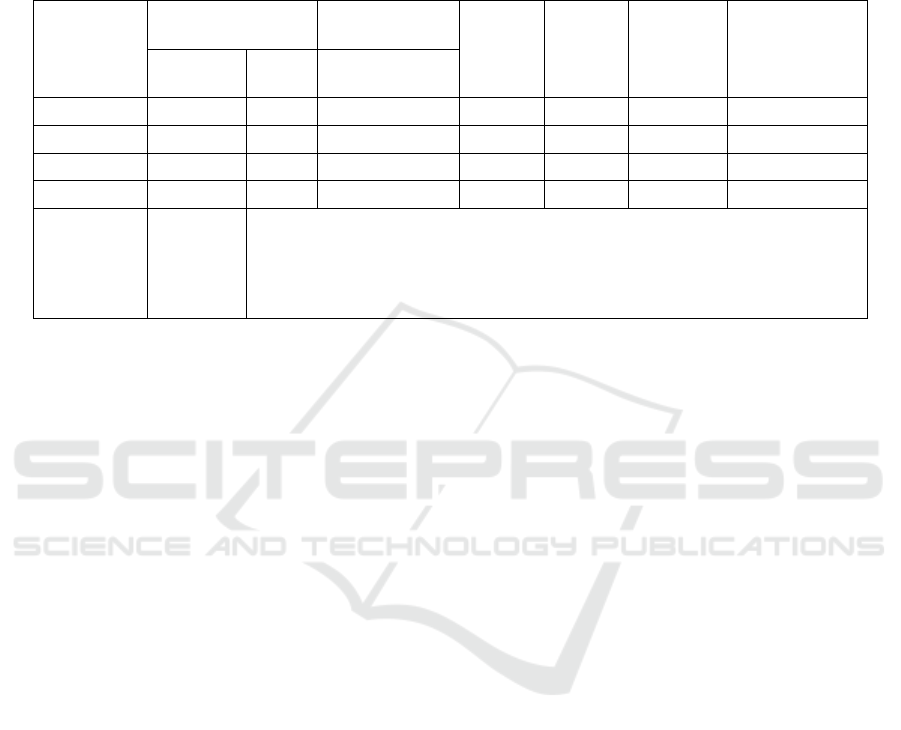
4.2.2 Regression Analysis
The results of the data interpretation can be seen in
table 6 below.
Table 6: Summary of regression.
Coefficients
unstandardize
d
standardized
Coefficients
t Si
g
. VIF InformationB
Std.
Erro
r
b
eta
(Constant) 1,456 2.192 .664 0.511
p
rofit 0.695 .294 0,363 2,350 0,025 1,915 significant
g
rowth 1,406 .417 0.512 3,370 0,002 1,946 si
g
nificant
size 0,145 0.151 .510 0.963 0.343 1,896 no si
g
nificant
R2
FHI
Sig F
DW
0.324
4.942
0,006
1,971
Source: Data processed.
Indicate that the data used in this study did not
experience problems heterocedasticity
multicoloniarity and autocorrelation data used are
also normally distributed. Data from the classical
assumption test results are qualified to do multiple
regression analysis and hypothesis testing. Multiple
regression equation can be done by interpreting the
figures into corresponding unstandardized beta
coefficients in Table 6.
• Test F (Simultaneous)
Test F (Simultaneous)is used to indicate
whether all the independent variables or free
inclusion in the model have jointly influence on
the dependent variable, or tied. In Table 4.5
explains the results of the F test (simultaneous
test) independent variables showed that
profitability. Growth of sale. Size of firm
simultaneously significant effect on dividend
policy. It is shown from the calculated F value
of4.942 with a probability of 0.006 where the
probability value less than 0.05 in order to take
decisions that simultaneously independent
variables affect the dividend policy.
• Coefficient of Determination
The coefficient of determination used to
measure how far the ability of the model and
explain variations in the independent variable.
The greater the coefficient of determination
showed the greater variation in the independent
variable causes the dependent variable.
Statistical data processing result can be seen
from Table 4.5. Based on the output from the
coefficient of determination (R2) has the R
value of 0.324 Squarely which means that the
ability of independent variables are profitability,
growth of sale, size of firm to explain the
magnitude of the variation in the dependent
variable (dependent) is the dividend policy of
32.4 percent.
• T test (Partial)
T test (partial) is used to indicate how much
influence each of the independent variables are
profitability, growth of sale, size of firm to
dividend policy.
T-test, it can be interpreted in terms of the
following:
a) Profitability analysis of the results showed
the value of t count equal to 2,350with a
probability level indicated by the sig 0.025
ketch more than 0.05, it can be a decision
that profitability has an influence on a
positive dividend policy.
b) Results of growth analysis showed that the
value of t count equal 3,370 with the
probability level indicated by sig. 0.002
less than 0.05 then the decision could be
made that the growthhave a positive
impact on the dividend policy.
c) Results Size analysis showed that the value
of t count equal0.712 with a degree of
probability shown by sig. amounted to
0.343 greater than 0.05, it can be a decision
Effect of Profitability, Growth of Sale, Size of Firm on Dividend Policy and Automotive Sector Sub in Part in 2012-2016
553

that Size negative influence or no
influence on dividend policy.
• Multiple Regression Equations
Based on table 4.5 above by showing the
numbers that are in the Beta Unstandardized
column it can be arranged multiple
regression equation as follows:
Y = 1,456 + 0,690X1 + 1,690X2 + 0,145X3
5 DISCUSSION
5.1 Effect of Profitability, Growth of
Sale Size of Firm against
Simultaneous Dividend Policy
This study aims to determine the effect of
profitability, growth of sale, size of firm
simultaneously to dividend policy. Based on the
analysis, it is known that the regression analysis
resulted in an adjusted R² of 0.324. This indicates that
the dividend policy can be explained by Profitability,
Growth of sale, size of firm with a rate of return of
32.4% while the rest influenced by other factors.
These results indicate that a significant F count of
0,006 is smaller than the probability of 0.05 so it can
be concluded profitability, growth of sale, size of firm
have a positive impact on the dividend policy.
5.2 Profitability Influence on Dividend
Policy
Profitability be the size of the company in profit. The
ratio of measurement used in measuring profitability
is using ROA which serves as a means of measuring
profitability, profitability as well as to obtain benefits,
when profitability is high then affect the distribution
of dividends to investors is also high, but did not rule
out that the dividend that will be provided will be low
or the company does not distribute dividends, this
alone Because earnings may be held or distributed, if
profits were being held normally companies use these
funds as additional operational costs by considering
profit in the future and if the higher will affect the
distribution of dividends.
5.3 Effect of Growth of Sale on
Dividend Policy
Sales growth (Growth of Sale) companies determine
how much the company is able to sell the products
they have, so that when the company was able to
increase sales in any year then the company is able to
manage the existing product to predict future trends.
5.4 Effect of Size of Firm on Dividend
Policy
Company size (size of firm) views of how much total
assets of acquired companies, the development of a
firm course with a capital / asset while the asset can
be obtained from their own capital or debt, if the
company does not distribute dividends to investors
the possibility of companies use as the financing of
debt repayment.
6 CONCLUSIONS AND
SUGGESTIONS
6.1 Conclusions
The results of this study showed that simultaneous
profitability, growth of sale, size of firm, has an
influence on dividend policy. This shows that not all
variables can affect the company's dividend policy on
the automotive and components.
6.2 Suggestions
• In this study, not all ratios are used to assess
profitability, so it is advisable in future studies
to increase the ratio or other variables. The
period of research conducted during the period
2012-2016 within a period of 5 years, for further
research can be conducted additional research
period in a longer period of time.
• Companies in providing dividend policy to
investors should strive to provide the right
policies to maintain the stability of corporate
earnings is often a signal for investors. And
components for the automotive industry, should
be more emphasis on prudential aspects in
delivering dividend decisions, so as to attract
investors to invest.
• Investors should be prudent and cautious before
investing in a company one to see the company's
financial statements by comparing the previous
report in order to avoid future losses.
ANCOSH 2018 - Annual Conference on Social Sciences and Humanities
554

REFERENCES
Brigham, E.F., Houston, J.F., 2001. Financial
Management, eighth edition, book one, Jakarta: Erland.
Christiany Goddess, 2008. The effect of managerial
ownership, institutional ownership, debt policy,
profitability, and the size of the company dividend
policy.
Clarensia, and Azizah Rahayu, 2011. Said sales growth had
a negative effect on the dividend policy for when sales
of the company increased the revenue generated will be
used to finance the company.
Darminto, 2007. Factors Influencing Dividend Policy.
Brawijaya.
Ghozali, 2005. Aplikasi Analisis Multivariati Dengan
Program SPSS.
Hanafi, M., 2004. Management Mamduh Keuangan.
Yogyakarta: BPFE.
Harjito, A., Martono, 2005. Management Keuangan.
Yogyakarta.
Hatta, 2002. Profitability, Liquidity, And Company Size
Effect on Dividend Policy and Corporate Value Non
Services Sector. 5 (2).
Hasan, M.I., 2002. Principles of Materials Research
Methodology and Application. Bogor: Ghalia.
Indrawati Marpaung, Hadianto Bram, 2009. Influence
Profitability and investment opportunities to the
Dividend Policy: Empirical Study on forming the
aforementioned LQ45 index in the Indonesia Stock
Exchange. 1 (1).
Kasmir. 2010. Introduction to Financial Management.
Jakarta: Prenadamedia Group.
Kesuma, A., 2009. Analisis Faktor Yang Mempengaruhi
Struktur Modal Serta Pengaruhnya Terhadap Harga
Saham Perusahaan Real Estate Yang Go Publik Di Bei.
Jurnal Manajemen Dan Kewirausahaan, 2 (1).
Laksono Good, 2006. Influence Analysis Return on Assets,
Sales Growth, Asset Growth, Cash Flow and Liquidity
Against Dividend Payout Ratio (Comparison of In
Company Multi National Company (MNC) Domestic
Corporation And Its Listed in the Jakarta Stock
Exchange Period 2002-2004).
Nursandari, M., 2015. Analysis of Factors Affecting
Dividend Policy by Size (size of the company) As
Variable Moderation in Manufacturing Companies
Listed on the Indonesia Stock Exchange.
Santika and Kusuma Ratnawati. 2002. "The influence of the
capital structure, internal factors and external factors on
the value of industrial enterprises entering the Jakarta
stock exchange". Strategic business journal, 10
December.
Simamora Henry, 2012. Akutansi Manajemen, Edisi III,
Star Gate Publisher: Yogyakarta.
Sugiono, 2013. Metode penelitian pendidikan pendekatan
kuantitatif, kualitatif, dan R&D. Alfabeta Bandung.
Suharli, M., 2006. Akutansi Untuk Bisnis Jasa dan Dagang.
Edisi Pertama, Graha Ilmu Yogyakarta.
Wisdom and Astuti, 2013. Size of the firm have a positive
impact on the dividend policy.
www.idx.co.id
Effect of Profitability, Growth of Sale, Size of Firm on Dividend Policy and Automotive Sector Sub in Part in 2012-2016
555
