
Capturing CO
2
in a Bubble-Column Scrubber Using Blended Amine
Solvent
Pao Chi Chen
*
, Huan Sheng Tseng, Zi Qi Lai and Zi Xiang Liao
Department of Chemical and Materials Engineering ;Lunghwa University of Science and Technology, Taiwan, China.
Email: chenpc@mail2000.com.tw
Keywords: Carbon dioxide, amine, bubble-column scrubber, Taguchi, mass transfer coefficient
Abstract: Carbon dioxide emissions are the major climatic change issue in the world. In order to reduce the CO
2
emissions, several technologies have been explored, in which absorption is found to be a powerful method.
The key factors for an effective absorption are the structure of the scrubbers and solvents adopted. Therefore,
this study aimed at absorbing carbon dioxide through a bubble column using AMP+MEA blended amine
solution as an absorbent. The reason for using MEA+AMP as the absorbent was that its absorption capacity
can be improved and the price was cheaper for both. In addition, the scrubbing factor for a bubble-column
scrubber was higher. In the experiment, CO
2
absorption was performed by simulating the temperature of the
flue gas and the concentration of CO
2
in the coal-fired power plant. The liquid flow rate (A), gas flow rate
(B), temperature in the column (C) and solution concentration (D) were chosen as the operating factors.
There were 4 factors in total, and 3 levels of each were taken for Taguchi design L
9
(3
4
). There were a total
of 9 groups of experiments. In order to explore the effect of operating variables on the absorption efficiency
(E), absorption rate (R
A
) and overall mass transfer coefficient (K
G
a), the parameter significance and target
operating condition (E=90%; R
A
=1x10
-3
mol/s-L; K
G
a=0.4 s
-1
) could be obtained by Taguchi design and
Taguchi analysis, so as to serve as a reference for future scale-up design. The results showed that E was in
65.79-98.7%; R
A
was in 3.54 x10
-4
-13.9 x10
-4
mol/s-L; and K
G
a was in 0.1743-0.3950 s
-1
. After Taguchi
analysis, A and B were found to be significant parameters, and the target condition was confirmed to be
A1B1C2D3. In addition, the best condition was also discussed in here.
1 INTRODUCTION
Currently, the CO
2
emissions in industry are mainly
from coal-fired power plants, steel-making plants,
petrochemical industry and cement plants, etc.,
among which coal-fired power plants are the most
concerned. In order to reduce CO
2
emissions, a lot
of studies for the capture, storage and reuse of CO
2
were explored, mainly focusing on the post-
combustion using absorption method (Yang et al.,
2008; Yu et al., 2012), which is to use an alkaline
solution to capture CO
2
(Chen et al., 2015).
Therefore, the improvement of absorbent efficiency,
absorbers and solvent regeneration efficiency has
become important in research. How to effectively
reduce the cost of electricity becomes the key to the
success of CO
2
capture and storage (CCS).
According to literature reported, the MEA is widely
used in various amines (Chen et al., 2015; Versteeg
et al., 1996). However, due to the high energy
consumption required using single amine, the
development of blended amine was valued (Vaidya
and Kenig, 2007; Adeosun et al., 2013;
Rinprasertmeechai et al., 2012), such as
MEA+AMP, which has development space based on
absorptive capacity and lower energy consumption
(Choi et al., 2009; Khan et al., 2015; Aroonwilas
and Veawab, 2009). A similar viewpoint for lower
energy consumption was reported by Gomes et al.
(Gomes et al., 2015), who found that diethyl amine
was more competitive in price and loading capacity
as compared with other amines. However, the
reaction rate of blended amines with CO
2
can be
expressed below (Versteeg et al., 1996; Xiao et al.,
2000; Vaidya and Kenig, 2007):
76
Chen, P., Tseng, H., Lai, Z. and Liao, Z.
Capturing CO2 in a Bubble-Column Scrubber Using Blended Amine Solvent.
In Proceedings of the International Workshop on Environment and Geoscience (IWEG 2018), pages 76-81
ISBN: 978-989-758-342-1
Copyright © 2018 by SCITEPRESS – Science and Technology Publications, Lda. All rights reserved

r
k
RR
NH
K
K
R
RN
CO
1)
where (RR’NH) and (R
2
RN) represent the
concentration of MEA and AMP, respectively. This
equation shows that the absorption rate is influenced
by the concentration of MEA, AMP and OH
-
, which
also indicates that the CO
2
emitted by the plant can
be treated with absorption mode in alkaline solution
(Xiao et al., 2000; Chen et al., 2008). In addition,
the efficiency of absorption process is usually set to
90%, it is also desirable to have a high mass transfer
coefficient to make the scrubber smaller (Weiland
and Hatcher, 2011; Idem et al., 2006). Due to the
fact the mass transfer coefficient for the use of
scrubber is approximately in the range of 0.1-1.0 1/s
(Chen et al., 2015; Tontiwachwuthikul et al., 1992;
Aroonwilas et al., 1999), it is difficult to achieve
both higher efficiency (90%) and higher mass
transfer coefficient (0.4 1/s), simultaneously.
In absorption experiment, the packed column,
tray column and bubble column were often used. As
the operation of the packed column is complicated,
and its operating cost is high, while the bubble
column is characterized by the merits such as
controllable pH value, high mass transfer coefficient,
high absorption factor and easy operation. Therefore
in this study the absorption experiment is performed
using the bubble column with a blended amine
solution (MEA/AMP) as the absorbent. This study
planned to conduct an experiment to absorb CO
2
by
the bubble column with MEA+AMP as a solvent to
search for and confirm the target operating condition
and parameter significance, and predict the
feasibility with absorption efficiency of 90%,
absorption rate of 1.0x10
-3
mol/L s, and mass
transfer coefficient of 0.41/s. In order to compare,
the best condition analysis was also explored.
2 EXPERIMENTAL DESIGN AND
PROCEDURE
2.1 Absorption Experiment Design
The experiment aimed at absorbing carbon dioxide
using MEA+AMP blended amine in a bubble
column. The results were expected to be applied to
the absorption of CO
2
emitted by coal-fired power
plants. Therefore, the carbon dioxide of flue gas in
the coal-fired power plant with the concentration of
15% and temperature of 55℃ was simulated to enter
the column. Taking liquid flow rate, gas flow rate,
liquid temperature, and solution concentration as
the condition factors, three levels of each condition
factor were taken respectively, i.e. liquid flow rate
(A:0.1-0.3L/min), gas flow rate (B:3-9L/min), liquid
temperature (C:30-50℃), and solution
concentration (D:4-6M) . Theoretically, a total of
81(=3
4
) experiments needed to be done, but due to
the high cost and time-saving in this way, this
experiment used the Taguchi experimental design to
reduce the groups of the experiment to L
9
(3
4
)=9 to
save time and experimental costs. The value
obtained in the steady state was adopted to obtain
the absorption rate, absorption efficiency and overall
mass transfer coefficient, and then the statistical
software was used to find out the sequence of
significance and target condition. Table 1 shows the
condition factors and levels, Table 2 shows the
orthogonal arrays, and there are 9 groups of
experiments under different conditions needed to be
conducted.
Table 1: Factors and levels in this work.
Factor level
1 2 3
A(L/min) 0.1 0.2 0.3
B(L/min) 3 6 9
C(℃) 30 40 50
D(M)
4 5 6
Table 2: Orthogonal table, L
9
(3
4
).
No. A B C D
No1 1 1 1 1
No2 1 2 2 2
No3 1 3 3 3
No4 2 1 2 3
No5 2 2 3 1
No6 2 3 1 2
No7 3 1 3 2
No8 3 2 1 3
No9 3 3 2 1
The Taguchi method uses the signal and noise
ratio (S/N) as the process optimization objective
function (Chen et al., 2015; Hvalec et al., 2004). The
target value is:
2
1
)(
1
log10 my
nN
S
i
n
i
(2)
Capturing CO2 in a Bubble-Column Scrubber Using Blended Amine Solvent
77
In addition, the best condition for larger-the-
better is:
n
i
i
y
nN
S
1
2
11
log10
(3)
where y
i
is experimental data for ith level, n the
number of level, and m the target value. Using the
two equations and experimental data obtained, the
objective condition, best condition and parameter
importance could be determined.
2.2 Calculation of Experimental Data
Experimental data including absorption efficiency,
absorption rate, and overall mass transfer coefficient
are listed in Table 3. In these equations, V
L
, Q
y
, P
A
and T
1
represent the final solution volume, gas flow
rate, inlet gas partial-pressure and inlet gas
temperature, respectively. In order to determine
overall mass transfer coefficient, a two-film model
and mass balance are adopted (Chen et al., 2015; c).
In addition, it is assumed that the concentration of
CO
2
gas in the liquid phase is extremely small,
which can be ignored (C
A
≫HC
AL
). Therefore, the
overall mass transfer coefficient can be calculated
from the following Eq. (6), in which K
G
a can be
calculated from known inlet and outlet conditions.
Table 3: Equations evaluated in this work (
Chen et al.,
2015
).
E
100%
4)
1
1
1
1
5)
6)
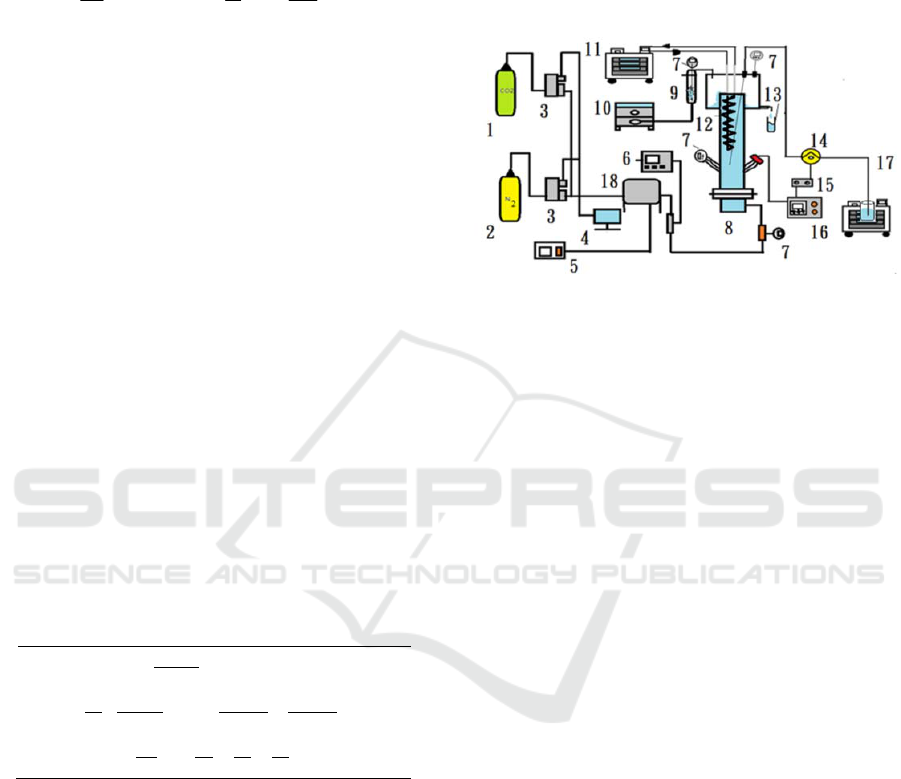
2.3 Experimental Devices and
Procedures
The devices required for this experiment are shown
in Figure 1, including the bubble column, gas-liquid
feed system, pH detector, CO
2
detection system, gas
heating system and liquid cooling system. In this
experiment, the blended amine (AMP/MEA) was
used as an absorbent, among which the AMP
accounted for 30wt% of the total amine
concentration, which was reported in the previous
work. In order to achieve the desired concentration,
the required blended amine concentration was
prepared by using distilled water. Second, the flow
rate of carbon dioxide and nitrogen was input based
on the proportion of 15% of CO
2
, and the gas inlet
temperature was maintained at 55℃. The
experiment was started after the blended amine was
put into the column.
1. CO
2
-tank 10. CO
2
-meter
2. N
2
-tank 11. Cooling system
3. Mass flow controller 12. Coil
4. PC 13. Sampling vessel
5. Heating adjuster 14. Tubing pump
6. Pressure gauge 15. Pump controller
7. Digital thermometer 16. pH controller
8. Bubble column 17. Thermal stat tank
9. Drying vessel 18. Heater
Figure 1: Experimental device.
3 RESULTS AND DISCUSSION
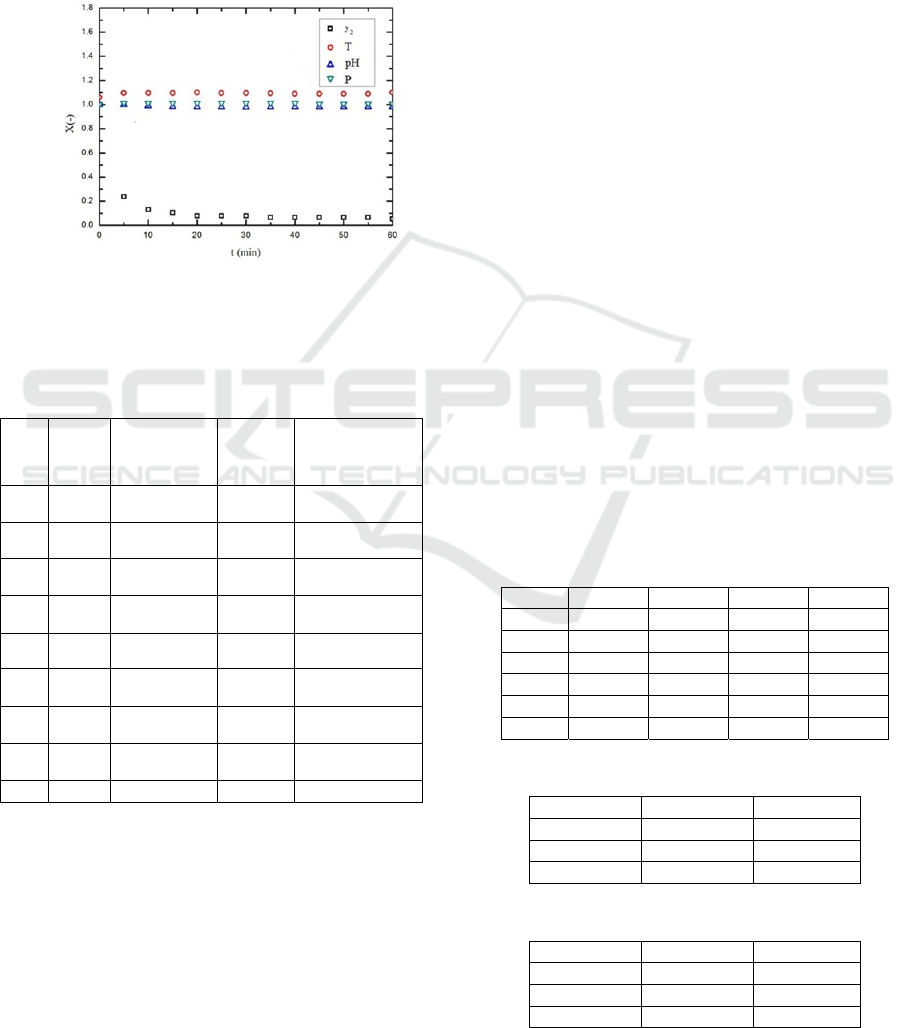
3.1 Operation and Data Calculation at
the Steady State Condition
In order to understand the relationship of the outlet
concentration of gas, liquid temperature, pH, and
inlet pressure against time during operation, the
measured value divided by the initial value was
defined as X (-) value, which was taken as the Y-
axis; the time (t) was taken as the X-axis, as shown
in Figure 2; after 1 hour of experiment, it was found
that the X values kept constant after 20 minutes,
showing that the system reached a steady state.
Therefore, all data can be evaluated at the steady
state condition. The experimental results may be
divided into two parts. Part 1 used the Taguchi
method to design 9 groups of experiments, and
calculated the data of absorption rate, absorption
efficiency and overall mass transfer coefficient as
shown in Table 4. Part 2 searched for and confirmed
the target operating condition and the sequence of
IWEG 2018 - International Workshop on Environment and Geoscience
78
significance based on the results of the data
calculated in Part 1 and Taguchi analysis. Table 4
shows the values calculated by Eqs. (4)-(6), where E
is in 65.8% - 98.7%; R
A
is in 3.54×10
-4
- 13.9×10
-4
(mol/s.L); K
G
a is in 0.1743- 0.3950(s
-1
), and in
addition, the pH is in 10.45 - 11.25 in the steady
state. These data are comparable with literatures
(Chen et al., 2015; Vaidya and Kenig, 2007).
Figure 2: A plot of X vs. t, showing the steady state
operation (No.1).
3.2 Taguchi Analysis
Substituting the absorption efficiency and target
value into Eq. (2) for Taguchi analysis, the results
were shown in Table 5. It was found that the
parameter significance affecting the absorption
efficiency was B>A>C>D, and the combination of
the target value was A1B1C2D3. The data showed
that B was the main factor. After conducting the
Taguchi target analysis for the absorption rate, it
was found that the parameter significance affecting
the absorption rate was B>D>C>A, and the
combination of the target value was A2B3C3D2. It
was found that B was the main influence factor. In
addition, Taguchi target analysis for the overall
mass transfer coefficient showed that the parameter
significance affecting the overall mass transfer
coefficient was B>D>A>C, and that the best
combination was A3B3C2D2. It was also found that
factor B was the main influencing factor. Table 6
showed the parameter significance analysis and
target conditions obtained through S/N analysis for
the three types of calculation data. Regarding the
overall influence effect, B was the most significant,
followed by D, and it was also found that the impact
of C was the least significant.
Alternatively, the best condition and parameter
significance through the Taguchi analysis were
shown in Table 7. It was found that the parameter
significances affecting E (No. 13), R
A
(No. 14), and
K
G
a(No.15) were B>D>A>C, B>A>C>D and
B>A>D>C, respectively. It was also found that B
was the main influence factor, while C was the
minor factor. The result was similar to that target
analysis. Except B, D is the second significant in
Target condition, while A is the second significant
in the best condition. In addition, the conditions for
Nos. 12 and 15 are the same, but the parameter
importance is slightly different.
T a b l e 5: S / N r a t i o a n a l y s i s f o r E .
LevelA B C D
1 (-20.24) (-16.16) -22.39 -24.75
2 -25.24 -24.06 (-21.06) -22.27
3 -22.23 -24.93 -24.85 (-21.46)
Delta 5.00 8.77 3.76 3.29
Rank 2 1 3 4
Target 1 1 2 3
Table 6: Target condition and significance.
Target Significance Condition
NO.10(E) B>A>C>D A1B1C2D3
NO.11(R
A
) B>D>C>A A2B3C3D2
NO.12(K
G
a) B>D>A>C A3B3C2D2
Table 7: The best condition and significance.
The best Significance Condition
NO.13(E) B>D>A>C A1B1C2D2
NO.14(R
A
) B>A>C>D A3B3C2D3
NO.15(K
G
a) B>A>D>C A3B3C2D2
Table 4: Experimental data obtained in here.
NO E(%)
R
10
/∙
a
pH
1 93.42 3.54 0.1743 10.64
2 82.89 7.3 0.2564 10.45
3 74.03 11.99 0.3525 10.16
4 96.05 4.23 0.2444 11.20
5 65.79 6.62 0.1769 10.43
6 70.51 11.6 0.3058 11.18
7 98.70 4.4 0.3153 10.82
8 78.67 7.35 0.2337 11.25
9 72.73 13.9 0.3950 10.73
Capturing CO2 in a Bubble-Column Scrubber Using Blended Amine Solvent
79
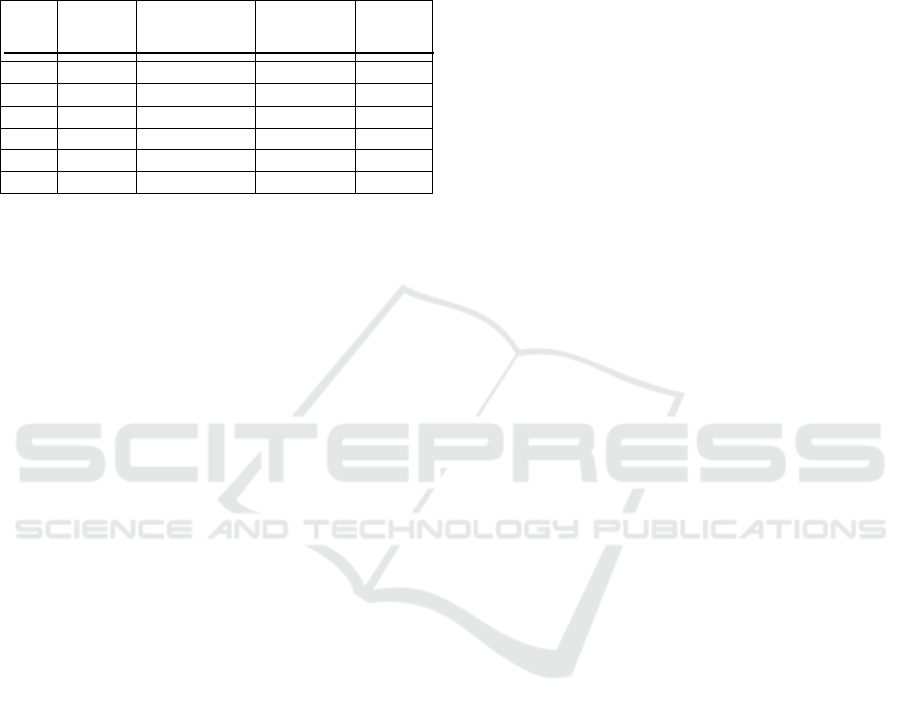
3.3 Confirmations of the Target
Conditions and the Best Conditions
Table 8: Confirmation for target condition and the best
condition.
NO
E
(%)
R
A
(10
4
)
/∙
a
1/
p
H
10 (92.11) 12.25 0.5723 10.82
11 97.33 (3.34) 0.2160 10.93
12 82.67 11.86 (0.403) 11.00
13 (94.74) 3.74 0.1924 10.62
14 80.52 (13.48) 0.4415 10.72
15 82.67 11.86 (0.403) 11.00
Table 6 showed the analysis results of the target
condition and the best condition obtained by
Taguchi analysis. According to the target conditions,
three experiments were carried out and the results
were shown in Table 8. It was found that No. 10, its
E, R
A
and K
G
a, were all up to standard, indicating
that the target conditions is obtained in here. In
addition, the best condition confirmation showed
that No. 13 was not reached the best, while the Nos.
14 and 15 all reached the best as compared with
Taghchi experiments listed in Table 4. From both
analyses, it was hard to obtain higher E and K
G
a
simultaneously. Therefore, how to use effective
experimental design to obtain the desired conditions
became significant. In this study, the condition of
A1B1C2D3(No. 10) can satisfy not only a higher E,
but also a higher K
G
a.
4 CONCLUSIONS
A continuous bubble-column scrubber was
successfully used to investigate the process variables
on the absorption efficiency, absorption rate, and
overall mass transfer coefficient. Under Taguchi
experimental design, a total of 9 runs were carried
out in here. It was found that the system could reach
a steady state after 20 minutes, while the final pH
was in the range of 10.16-11.25, depending on the
operating condition. In addition, the absorption
efficiency was found to be in the range of 65.79-
98.7%; the absorption rate was in
4
1054.3
-
Lsmol
/109.13
4
; and the overall mass
transfer coefficient was in 0.1743-0.3950 1/s. From
Taguchi analysis for target and the best modes, it
was found that the gas flow rate (B) was major
factors influencing the outcome data, while the
influence of the temperature in the column (C) was
the minor. In addition, the target condition was
found to be A1B1C2D3. Through the confirmation
of target conditions, it was known that the E
(92.11%), R
A
(1.225x10
-3
mol/s L) and K
G
a (0.5723
s
-1
) all reached the set target value.
REFERENCES
Adeosun A, Goetheer N E H, Abu-Zahra M R M 2013
Absorption of CO
2 by Amine Blends Solution: An
Experimental Evaluation International Journal of
Engineering And Science 3 12
Aroonwilas A, Veawab A 2009 Integration of CO2
capture unit using blended MEA-AMP solution into
coal-fired power plants Energy Procedia 1 4315
Aroonwilas A, Veawab A, Tontiwachwuthikul P 1999
Behavior of mass-transfer coefficient of structured
packings in CO
2 absorbers with chemical reactions
1999 Ind Eng. Chem. Res. 38 2044
Chen P C, Luo Y X, Cai P W 2015 Capture of Carbon
Dioxide Using Monoethanolamine in a Bubble-
Column Scrubber Chemical Engineering &
Technology 38 274
Chen P C, Shi W, Du R, Chen V 2008 Scrubbing of CO2
green-house gases, accompanied by precipitation in a
continuous bubble-column scrubber Ind. Eng. Chem.
Res. 47 6336
Choi W J, Seo J B, Jang S Y, Jung J H, Oh K J 2009
Removal characteristics of CO2 using aqueous
MEA/AMP solutions in the absorption and
regeneration process Journal of Environmcntal
Scicnccs 21 907
Fan L S 1989 Gas-liquid-solid fluidization engineering
Butterworths USA Ch. 9 600
Gomes J, Santos S, Bordado J 2015 Choosing amine
based absorbents for CO2 capture Environmental
Technology 36 19
Hvalec M, Gorsek A, Glavic P 2004 Experimental design
of crystallization processes using Taguchi method Acta
Chim. Slov. 51 245
Idem R, Wilson M, Tontiwachwuthikul P, Chakma A,
Veawab A, Aroonwilas A, Gelowitz D 2006 Pilot plant
studies of the CO2 capture perforance of aqueous MEA
and Mixed MEA/MDEA solvents at the University of
Regina CO2 capture technology development plant and
boundary dam CO capture demonstration plant Ind.
Eng. Chem. Res. 45 2414
Khan A A, Halder G N, Saha A K 2015 Carbon dioxide
capture characteristics from flue gas using aqueous 2-
amino-2-methyl-1-propanol (AMP) and
monoethanolamine (MEA) solutions in packed bed
absorption and regeneration columns Int. J. Greenh.
Gas Control 32 15
IWEG 2018 - International Workshop on Environment and Geoscience
80

Rinprasertmeechai S, Chavadej S, Rangsunvigit P,
Kulprathipanja S 2012 Carbon dioxide removal from
flue gas using amine-based hybrid solvent absorption
World Academy of Science, Engineering and
Technology 64 410
Tontiwachwuthikul P, Meisen A, Lim J 1992 CO
2
Absorption by NaOH, Monoethanolamine and 2-
amino-2-methyl-1-propanol Solutions in a Packed bed
Chem. Eng. Sci. 47 381
Vaidya P D, Kenig E Y 2007 Absorption of CO
2 into
aqueous blends of alkanolamines prepared from
renewable resources Chem. Eng. Sci. 62 7344.
Vaidya P D, Kenig E Y 2007 CO
2-alkanomine reaction
kinetics: A review of recent work Chem. Eng. Technol.
30 1467
Versteeg G F, Van Dijck L A J, van Swaaij W P J 1996
On the kinetics between CO
2 and Alkaloamines both
in aqueous and non-aqueous solutions. An overview
Chem. Eng. Comm. 144 113
Capturing CO2 in a Bubble-Column Scrubber Using Blended Amine Solvent
81
