
Environmental Quality Assessment of Seawater and Sediment in
Futou Bay, Southeast China
Siting Chen, Weili Wang and Qingsheng Li
*
Third Institute of Oceanography, SOA, Xiamen 361005, China.
Email: qsli@tio.org.cn
Keywords
: Seawater, sediment, environmental quality, Futou Bay
Abstract:
In December 2014, the quality of seawater and sediments in Futou Bay was investigated. The results
showed that the main pollutants in seawater were dissolved inorganic nitrogen (DIN), and its concentration
ranged from 0.294 to 0.369 mg/L. The active phosphate (PO
4
-P) concentration met the second class of
Seawater Quality Standard. Other parameters were all within the first class of Seawater Quality Standard.
The waters in study area have reached the eutrophication state, and nitrogen (N) is a limiting factor. The
parameters in the sediments all met the first class of Sediment Quality Standard. Correlation analysis
showed that increased nitrate nitrogen (NO
3
-N) will reduce dissolved oxygen (DO) in the sea. Oil in
seawater, mercury and arsenic in sediments may not come from terrestrial.
1 INTRODUCTION
Futou Bay is located in the southeast of Fujian
province between Liuao peninsula and Gulei
peninsula. The bay is 10 km wide from east to west,
16 km long from north to south, and has an area of
about 160 km
2
. The coastal area is rich in aquatic
products. The northern part of the Futou Bay is a
tourist and entertainment area. The southern waters
are close to Gulei industrial and urban construction
area, where some industrial projects have started. To
date, there have been no reports of environmental
quality in seawater and sediment of Futou Bay. A
systematic survey of the physical and chemical
characteristics of water bodies and sediments has
been conducted in December 2014, to assess the
environmental quality. This provide the technical
support required for environmental protection,
sustainable development and utilization.
2 SAMPLING, ANALYSIS AND
EVALUATION METHODS
2.1 Sample Collection
In December 2014, the surface water samples of 12
stations were collected in Futou Bay. Surface
sediment samples were collected at stations 1, 5, 6, 7,
9 and 12. The sample stations are shown in figure 1.
The collection and preservation of seawater
samples were carried out in accordance with Marine
monitoring specifications (Ma et al., 2007a). The
surface sediments were collected with a grab bucket
dredger. A plastic spoon was used to extract the
undisturbed surface mud sample. Sediment samples
for analysis of sulfide components were sealed in
brown glass bottle, and preserved below 4 ºC.
Sediment samples for analysis of trace metals and
organic carbon were sealed in vinyl bags, and
preserved under 0 ~ 4 ºC. After drying, samples
were crushed by agate mortar, sieved via 160 mesh
sieve, mixed and stored for trace metal analysis.
110
Chen, S., Wang, W. and Li, Q.
Environmental Quality Assessment of Seawater and Sediment in Futou Bay, Southeast China.
In Proceedings of the International Workshop on Environment and Geoscience (IWEG 2018), pages 110-114
ISBN: 978-989-758-342-1
Copyright © 2018 by SCITEPRESS – Science and Technology Publications, Lda. All rights reserved
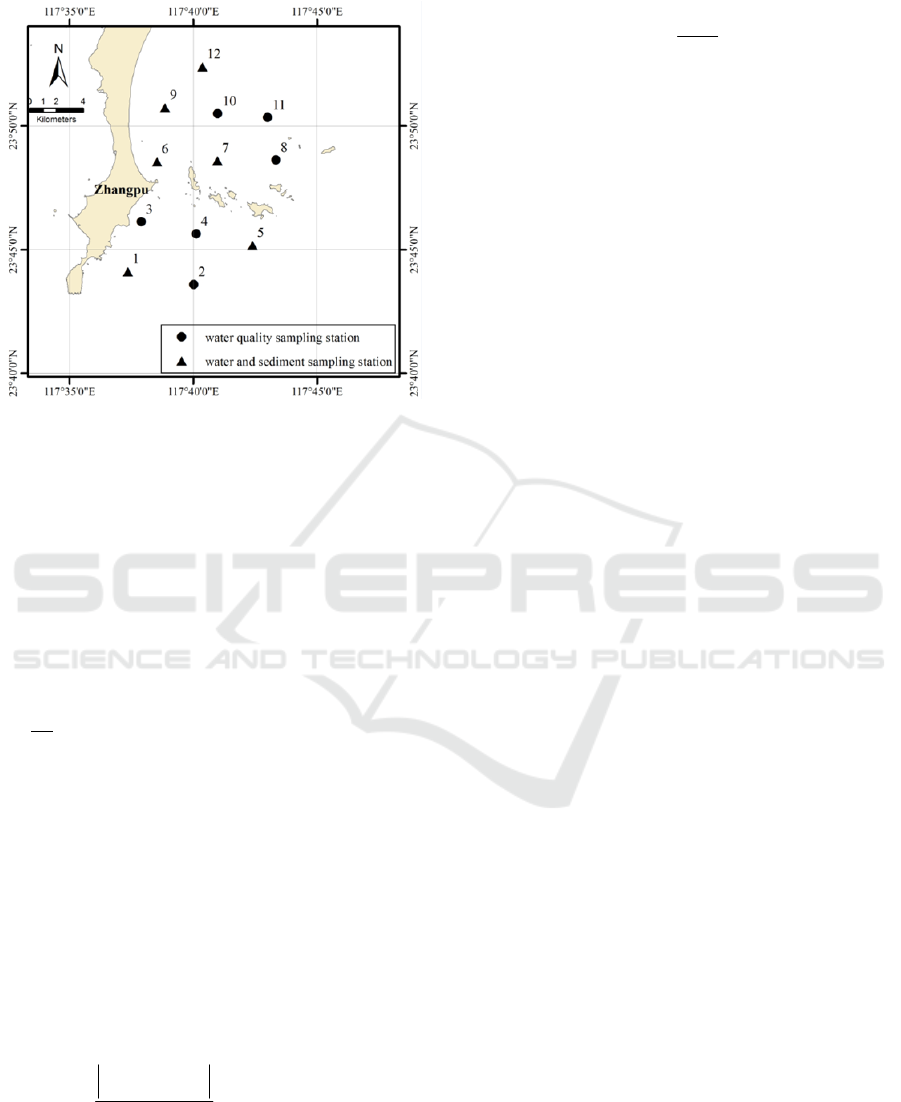
Figure 1: Sampling station map of Futou Bay.
2.2 Sample Analysis
Sea water and sediment quality were analyzed
according to Marine monitoring specifications (Ma
et al., 2007a;
Ma et al., 2007b). Seawater quality
parameters include pH, salinity, dissolved oxygen
(DO), chemical oxygen demand (COD), nitrate
nitrogen (NO
3
-N), nitrite nitrogen (NO
2
-N),
ammonia nitrogen (NH
3
-N), active phosphate (PO
4
-
P), oil and suspended particulate matter (SPM). The
surface sediment quality parameters include copper
(Cu), lead (Pb), zinc (Zn), mercury (Hg), arsenic
(As), organic carbon and sulfide.
2.3 Evaluation Methods
2.3.1 Assessment of Sea Water and
Sediment Quality
Sea water and sediment quality were assessed using
the following formula:
P
i
j
=C
i
j
/C
j
(1)
For DO, the formula was as follows:
si
sf
if
DO
i
DODO
DODO
DODO
P
si
s
i
DO
i
DODO
DO
DO
P
910
(2)
Where, P
ij
is the quality index of j pollutants at
point i; C
ij
is the average of the measured
concentration of j pollutants at point i; C
j
is the
evaluation limit value of j pollutants. DO
f
is the
saturated dissolved oxygen concentration value, DO
i
is the mean measured concentration of DO at point i;
DO
s
is the evaluation limit value of DO; and P
iDO
is
the quality index of DO at point i.
2.3.2 Eutrophication
The eutrophication status index (E) was used to
evaluate the nutritional status of sea area (Zou et
al., 1983). The following formula was used:
E=C
COD
×C
DIN
×C
DRP
/4500 (3)
Where, E was the value of eutrophication, C
COD
,
C
DIN
, C
DRP
were measured values of COD(mg/L),
DIN(mg/L) and PO
4
-P(mg/L). If E is greater than or
equal to 1, it indicates that the water body has
reached eutrophication level.
2.3.3 Correlation Analysis
Correlation analysis was used to analyze the
correlation between seawater quality indicators and
marine sediment quality indicators. A p<0.1
indicates that the correlation is significant (Zhang et
al., 2003). The analysis was conducted in SPSS
Statistics.
3 RESULTS AND DISCUSSION
3.1 Water Quality and Eutrophication
Level
According to seawater quality standards (GB3097-
1997)
(
State Environmental Protection Administration,
1997
), the main pollutants in the surface seawater of
the study area were DIN, and its concentration
ranged from 0.294 to 0.369 mg/L, with an average
value of 0.338mg/L. NO
3
-N was the main form of
DIN. The PO
4
-P concentration lies within the second
class of seawater quality standard, whereas the other
indicators such as pH, DO, COD and oil lie within
Environmental Quality Assessment of Seawater and Sediment in Futou Bay, Southeast China
111
the first class. The results of surface water quality
monitoring are given in Table 1.
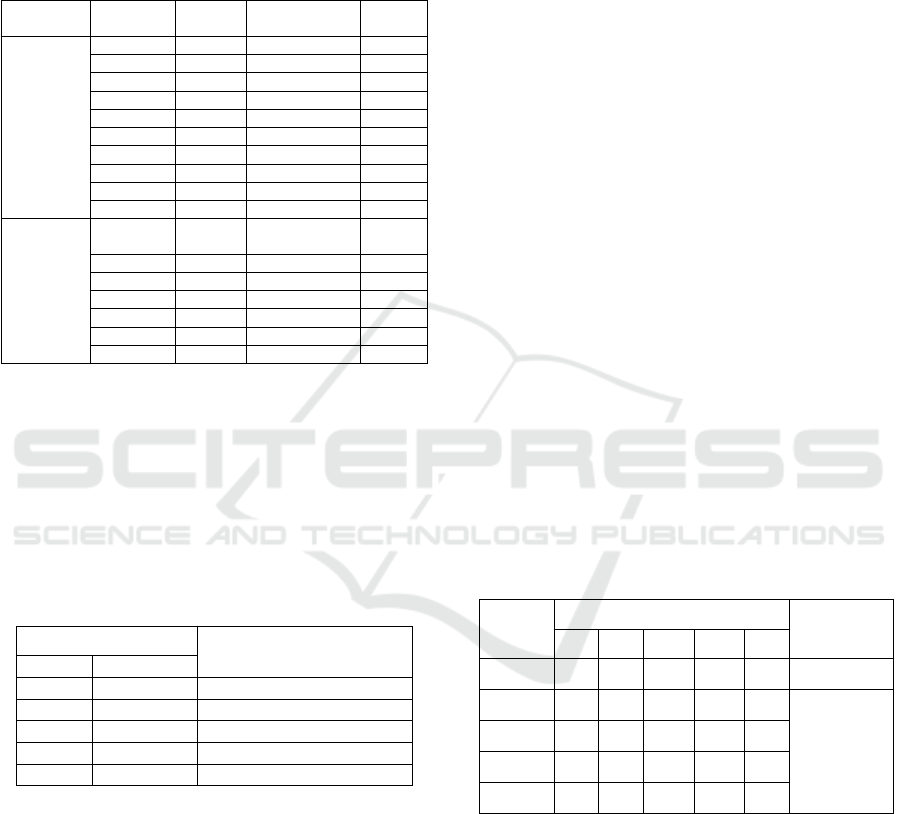
Table 1: Statistical descriptive of water quality and
surface sediment quality parameters.
Categorie
s
Indicator
s
Units Average±SD Media
n
Water
quality
parameters
pH mg/L 8.163±0.013 8.165
S mg/L 30.191±0.081 30.219
DO mg/L 8.575±0.138 8.525
COD mg/L 0.49±0.229 0.490
SPM mg/L 34.342±12.786 31.400
PO
4
-P mg/L 0.029±0.0008 0.029
NO
3
-N mg/L 0.317±0.019 0.318
NO
2
-N mg/L 0.004±0.0015 0.004
NH
4
-N mg/L 0.018±0.012 0.013
Oil µg/L 14.233±2.112 14.400
sediment
quality
parameters
Organic
carbon
(%) 0.240±0.226 0.160
Sulfide (mg/kg) 18.800±17.395 18.800
Cu (mg/kg) 3.542±3.910 1.625
Pb (mg/kg) 14.233±6.679 11.650
Zn (mg/kg) 25.833±20.855 16.350
Hg (mg/kg) 0.079±0.037 0.068
As (mg/kg) 6.083±2.381 5.300
Compared with other bays in Southeast China
(Yan et al., 2012; Ouyang et al., 2014; Jiang et al.,
2015; Chen et al., 2010), the content of DIN and
PO
4
-P in the surface water of Futou Bay is higher
than that in Dongshan Bay and Jiuzhen Bay, but
lower than Xiamen Bay and Quanzhou Bay, as
shown in Table 2.
Table 2: Comparison of DIN and DRP
concentration in surface water in different bays.
c/mg•L
-1
Source
DIN PO
4
-P
0.338 0.029 This research
2.070 0.047 (Yan et al., 2012)
0.370 0.039 (Ouyang et al., 2014)
0.100 0.016 (Jiang et al., 2015)
0.283 0.023 (Chen et al., 2010)
The eutrophication status index (E) ranged from
0.38 to 2.49. The E values in stations 2, 3, 5, 7, 10
and 12 were 1.13, 1.21, 1.08, 1.28, 2.49 and 1.09,
respectively, indicating that the water body at these
stations were in eutrophic conditions. The maximum
value appeared in station 10 (E value was 2.49),
suggests eutrophication is probably due to domestic
and agricultural sewage input and aquaculture in
coastal area.
3.2 Surface Sediment Quality
The average content of Cu, Pb, Zn, Hg and As in
surface sediments of Futou Bay were 3.54, 14.2,
25.8, 0.079 and 6.1 mg/kg. The average content of
organic carbon and sulfide were 0.17% and 7.6
mg/kg. These results indicate that the sediment of
Futou Bay met the first class of sediment quality
standard based on the Marine sediment quality
standards (GB18668-2002) (Ma et al., 2007c). The
results of surface sediments are presented in Table 3.
DRP (dissolved reactive phosphorus) is the content
of PO
4
-P.
The content of Cu, Pb and Zn in the surface
sediments of Futou Bay were generally lower than
that of other bays in Southeast China, and the
content of Hg and As were at medium level, as
shown in Table 3.
Table 3: Comparison of trace metal concentration in
different bays.
Research
area
ω/(mg/kg)
Source
Cu Pb Zn Hg
As
Futou
Bay 3.54 14.2 25.8 0.079 6.1
This research
Quanzhou
Bay 16.2 31.8 75.7 0.044 1.15
Fujian gulf
Chronicles
Xiamen
Bay 24.5 41.5 113.3 0.057 6.47
Dongshan
Bay 13.6 31.9 78.4 0.091 2.03
Jiuzhen
Bay 8.64 136 57.5 0.028 6.29
IWEG 2018 - International Workshop on Environment and Geoscience
112
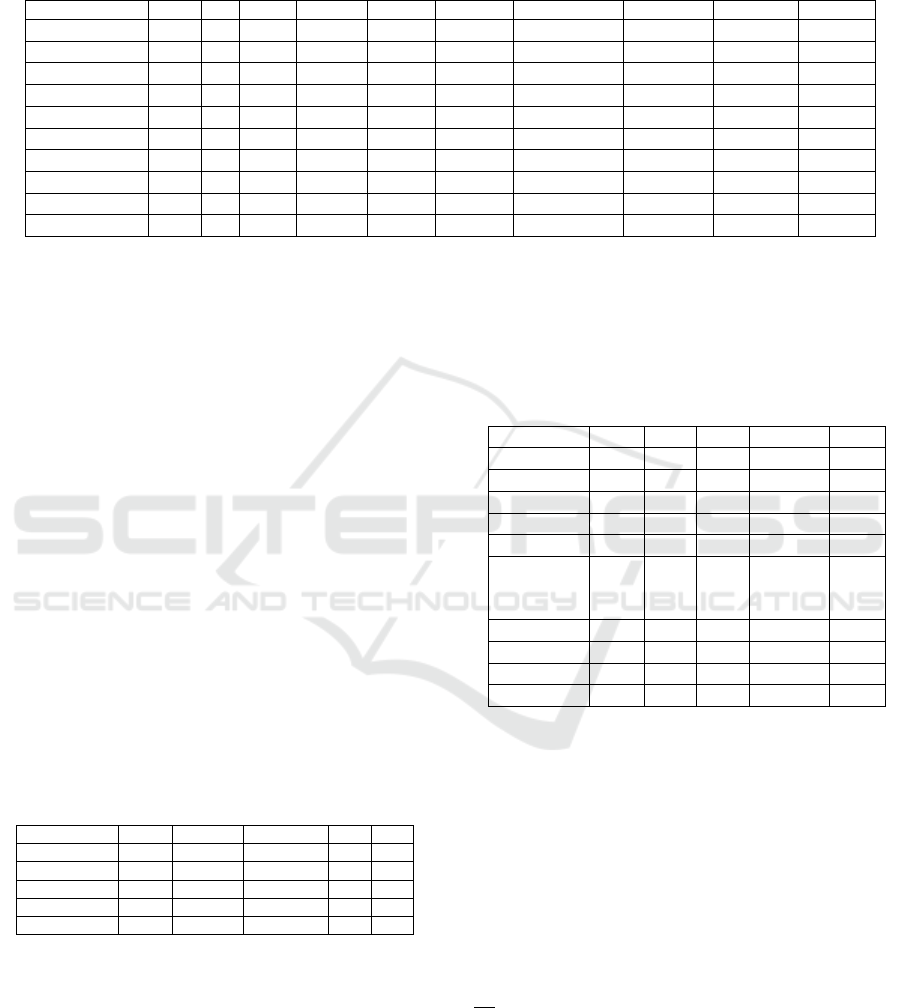
Table 4: Correlation analysis of water quality parameters.
Parameters pH S DO COD SPM PO
4
-P NO
3
-N NO
2
-N NH
3
-N Oil
PH 1
S 1 0.598*
DO 1 -0.770**
COD 1
SPM 1
PO
4
-P 1
NO
3
-N 1
NO
2
-N 1
NH
3
-N 1 -0.689*
Oil 1
* indicates a significant correlation at the 0.05 level (bilateral), ** indicates significant correlation at 0.01 level
(bilateral)
3.3 Relationship Between Water
Quality And Surface Sediment
Quality
In the sampling period, DO was negatively
correlated with NO
3
-N (Table 4), which indicated
that the content of DO in sea area with high NO
3
-N
content was low. Oil was negatively correlated with
NH
3
-N, indicating that the source of oil may come
from sea activities rather than land sewage. We
cannot reasonably explained the relationship
between salinity and NO
2
-N (salinity was positively
correlated with NO
2
-N).
In the sampling period, Cu was positively
correlated with Pb and Zn, Pb was positively
correlated with Zn (Table 5), which indicated that
Cu, Pb and Zn in surface sediment had similar origin.
Table 5: Correlation analysis of surface sediment
quality parameters.
Parameters Cu Pb Zn Hg As
Cu 1 0.987** 0.998**
Pb 1 0.987**
Zn 1
Hg 1
As 1
* indicates a significant correlation at the 0.05 level
(bilateral), ** indicates significant correlation at
0.01 level (bilateral).
In the sampling period, DO in water was
positively correlated with Hg in surface sediment,
PO4-P was negatively correlated with As (Table 6),
which indicated that the source of Hg and As may
not come from land sewage.
Table 6: Correlation analysis of water quality
parameters and surface sediment quality.
Parameters Cu Pb Zn Hg As
pH
S
DO 0.891*
COD
SPM
PO
4
-P -
0.89
0*
NO
3
-N
NO
2
-N
NH
3
-N
Oil
* indicates a significant correlation at the 0.05 level
(bilateral), ** indicates significant correlation at
0.01 level (bilateral).
4 CONCLUSIONS
The main pollutant in the surface seawater of Futou
Bay were DIN, and its concentration ranged from
0.294 to 0.369 mg/L. The concentration of PO
4
-P
met the second class of seawater quality standard,
whereas other indicators such as pH, DO, COD and
oil met the first class of seawater quality standard.
The water body in the study area has reached
eutrophication state and N was the limiting factor.
Compared with other bays, the concentrations of
DIN and PO
4
-P were higher than that in Dongshan
Bay and Jiuzhen Bay, but lower than Xiamen Bay
and Quanzhou Bay.
Environmental Quality Assessment of Seawater and Sediment in Futou Bay, Southeast China
113

The average concentration of Cu, Pb, Zn, Hg and
As in the surface sediments of Futou Bay were 3.54,
14.2, 25.8, 0.079, and 6.1 mg/kg. The average
concentration of organic carbon and sulfide were
0.17% and 7.6 mg/kg, respectively. These results
indicate that the sediment of the Futou Bay lies
within the first class of sediment quality standard.
The content of Cu, Pb and Zn in the surface
sediments of Futou Bay were generally lower than
that of other bays in Southeast China, and the
content of Hg and As were at medium level.
Increased NO
3
-N content will reduce dissolved
oxygen in the sea. Oil in seawater, Hg and As in
sediment may not come from terrestrial.
REFERENCES
Chen Y, Wang X, Wu H 2010 Study on nutrient
distributions and eutrophication in seawater of Jiuzhen
Bay Journal of Fujian Fisheries 1
Jiang S, Lin P, Cai Y, et al 2015 Analysis of
eutrophication characteristics in Dongshan Bay based
on PCA Journal of Marine Sciences 33
Ma Y, Xu H, Yu T, et al. 2007 The specification for
marine monitoring—Part 4 Seawater analysis General
Administration of Quality Supervision, Inspection and
Quarantine of the People’s Republic of China
Ma Y, Xu H, Yu T, et al. 2007 The specification for
marine monitoring—Part 5 Sediment analysis General
Administration of Quality Supervision, Inspection and
Quarantine of the People’s Republic of China
Ma D, Tang L, Wang J, et al. 2007 Marine sediment
quality General Administration of Quality Supervision,
Inspection and Quarantine of the People’s Republic of
China
Ouyang Y, Wang C, Li Q, et al. 2014 Analysis of the
space-time distribution of nutrients and the degree of
eutrophication in Xiamen Bay Fujian Journal of
Agricultural Sciences 29
State Environmental Protection Administration, State
Oceanic Administration, Sea water quality standards
State Environmental Protection Administration 1997
Yan L, Jiang J, Zhan X, et al. 2012 Characters of
spatiotemporal variations of chemical elements
content and eutrophication index in surface water of
Quanzhou Bay Journal of Oceanography in Taiwan
Strait 31
Zhang Y, Xu Y, Gu F, et al. 2003 Correlation analysis of
NDVI with climate and hydrological factors in oasis
and desert Acta Phytoecological Sinica 27
Zou J, Dong L, Qin B 1983 Preliminary discussion on
eutrophication and red tide in Bohai Bay Marine
Environmental Science 2
IWEG 2018 - International Workshop on Environment and Geoscience
114
