
Numerical Simulation of Oil Spill in Nanri Island Channel Based on
the MIKE Spill Analysis Model
Cui Wang, Shang Jiang, Zhouhua Guo and Qingsheng Li
*
Third Institute of Oceanography, State Oceanic Administration, Xiamen 361005, China.
Email: liqingsheng@tio.org.cn.
Keywords: Mike spill analysis model, numerical simulation, oil spill, Nanri Island Channel, marine environment
Abstract:
Based on the MIKE spill analysis model, the oil spill model was built in the sea area around Nanri Island,
and then the drift path and the influence of oil film were simulated under the dominant wind conditions (the
northeast wind). Ten tons of fuel oil was set as the initial spill to model the oil-spill diffusion process over
48 hours. The results showed that the oil spill drift in the sea was mainly influenced by tide and wind, while
the tide played a dominant role. The migration trend of the oil film was different under different wind
conditions. The total area after oil spill was 190.81km
2
, 142.95km
2
and 11.71km
2
under the dominant wind
conditions with oil concentration exceeded 0.05mg/L, 0.3mg/L and 0.5mg/L, respectively. In general, the
oil film covered largest area when oil spill happened at high tide moment under the dominant wind. The
predicted results could provide technical support for the oil spill emergency decision-making and its damage
assessment.
1 INTRODUCTION
Over the past few decades, with the rapid
development of the global marine economy, many
oil spill accidents have frequently occurred in the
sea. Marine oil spill can significantly impact the
coastal and estuarine environment, which cause
damage to the ecosystem, beaches, coastal wetlands,
fisheries and water supplies(Wang et al., 2008;
Griggs, 2011). Recently, scientific studies on marine
oil spill prediction techniques play a key role to
ensure the emergency plans can be implement
successfully (Li et al., 2017). In the past two decades,
some oil spill simulation models have been
developed and the technology in oil spill model has
been reviewed by researchers(Wang and Shen, 2010;
Liu and Sun, 2009). Some mature oil spill models
such as OILMAP, OSIS, OSCAR, MOTHY have
been widely adopted in the oil spill prediction and
response for the coastal areas (Zhou and He, 2018;
Reed et al., 1999). The study on simulation of oil
spill in China began in the 1980s, which was
successfully applied in Pearl River Estuary(Xiong et
al., 2005), Yangtze River Estuary(Yang et al., 2013),
Bohai Bay(Zhang and Wu, 1998), Jiaozhou Bay(Lou
et al., 2001) and Meizhou Bay(Zhao et al., 2011).
There are many numerical studies on oil spill
behavior in the offshore and estuary waters, but
there are only a few reports on numerical
simulations of oil spills in the sea near islands. The
MIKE spill analysis (MIKE SA) module in this
study was used to simulate oil spills and applied to
the sea areas around Nanri Island to predict the
impact of oil spills under different weather
conditions. The predicted results could provide
technical support for the oil spill emergency
decision-making and its damage assessment, which
may reduce the impact of the oil spill accident on the
marine environment and improve the emergency
capacity for environmental risk management.
2 THE MIKE SA MODEL
The MIKE SA module uses the "oil particle"
approach to simulate the spatiotemporal behavior of
oil spills in the sea. Based on the Lagrangian
theory(Chao et al., 2001), the model predicts the
weathing of oil particles over time by predicting
drift, diffusion, turbulent diffusion (fluid and wind
field effects), evaporation, emulsification, and
126
Wang, C., Jiang, S., Guo, Z. and Li, Q.
Numerical Simulation of Oil Spill in Nanri Island Channel Based on the MIKE Spill Analysis Model.
In Proceedings of the International Workshop on Environment and Geoscience (IWEG 2018), pages 126-131
ISBN: 978-989-758-342-1
Copyright © 2018 by SCITEPRESS – Science and Technology Publications, Lda. All rights reserved

dissolution of oil particles in the sea, simulates
location, degree and scope of influence, thickness of
oil film. In addition, the model has a complete pre-
and post-processing module that can quickly process
the results file to service decision-making system.
The model has had many successful application
cases (Xu, 2011; Jiang, 2007) around the world.
The oil spill processes of MIKE SA module,
mainly includes advection, horizontal turbulent
diffusion and expansion processes.
2.1 Advection Process
Flow and wind stress are the main forces that lead to
the drift of oil particles. The advection velocity of
each grid point (
t
U
)can be computed as:
s
U
w
U
w
C
t
U
+⋅=
Where,
w
U
is the wind velocity at 10 m above
the water surface (m/s);
w
C
is the wind drift factor,
usually abopted as 0.03~0.04;
s
U
is the surface
water current velocity, which can be obtained from
the 3-D turbulence tidal model (Chao, 1999).
2.2 Horizontal Turbulent Diffusion
The turbulent diffusive transport is normally
calculated by a random walk procedure. Based on
Al-Rabeh et al.’s study (Al-Rabeh et al., 1989), the
distance that any oil particle travels by horizontal
diffusion is:
p
tDRS
∇⋅
−
=
α
α
6
1
1
][
where
1
1
][
−
R
is the random number in the
interval [-1,1];
α
D
is the horizontal diffusion
cofficient and
p
t
∇ is the time step (s).
2.3 Spreading on the Water Surface
Spreading is the horizontal expansion of oil slick
due to gravity, inertia, viscous and surface tension
forces. A modified Fay-type spreading equation is as
follow:
3
4
3
1
⎟
⎠
⎞
⎜
⎝
⎛
⋅=
A
V
A
a
K
dt
dA
(1)
Where A is the area of the oil slick (m
2
); ܭ
is a
coefficient; ܸ is the oil volumn; t is time in seconds.
3 HYDRODYNAMIC MODEL
AND MODEL VALIDATION
3.1 Hydrodynamic Model
In this paper, MIKE model was selected as the
hydrodynamic forecast component around Nanri
Island area. The simulated area include Meizhou
Bay, Pinghai Bay and Xinghua Bay, with the south
boundary reaching N24˚52’and the east boundary up
to E119˚ 36’ (Figure 1). In this model, an
unstructured triangular was created (Figure 2). The
grid resolution in most of computing, such as coastal
areas, and harbors was refined to 50m, while the grid
resolution was set to 1.5km in the open boundary.
The tide forcing at open boundaries consisted of
tidal elevations and barotropic velocities for 8 major
tide constituents, which are obtained from the
Oregon State University Tidal Data Inversion
software.
Figure 1: Locations of oil spill and sensitive objects in the
sea area around Nanri island.
390000 410000 430000 450000
2760000
2780000
2800000
2820000
Nanri
Island
Pinghai
Fengwei
Jiangyin
Island
Xinghua Bay
Meizhou
Bay
cultivation area
oil spill point
cultivation area
Marine
protected
area
Marine
protected
area
1#
2#
3#
T1
observation station
Numerical Simulation of Oil Spill in Nanri Island Channel Based on the MIKE Spill Analysis Model
127
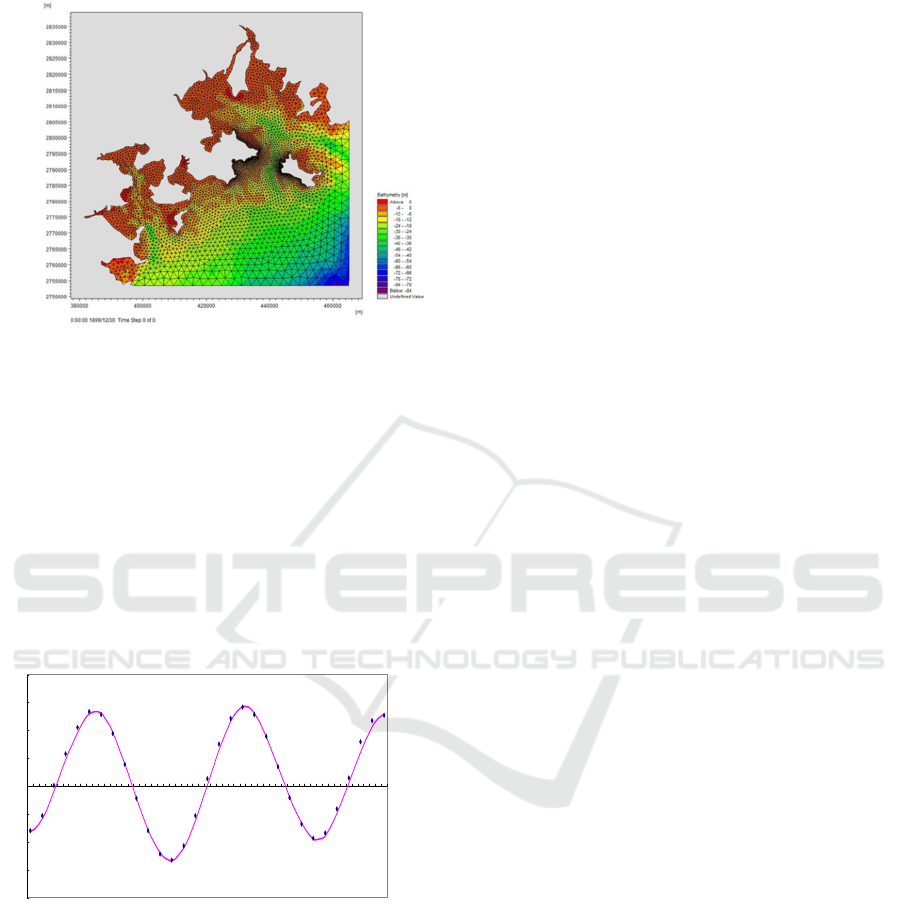
Figure 2: The grid configuration and the bathymetry of the
simulated area.
3.2 Validation of Hydrodynamic Model
In this study, observation from one tidal station as
tidal elevations and three current stations including
the surface current velocities and directions were
adopted to validate the model results (Figure 1). The
tidal elevation comparison between observation and
the model simulated outputs was shown in Figure 3.
The tidal elevations from the model were in good
agreement with the observed data. The tidal
elevations were thus well predicted.
Figure 3: The tidal elevation comparison (point:
observation; line: model outputs).
As shown in Figure 4, the surface current
velocities and direction from the numerical model
were in good agreement at different stations, which
showed that the model could produce reliable
prediction of the current velocity and direction.
3.3 Surface Water Currents
The simulated surface water current near Nanri
Island at different times was showed in Figure 5.
The essential formation of water current was
reversing currents, and the direction changes of
water current occurred at the time of high or low tide.
The maximum current velocity rapidly generated
when the rate of tidal level rise or ebb reached
maximum. The tidal currents in calculated area were
typical reciprocation currents in a tidal cycle and the
tidal flats changed obviously along the tidal cycle.
4 ACCIDENTAL OIL SPILL
IMPACT PREDICTION IN THE
SEA AREA AROUND NANRI
ISLAND
4.1 Oil Spill Parameter
The assumed location of oil spill in this study is
24.47°N, 118.09°E (Figure 1), which was the
intersection of the Nanri Island channel and the
fishermen’s route, where oil spills occured
frequently in the past. The type of oil spilled was
fuel oil with a specific gravity of 920 kg/m
3
. The
designed oil spill volume was 10 tons (transient oil
spill), which was represented by 1000 “oil particles”
in the model. The wind speed was 4.5m/s and the
perennial dominant wind direction was northeast for
the model. For the time of oil spill, 4 kinds of
situations were selected: high tide moment, low tide
moment, ebb tide moment and flood tide moment.
-4.00
-3.00
-2.00
-1.00
0.00
1.00
2.00
3.00
4.00
1 2 3 4 5 6 7 8 9 101112 131415161718192021 2223242526 272829303132333435 3637 38 39 40 41 42 43 44 45 46 47 48 49 50 51 52 53 54 55 56 57 58 59 60 61
IWEG 2018 - International Workshop on Environment and Geoscience
128
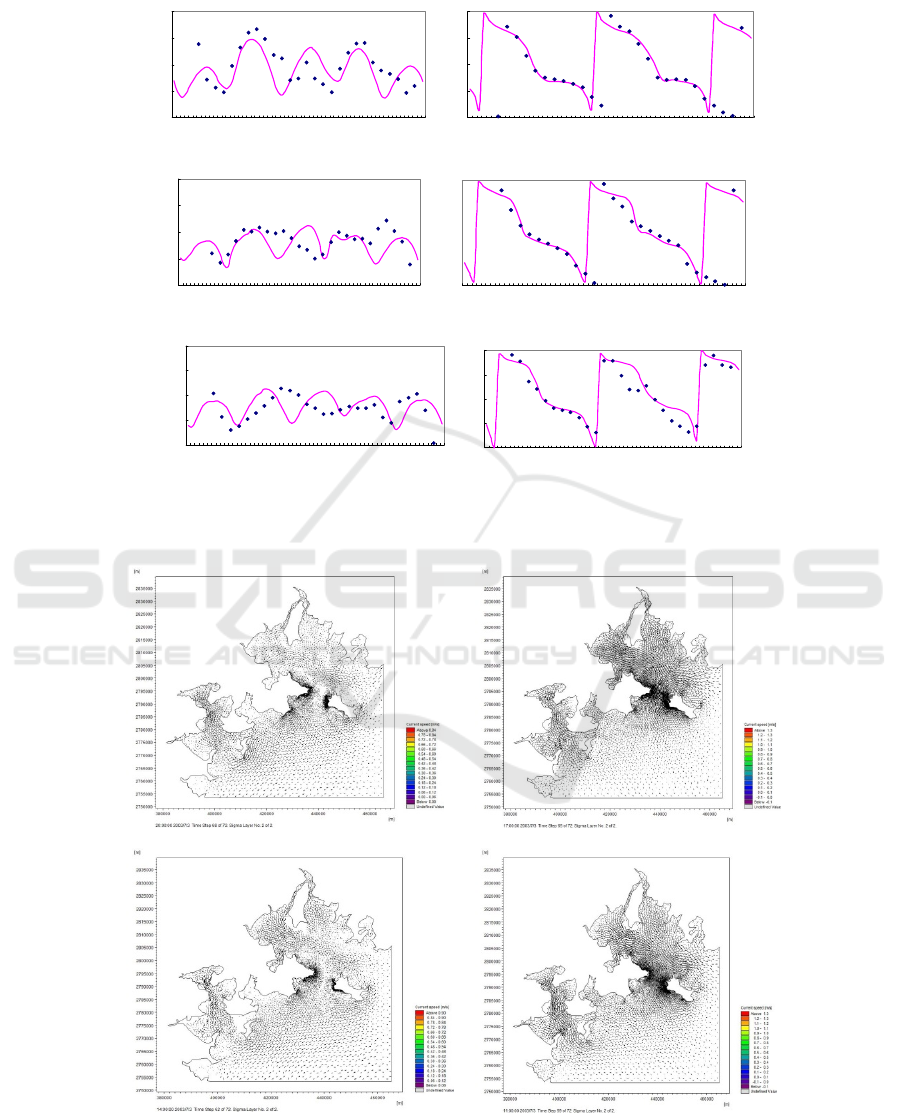
(a)1#
(b)2#
(c)3#
Figure 4: The current velocities (left) and direction (right) comparison form the model and observations
at different station (point: observation; line: model outputs).
(
a
)
hi
g
h tide time
(
b
)
flood tide time
(c) low tide time
(d) ebb tide time
Figure 5: The simulated surface water currents near Nanri Island at different times.
0.00
0.20
0.40
0.60
0.80
1 3 5 7 9 11131517192123 25272931333537 39414345474951 5355575961
0
90
180
270
360
1 3 5 7 9 1113151719212325272931333537394143454749515355575961
0.00
0.20
0.40
0.60
0.80
1 3 5 7 9 11 13 15 17 19 21 23 25 27 29 31 33 35 37 39 41 43 45 47 49 51 53 55 57 59 61
0
90
180
270
360
1 3 5 7 9 1113151719212325272931333537394143454749515355575961
0.00
0.20
0.40
0.60
0.80
135791113151719212325272931333537394143454749515355575961
0
90
180
270
360
1 3 5 7 9 1113 1517 1921 2325 2729 31 3335 3739 4143 45474951 53 55 57 5961
Numerical Simulation of Oil Spill in Nanri Island Channel Based on the MIKE Spill Analysis Model
129
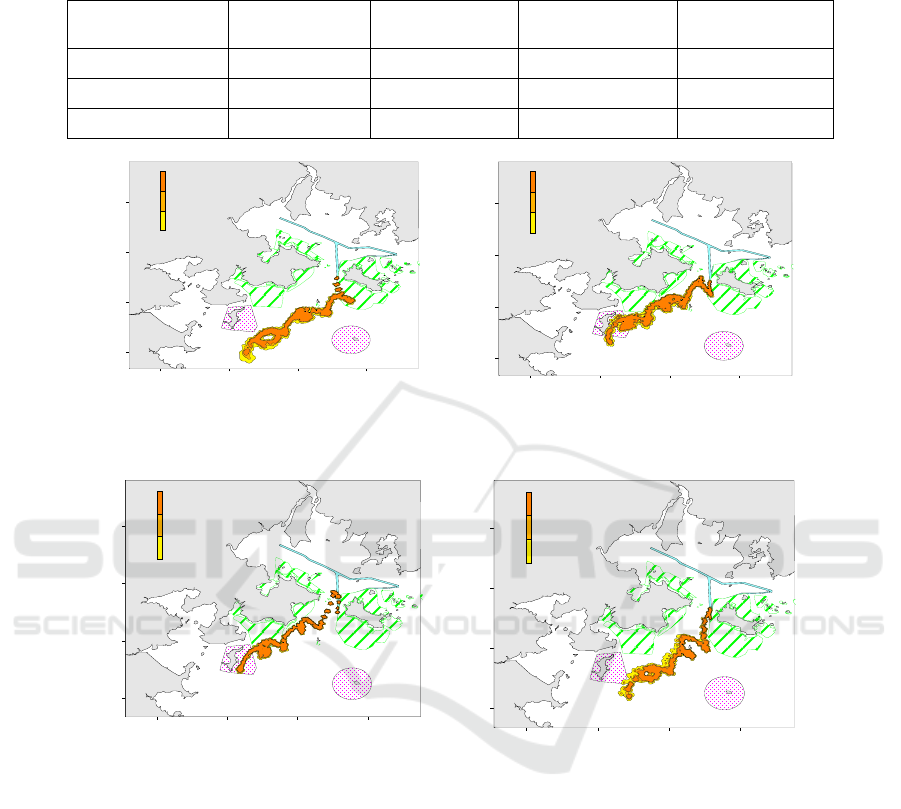
Table 1: Influence area of oil concentration increment over 48 h under northeast wind conditions (km
2
).
Concentration (mg/L) High tide moments Flood tide moments Low tide moments Ebb tide moments
≥0.05mg/L 190.81 176.49 104.83 159.55
≥0.3 mg/L 142.95 135.36 84.68 89.07
≥0.5 mg/L 117.71 109.63 75.28 67.12
Figure 6a: Influence scope after oil spill
over 48 h at high tide moments under
northeast conditions.
Figure 6b: Influence scope after oil spill over
48 h at flood tide moments under northeast
conditions.
Figure 6c: Influence scope after oil spill
over 48 h at low tide moments under
perennial dominant wind.
Figure 6d: Influence scope after oil spill over
48 h at ebb tide moments under northeast
conditions.
4.2 Oil Spill Impact Prediction
After oil spills into the sea, advection, diffusion,
evaporation and other processes take place under the
combined effects of ocean hydrodynamic
environment and atmospheric environment. In this
study, the simulation time was 48h, and the oil spill
risk prediction included four schemes. Under the
conditions of northeast wind, the 48 hour impact
scope of oil spill leakage at 4 different tides were
shown in Figure 6 (≥0.05mg/L). The scope of
impact under different concentration increments
were shown in Table 1. The total impact areas of oil
spills in four tidal were 190.81 km
2
, 176.49 km
2
,
104.83 km
2
and 159.55 km
2
respectively.
4 CONCLUSIONS
Based on the MIKE SA model, the oil spill
prediction model for the sea area around Nanri
Island was established. The drift path and impact
degree of oil spills under the prevailing wind
direction were well simulated.
390000 410000 430000 450000
2760000
2780000
2800000
2820000
Nanri
Island
Pinghai
Fengwei
Jiangyin
Island
Xinghua Bay
Meizhou
Bay
mg/L
0.05
0.3
0.5
cultivation area
cultivation area
Marine
protected
area
Marine
protected
area
390000 410000 430000 450000
2760000
2780000
2800000
2820000
Nanri
Island
Pinghai
Fengwei
Jiangyin
Island
Xinghua Bay
Meizhou
Bay
mg/L
0.05
0.3
0.5
cultivat ion area
cultivation area
Marine
protected
area
Marine
protected
area
390000 410000 430000 450000
2760000
2780000
2800000
2820000
Nanri
Island
Pinghai
Fengwei
Jiangyin
Island
Xinghua Bay
Meizhou
Bay
mg/L
0.05
0.3
0.5
cultivation area
cultivation area
Marine
protected
area
Marine
protected
area
390000 410000 430000 450000
2760000
2780000
2800000
2820000
Nanri
Island
Pinghai
Fengwei
Jiangyin
Island
Xinghua Bay
Meizhou
Bay
mg/L
0.05
0.3
0.5
cultivation area
cultivation area
Marine
protected
area
Marine
protected
area
IWEG 2018 - International Workshop on Environment and Geoscience
130

The simulation results showed that the drifting
process of oil spills was mainly affected by the tide
and wind, and the tide played a leading role. Under
the prevailing wind direction (Northeast wind)
conditions, the oil film moves southwestwards under
the influence of tide and wind. The impact of oil
spillage at the time of high tide was the largest, and
the sea areas that exceed one (or two), three and four
water quality standards were 190.81, 142.95 and
11.71 km
2
respectively. Although the simulation
model in this study adopted long-term statistical
meteorological conditions, the prediction result still
provided effective and referable oil spill behavior
and technical support for the oil spill emergency
decision-making to the marine environmental
management department administration, which can
reduce the impact of oil spill accidents on the marine
environment and improve the emergency capacity
construction of environmental risk management
ACKNOWLEDGEMENT
The research was funded by the National Natural
Science Foundation of China (Grant No.41406121).
REFERENCES
Al-Rabeh A H, et al 1989 A stochastic simulation model
of oil spill fate and transport Applied Mathematical
Modelling 13
Chao X, Shankar N J and Cheong H 1999 A three-
dimensional multi-level turbulence model for tidal
motion Ocean Engineering 26
Chao X, Shankar N J and Cheong H 2001 Two- and three-
dimensional oil spill model for coastal waters Ocean
Engineering 28
Griggs J W 2011 BP gulf of Mexico oil spill Energy Law
Journal 31
Jiang W 2007 Study on the simulation of accidental oil
spill in the Huanpu River Shanghai: Tongji University
Li H, Li Y and Li C, et al. 2017 Bohai and Yellow Sea Oil
Spill Prediction System and Its Application to
Huangdao ‘11.22’ Oil Spill Incident Earth and
Environmental Science 18
Liu W and Sun Y 2009 Study and improvement of oil spill
simulation methods Journal of East China Normal
University (Natural Science) 3
Lou A, Wang X and Sun C, et al. 2001 A simulation of oil
spill trajectory on sea surface of Jiaozhou Bay Journal
of Oceanography of Huanghai & Bohai Seas 19
Reed M, Johansen O and Brandvik P J, et al. 1999 Oil
spill modeling towards the close of the 20th century:
overview of the state of the art Spill Science and
Technology Bulletin 5
Wang C, Du J and He S 2008 Study on the weathering
processes of spilled oils Transaction of Oceanology
and Limnology 3
Wang J and Shen Y 2010 Development of an integrated
model system to simulate transport and fate of oil
spills in seas Science China Technological Series 53
Xiong D, Yang J and Yan S 2005 R&D on oil spill
contingency forecast information system for Pearl
River Eatuary Marine Environmental Science 24
Xu T 2011 Numerical simulation of accidental oil spill in
the Liuwudian Channel, Xiamen Harbour Journal of
marine sciences 29
Yang H, Liu C and Li Y, et al. 2013 Simulation of oil spill
in anchorage out of Yangtze River Eastuary based on
GNOME Journal of Shanghai Ocean University 22
Zhang B and Wu G 1998 Contingent predicting system of
oil for Bohai Sea Marine Environmental Science 17
Zhao D, Ji H and Yang S, et al. 2011 Application of the
NOAA oil-spill model, Gnome, to Meizhou Bay
Journal of Oceanography in Taiwan Strait 30
Zhou Q and He L 2018 Research progress of numerical
simulation study for Marine oil spill Environmental
Protection of Oil & Gas Fields 28
Numerical Simulation of Oil Spill in Nanri Island Channel Based on the MIKE Spill Analysis Model
131
