
The Quantitative Characterization and Evaluation of Water Flooding
Efficiency of D Oilfield
Yugui Liu
No.6 Oil Production Factory,Daqing Oilfield Limited Company,Daqing,163318, China
Email: 1525841456@qq.com
Keywords:
Efficiency of water injection, storage ratio of injected water, water consumption ratio, water drive index
Abstract: Eastern D pure oil zone has entered the phase of extra high water cut. In order to reduce the decline rate,
control rising speed of water cut, study on the efficiency of water injection and reasonable injection and
production rate for target block, in this way determine limit of controlling water injection and increasing
efficiency, and increase the efficiency of water injection. This paper makes a technical evaluation of the
water injection efficiency of the target block from the storage ratio of injected water, water consumption
ratio, and water drive index. The relationship curve of storage ratio of injected water versus degree of
reserve recovery in the east of D pure oil zone compares with theoretical diagram, and the work of
controlling water injection such as water plugging is suggested to strengthen. The relationship curve of
water consumption ratio versus degree of reserve recovery in the target zone compares with theoretical
diagram, the water injection utilization ratio of the zone in recent years is poor, which belong to three types
of level. In order to increase the efficiency of water injection, adjustment measures are urgent needed. The
real relationship curve of water drive index versus water cut in the target zone compares with theoretical
diagram, it is confirmed that the development effect is better in early stage of development, exist a
underground deficit phenomenon in middle stage of development and water drive index could not be used to
evaluate the development effect of water flooding in later stage of development.
1 INTRODUCTION
The evaluation of oilfield efficiency of water
injection is often through compared various indexes
(such as reserve control degree, reserve employ
degree, production decline rate, water content
escalating rate, and recovery ratio)with the standards
of oil and gas profession index. According to
contrast results, oilfield water drive efficiency is
evaluated. At the same time, the evaluation of
oilfield efficiency of water injection is also obtained
through comparing various indexes with the
standards of same oilfield development index.
According to contrast results, better or worse of
oilfield water flooding efficiency is concluded. The
contrast method is used in the process of single
index evaluation (the line in real data is compared
with the line in theory). Aiming at the situation of
curve deviation, remedial measures are adopted.
This has guiding significance (Lu, 2015)
Sun Jiwei, Chen Bo (Sun et al., 1998;Chen et al.,
2012) et al developed the relational expression
between degree of reserve recovery and water
consumption ratio (according to the relationship
between degree of reserve recovery and water
consumption index). Fu Ming, Liao Maolin (Fu et
al., 2017) et al already adopted water drive reservoir
injection-production empirical formula in the
process of oilfield treating rightful injection-
production ratio. In this way, injection-production
empirical formula was combined with storage ratio
of injected water, water drive index in oilfield. The
line in theory was compared with the production
curve in practice, and the effect of water flooding in
target block was evaluated. Wang Zuoqian, Huang
Shunv (Wang, 2011) et al applied the relational
expression between water drive index in theory and
water content ratio, the fitness and effect of water
flooding were evaluated. Yuan Dong, Ge Lizhen
(Yuan et al., 2008) et al used the material balance
method to solve the water influx in the target block
Liu, Y.
The Quantitative Characterization and Evaluation of Water Flooding Efficiency of D Oilfield.
In Proceedings of the International Workshop on Environment and Geoscience (IWEG 2018), pages 249-255
ISBN: 978-989-758-342-1
Copyright © 2018 by SCITEPRESS – Science and Technology Publications, Lda. All rights reserved
249
and obtain the water influx different stages of the
target block. According to the generalized storage
ratio of injected water and the generalized water
drive index in the way of oil flooding in oilfield, a
new method for water flooding oilfield evaluation
was created. In special oilfield, the water flooding
effect of oilfield containing edge water was
evaluated. Jiang Yuanzheng, Jin Shuanlian (Jiang et
al., 2009) et al conducted research and analysis on
two formation indexes (such as formation storage
ratio of injected water and water drive index), the
effect of water injection development in target block
was evaluated. Sun Wei, Ma Jing, Wang Mingfang,
Fang Yuliang (Sun, 2017;Ma et al., 2016;Pang and
Wang, 2005;Wang et al., 2004) et al established
ideal state chart of change of water content in the
water flooding mode. The theoretical was compared
with the actual change curve.
In order to tap the remaining potential effectively,
increase the ultimate recovery, we must speed up the
pace of researching of water flooding fine tapping
potential technology in extra high water cut period.
This article makes a technical evaluation to the
water injection efficiency of the entire area of the
target block from the three aspects of water retention
rate, water consumption rate and water flooding
index.
2 BLOCK OVERVIEW
The oil-bearing area of the D oil field is 7.5 km
2
,
and the geological reserves are 2418.8×10
4
tons. The
variation range of reservoir lithology and physical
properties are larger in the demonstration area, the
heterogeneity is stronger. There are three oil layers
in the whole area, subdivided into 72 deposition
units. The target block has fully entered the higher
water cut development stage, there are many well
pattern in the layer system and the objects to be
mined are complex and the reservoir heterogeneity
is serious, the effect of water control tap potential
measures has gradually deteriorated. However, from
a macroscopic point of view, although the overall
recovery degree is over 45%, the combined water
content is over 93%, the remaining geological
reserves of underground are still large, reaching 14
million tons.
3 EVALUATION OF STORAGE
RATIO OF INJECTED WATER
In the process of oilfield development, crude oil is
continuously produced. The gradual increase of oil
production during oil recovery in oilfield will
inevitably lead to a continuous increase in the
composite water cut. At the same time, injection
water will also be gradually produced. As the water
content of oilfield increases, the amount of crude oil
produced will increase, the storage ratio of injection
water of oilfield will decline slowly, and the result
will inevitably lead to a change from good to poor in
the way the oilfield adopts water flooding oil at this
stage. Therefore, the reservoir storage ratio of
injection water can be applied, to score the
development effect of water flooding oil in oilfield.
Usually, there are two forms of storage ratio of
injection water, the one is the accumulative storage
ratio of injection water, and the other one is the
period storage ratio of injection water. The
accumulative storage ratio of injection water is the
ratio of the water injection of having not been
produced to the water injection. In the process of
oilfield development, it is not only an important
index of the water injection status of water flooding
development oilfield, but also a benchmark for
measuring the development effect of reservoir water
flooding development oilfield, it has a grade
distinction; The period storage ratio of injection
water is the ratio of the period water injection of
having not been produced to the period water
injection. In the process of oilfield development, it
not only measures an important factor in the
utilization ratio of injection water in a certain stage
of the oilfield, but also a benchmark for measuring
the development effect of the way of water flooding
development in all stages of water injection
development oilfield, it has a grade distinction. And
it is also suitable for evaluating the development
effect of the way of water flooding for the stage
oilfield. The higher storage ratio of injection water
of oilfield in a certain stage, the greater utilization
ratio of injection water at this stage in oilfield, the
development effect of the way of water flooding of
oilfield will also increase.
According to formula 1-1, the formula of storage
ratio of injection water under the different degree of
reserve recovery can be deduced.
IWEG 2018 - International Workshop on Environment and Geoscience
250
w
i
i
o
w
1
1=1
1
g
Q
E
Q
QV
Z
Q
(1-1)
In the formula: ΔQ
o
——stage of oil
recovery,10
4
m
3
;
V——crude oil reduction factor;
Z——injection-production ratio.
After finishing
iss
ln 1 =EABR
(1-2)
In the formula:
p
i
W
W
——drainage ratio, decimal;
R——degree of reserve
recovery,%;
E
i
——storage ratio of injection
water;
W
p
——cumulative water
production,million tons;
W
i
——cumulative water
injection,million tons;
A
s
,B
s
——statistical constant.
When
p
i
W
W
value is closer to 1, B
s
can be expressed as:
s
s
=
R
D
B
E
(1-3)
s
ln 1
ss
R
R
AED
E
(1-4)
In the process of oilfield development, for
different geological oilfields, they have different
ways of water injection development. In the same
situation in oilfield development stage, there is a
close relationship between storage ratio of injection
water and oil-water viscosity, the storage ratio of
injection water will decrease as the increasing of oil-
water viscosity ratio. Therefore, the curves of D
s
, A
s
and μ
R
are regressed from a large number of oilfield
related data. Derive the relevant formulas between
them, the results are finished:
ss
s
=1 e
R
R
AD
E
E
(1-5)
The same types of geological oilfield in a certain
degree of reserve recovery, the value of storage ratio
of injection water of oilfield shows a positive
correlation relation with the value of water flooding
recovery ratio in the way of the oilfield uses water
flooding oil. Therefore, it is possible to judge the
development effect of the way of oilfield water
flooding oil by the value of the storage ratio of
injection water in oilfield.
In order to evaluate the development effect of
water injection of the way of water flooding oil on
the eastern block of the D pure oil area, according to
the value of oil-water viscosity ratio of the target
block and the relational formulas, it can calculate the
values of D
s
and A
s
separately, according to the data
of calculating results, a curve that can describe the
relation between the storage ratio of injection water
of oilfield and the degree of recovery of oilfield, this
is a set of curves describing the relationship of
oilfield under different water flooding recovery (E
R
).
The evaluation criteria for the underground storage
ratio of injection water in oilfield are shown in table
1.
Table 1: Evaluation standard of underground storage
ratio of injection water.
degree of
reserve
recovery
classify
I II III
degree of
reserve
recovery<50
≥60%
<
60%~≥50%
<50%
degree of
reserve
recovery≥50
≥80%
<
80%~≥70%
<70%
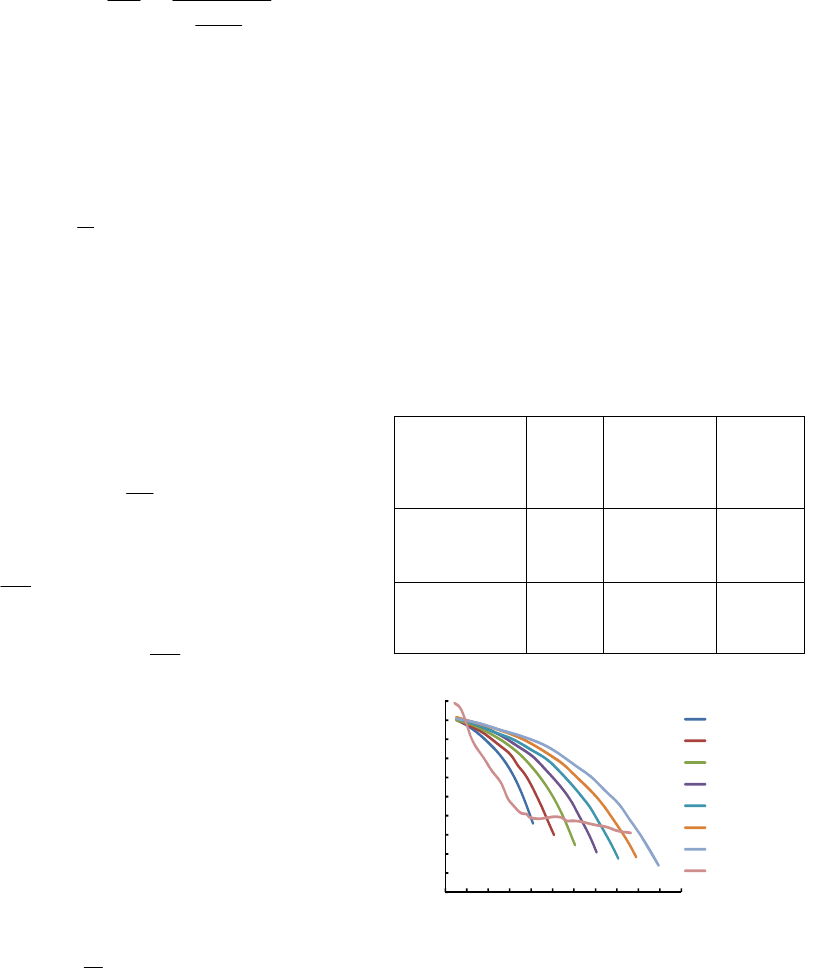
Figure 1: Relationship curve between storage ratio of
injection water and degree of reserve recovery in the east
of D oilfield.
The formula 1-4 can be used to calculate the
storage ratio of injection water (E
s
) corresponds to a
certain degree of recovery(R) under the water
flooding recovery (E
R
) of oilfield. According to the
result of the calculation of formula 1-4, to make the
0
0.1
0.2
0.3
0.4
0.5
0.6
0.7
0.8
0.9
1
0 5 10 15 20 25 30 35 40 45 50 55
storage ratio of injection water
degree of reserve recovery,%
Es(ER=25%)
Es(ER=30%)
Es(ER=35%)
Es(ER=40%)
Es(ER=45%)
Es(ER=50%)
Es(ER=55%)
Actual production data
The Quantitative Characterization and Evaluation of Water Flooding Efficiency of D Oilfield
251

E
S
~R curve. Among them, when the oilfield water
flooding recovery rates are 25%, 30%, 35%, 40%,
45%, 50% and 55%, the corresponding E
S
~R curve
is its standard curve. We need to storage ratio of
injection water of target block and the actual data
points with the degree of recovery are plotted in the
ideal case of the plate, and connect these data points,
form a curve, as shown in Figure 1.
Evaluation of the effects of oilfield development
from Figure 1, get the following conclusion. At
present, the oil field is gradually changing from the
traditional recovery scheme to the recovery scheme
of water injection development. In the initial period
of oilfield development of taking natural energy
mining into production, the declined speed of
storage ratio of injection water of oilfield is slowly,
however, the water injection utilization of oilfield is
highly. In this stage, the development effect of oil
recovery is relatively good in oilfield. However, due
to the accumulation of the contradiction between
layers, the oilfield is becoming prominent
increasingly, this led to the value of storage ratio of
injection water beginning to show a decreasing trend,
and have not been able to take remedial measures to
control water timely, and this makes the value of
water injection utilization of oilfield become low. At
this stage of the process, the development effect of
oilfield water injection development methods is
deteriorated. When the oilfield is undergoing
comprehensive improvement and governance, the
value of the storage ratio of injection water has some
room for growth. At this stage of the process, the
theoretical curve value of oil field above 50% of
recovery, the oilfield water injection efficiency has
been effectively improved, the development effect
of oilfield water injection development methods
began to gradually increase, in present, we can get
the conclusion from the current overall trend of
storage ratio of injection water, it is recommended
that when implementing various measures on the
oilfield of stable oil, in order to make the injected
water use reasonably, the water control work (such
as water shutoff, etc.) should be emphasized, to
maintain the sustainable development of each major
oilfield.
4 EVALUATION OF WATER
CONSUMPTION RATIO
In the field of oilfield professional knowledge, the
water consumption ratio refers to the amount of
water production per ton of crude oil produced by
using the method of water injection development in
oilfield. The water injection utilization is mainly
evaluated. The water consumption ratio of water
flooding oilfield is reduced, and the water injection
utilization will increase, thus reducing the amount of
injected water for water flooding development and
reducing the cost. The specific relational expression
is shown in formula 2-1.
i
o
Q
h
Q
(2-1)
The formula of injection-production ratio is
expressed by formula 2-2:
o
iwo
o
=
B
QIPR Q Q
(2-2)
From the injection-production ratio formula and
water consumption ratio formula, that is:
ww
ow
=
1
Qf
Qf
(2-3)
Combine and organize to get:
w
w
=
1
o
o
Bf
hIPR
f
(2-4)
According to the formula of water drive curve,
the mathematical expression of water consumption
index is obtained under the condition of the same
degree of reserve recovery.
7.5 1.69
o
o
=10
R
RE
B
Z
(2-5)
The volume factors of B
o
=1.115 and ρ
o
=0.851 in
the eastern part of the D pure oil region are
substituted and calculated to obtain the results of
different water flooding yields under the water
flooding index, and the water consumption index
theory chart for different water flooding recovery is
produced. The rate evaluation criteria are shown in
Table 2.
Table 2: Evaluation standard of underground storage ratio
of injection water.
Development phase
Leveling
I II III
Low phase of water content ≤0.2 0.2-0.5
>0.5
Middle phase of water content ≤2 2-4
>4
High phase of water content ≤5 5-8
>8
Extra high phase of water content ≤9 9-12
>12
IWEG 2018 - International Workshop on Environment and Geoscience
252
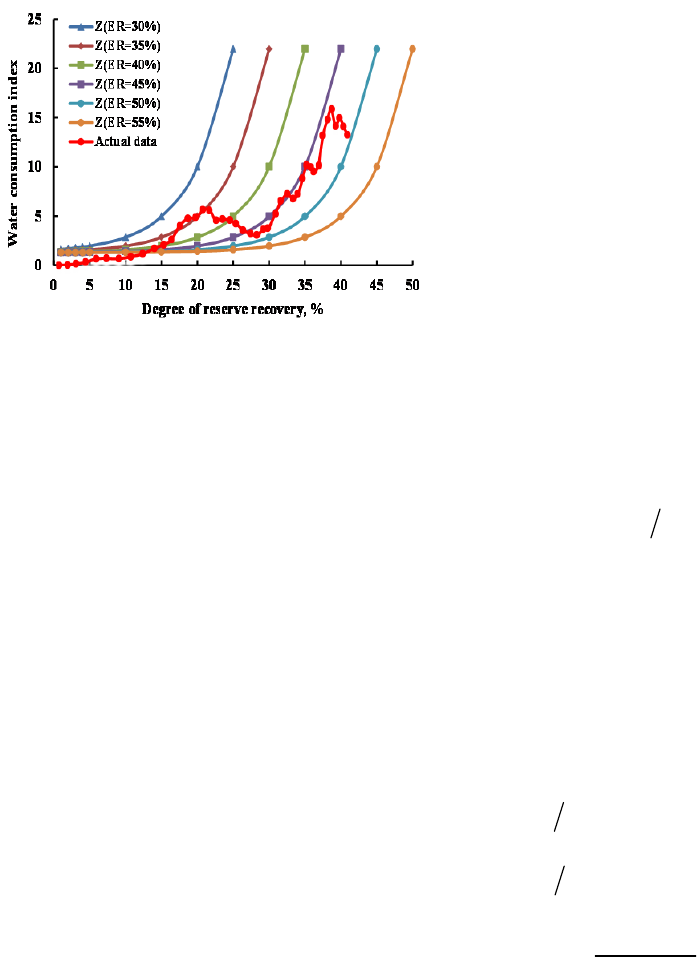
Figure 2: Relationship between curve water consumption
ratio and the degree of Recovery theory diagram.
Combined with the evaluation standards of water
consumption ratio, the actual water consumption
ratio in east of D pure oil area can be concluded as
follows: In the early stage of water flooding
development, the water consumption ratio is small.
Water consumption ratio is less than 0.2 that be into
the low phase of water content, and it is belonged to
first level. During 1981-1984, water consumption
ratio increases, which be into the high phase of
water content. It is belonged to second level.
However, water consumption ratio increases rapidly
in the high phase of water content. The average level
is 5.13, and the highest level is 7.995, which is
belonged to the second level. The oilfield entered a
special period that has extra high water cut period in
2003. At the same time, water consumption ratio
remains high level, which average is 12.683, and it
gets the peak of water consumption ratio in 2011
that is 15.814. The utilization ratio of oilfield water
injection is not high and it fall into three levels. The
target block is in urgent need of various adjustments
and various measures are taken to improve the water
injection efficiency so as to maintain the cyclic
development of the oil field. The theoretical chart of
the relation curve between the water consumption
index and degree of reserve recovery curve and the
actual data in the east of D pure oil area are shown
in Figure 2.
In the early stage of oilfield development, natural
energy was sufficient. However, at that time, the
number of injection wells was small, and the
injection volume of each well was also small. So it
leaded to water consumption ratio was low in the
oilfield of water injection development. However,
the water consumption index showed an upward
trend and the rate of increase accelerated about in
the 1981. After 1989, the water consumption rate
showed a downward trend, the final recovery ratio
was from the original 35% to 40%. After, along the
curve of 45% recovery ratio upward, and utilization
of injected water was increased. It improved the
development effect of oilfield water injection
development methods and increased oil recovery
ratio. After the measures were improved in 2011, the
water consumption ratio of the oilfield fell again. It
made the sliding result closer to the curve that final
recovery ratio was 50%.
5 EVALUATION OF WATER
DRIVE INDEX
Water drive index refers to withdraw water storage
of underground 1m
3
crude oil, expression with the
formula is:
wo i w o o
=RQQQB
(3-1)
In the formula: R
wo
——water drive index,
10
4
m
3
/10
4
m
3
;
Q
i
——water injection in the
period, 10
4
m
3
;
Q
w
——water production in the
period, 10
4
m
3
;
Q
o
——oil production in the
period, 10
4
m
3
Put the formula of injection and production ratio
woo
=
i
ZQ Q QB
(3-2)
The formula of water cut
wwwo
fQQQ
(3-2)
Substitute formula 3-1, after finishing:
wo
=1
1
w
ow
f
RZ Z
Bf
(3-4)
The actual water drive index and water cut data
in the eastern part of the D pure oil zone are plotted
on the theoretical chart of the relation between water
drive index and water cut, as shown in Figure 3.
The Quantitative Characterization and Evaluation of Water Flooding Efficiency of D Oilfield
253
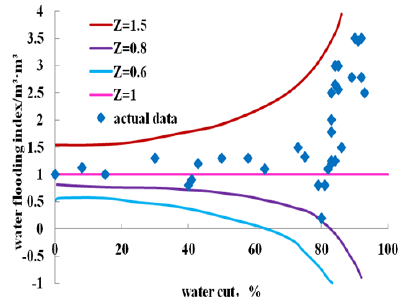
Figure 3: Relationship curve between water flooding
index and water cut.
During the development of water injection
oilfield, when the value of the effective of water
drive index is less than 0, the water injection has not
played the role of displacing oil. When the value of
the effective of water drive index is more than
1.0,the stage belongs to the stage of intensification
water injection,and the increasing of net volume of
the underground water injection is much greater than
the underground volume of the crude oil produced in
oilfield. When the value of the effective of water
drive index is between 0 and 1, the stage belongs to
the development stage of combination drive. The
greater the value of the water drive index, the
stronger the role played by water flooding.
Comparing the actual relationship between the
water drive index and the water content in the
eastern stage of D pure oil block with the theoretical
chart, the following conclusions can be drawn: in the
early period of the development of water injection
oilfield, the value of water drive index keeps around
1, and the value of injection-production ratio of the
block is also around 1.0. At this stage, the block is in
the stage of full water flooding, and this stage has
better effect of water injection development.
However, in the middle period of development of
water injection oilfield, the water drive index is less
than 1.0, and the injection-production ratio also
trends to 0.8. It is confirmed that there is a
phenomenon of underground depletion in the oil
field. Therefore, in order to increase the water drive
index, the injection-production ratio must be
increased. It is advisable to close high capacity
channel and other adjustment measures to prevent
inefficient circulation and invalid water injection; in
the later period of development of water injection
oilfield, when the target block has entered the stage
of high water content, the value of water drive index
has a significant range. The increasing trend has
risen to around 2~3.5. However, this cannot be
simply considered that the water flooding effect of
the target block is getting better and better, as some
adjustment measures are often taken in the later
period of development of water injection oilfield,
and the storage ratio of water injection in oilfield
will rapidly fluctuate greatly. Water drive index
alone cannot be used to evaluate the effect of water
flooding development in oilfield.
6 CONCLUSIONS
This paper makes a technical evaluation of the water
injection efficiency of the target block from the
storage ratio of injected water, water consumption
ratio, and water drive index.
(1) Storage ratio of injected water. The oil field
is gradually changing from the traditional mining
mode to the mining mode of water injection
development. In the initial period of oilfield
development of taking natural energy mining into
production, the declined speed of storage ratio of
injection water of oilfield is slowly, however, the
water injection utilization of oilfield is highly. In
this stage, the development effect of oil recovery is
relatively good in oilfield. However, due to the
accumulation of the contradiction between layers,
the oilfield is becoming prominent increasingly, and
this led to the value of storage ratio of injection
water beginning to show a decreasing trend. The
development effect of oilfield water injection
development methods is deteriorated. When the
oilfield is undergoing comprehensive improvement
and governance, the value of the storage ratio of
injection water has some room for growth. In
present, we can get the conclusion from the current
overall trend of storage ratio of injection water, it is
recommended that when implementing various
measures on the oilfield of stable oil, in order to
make the injected water use reasonably, the water
control work (such as water shutoff, etc.) should be
emphasized, to maintain the sustainable
development of each major oilfield.
(2) Water consumption ratio. Combined
evaluation standards of water consumption ratio,
analysis the actual water consumption ratio in east
of D pure oil area can be concluded as follows: In
the early stage of water flooding development, the
water consumption ratio was small. Water
IWEG 2018 - International Workshop on Environment and Geoscience
254
consumption ratio was less than 0.2 that be into the
low phase of water content, and it belonged to first
level. During 1981-1984, water consumption ratio
increased, which be into the high phase of water
content. It belonged to second level. However, water
consumption ratio increased rapidly in the high
phase of water content, which belonged to the
second level. The oilfield entered a special period
that was extra high water cut period in 2003. At the
same time, water consumption ratio remained high
level. The utilization ratio of oilfield water injection
was not high and it fall into three levels. The target
block is in urgent need of various adjustments and
various measures are taken to improve the water
injection efficiency so as to maintain the cyclic
development of the oil field.
(3) Evaluation of water drive index. In the early
period of the development of water injection oilfield,
the value of water drive index keeps around 1, and
the value of injection-production ratio of the block is
also around 1.0. At this stage, the block is in the
stage of full water flooding, and this stage has better
effect of water injection development. However, in
the middle period of development of water injection
oilfield, the water drive index is less than 1.0, and
the injection-production ratio also trends to 0.8. It is
confirmed that there is a phenomenon of
underground depletion in the oil field. Therefore, in
order to increase the water drive index, the injection-
production ratio must be increased. It is advisable to
close high capacity channel and other adjustment
measures to prevent inefficient circulation and
invalid water injection; in the later period of
development of water injection oilfield, when the
target block has entered the stage of high water
content, the value of water drive index has a
significant range. The increasing trend has risen to
around 2~3.5. However, this cannot be simply
considered that the water flooding effect of the
target block is getting better and better, as some
adjustment measures are often taken in the later
period of development of water injection oilfield,
and the storage ratio of water injection in oilfield
will rapidly fluctuate greatly. Water drive index
alone cannot be used to evaluate the effect of water
flooding development in oilfield.
ACKNOWLEDGEMENT
This paper is supported by Heilongjiang Province
Natural Science Foundation Project (E201407).
REFERENCES
Chen Bo, Yang Heng, Zhang Yin and Zha Yuqiang 2012
A method of utilizing water consumption rate to
evalution edge-bottom water reservoir waterflooding
development effect[J] Petrochemical Industry
Application 31(03) 39-42
Fu Ming, Liao Maolin and Liu Dehua 2017 Correction
and application of theoretical chart of stage water
drive index and water storage rate[J] Contemporary
Chemical Industry 46(09) 1852-1854+1858
Jiang Yuanzheng, Jin Shuanlian, Yang Xiaogang, Wang
Bo and Sun Wupeng 2009 The evaluation way for
water storage rate and water drive index of water
injection effect in ultra-low perm eavility[J] Journal of
Southwest Petroleum University(Science &
Technology Edition) 31(06) 63-65+209
Lu Bi 2015 Evaluation of W water drive reservoir
development effect and adjustment of injection
production system[D] Southwest Petroleum University
Ma Jing, Zhang Wen and Liu Shufen 2016 Evaluation of
water flooding development effect by using water
storage rate and water drive index[J] Contemporary
Chemical Industry 45(02) 387-389
Pang Yujin and Wang Maoxian 2005 Using water storage
and water drive index to evaluate the effect of water
flooding oilfield[J] Tuha Oil & Gas 01 37-39
Sun Jiwei, Sun Jianping, Xie Yunlong and Xun Xuepin
1998 The development of theoretical chart of water-
consumption-index and its application in water-
flooding oilfield[J] Xinjiang Petroleum Geology 04
72-73+85-86
Sun Wei 2017 Evaluation of water drive effect by using
water storage rate and water drive index[J] Inner
Mongolia Petrochemical Industry 43(04) 59-61
Wang Mingfang, Fu Rongquan, Niu Qing, Wang Huiwei
and Gu Chunlei 2004 Study on the change
characteristics of water retention and water drive
index in the late stage of ultra high water cut in
Shuanghe Oilfield Huang Xiayang[J] Henan oil S1
31-32; 2 97-107
Wang Zuoqian and Huang Shunv 2011 Theoretical
relationship between cumulative water storage rate,
cumulative water drive index and water cut[J]
Xinjiang Petroleum Geology 32(01) 57-59
Yuan Dong, Ge Lizhen, Lan Lichuan, Yang Qinghong and
Qin Wei 2008 Water-flooding efficiency evaluation by
generalized water storage rate and generalized water
drive indes[J] China Offshore Oil and Gas 03 178-180
The Quantitative Characterization and Evaluation of Water Flooding Efficiency of D Oilfield
255
