
A Method for Prediction of the Planar Distribution of Liquid
Hydrocarbons in Shale Gas: A Case Study in Duvernay Shale in the
West Canadian Sedimentary Basin
Houqin Zhu
*
, Yuzhong Xing
and Xiangwen Kong
Research Institute of Petroleum Exploration and Development, PetroChina, Beijing.
Email: zhuhouqin@petrochina.com.cn
Keywords: Liquid hydrocarbon, pyrolysis experiment, hydrogen index, planar distribution, Duvernay Shale, West
Canadian Sedimentary Basin (WCSB)
Abstract: The pyrolysis experiment data and production data are applied to predict the planar distribution of liquid
hydrocarbons in shale gas. On the basis of the variation of pyrolysis experiment parameters of samples
before and after extraction, the quantitative relations of △S2 with Ro, △S2/S2 with Ro, △HI with Ro and
△HI with HI
unextracted
are established and HI
unextracted
is corrected. Combined with the production data, the
quantitative relation of HI with CGR is established. The planar distribution diagram of HI values is plotted,
and based on the division standard for different grade of liquid hydrocarbons, the planar distribution of
different grade of liquid hydrocarbons is predicted quantitatively. The results indicate that, (1) the pyrolysis
comparison experiments before and after extraction indicate that △S2, △S2/S2 and △HI have a good
correlation with Ro, △HI also has good correlation with HI
unextracted
, and these quantitative relations can be
used to correct HI
unextracted
. (2) The corrected HI has a very good correlation with CGR, and the planar
distribution of all grades of liquid hydrocarbons can be predicted according to HI. (3) The dry gas is
distributed mainly in the structural deformation belt and Leduc ring reef belt. The northeast region of the
study area is mainly a rich oil region. Gas condensate, rich gas condensate and very rich gas condensate are
distributed in NW-SE banded shape from Simonette to Willesden Green.
1 INTRODUCTION
According to the practices in the North America,
quantitative evaluation on planar distribution of
liquid hydrocarbons and enhancement of well fluid
deliverability are effective ways to improve the
economic profit of shale gas exploration and
development, in addition to technical progress. As is
known, prior to shale gas exploration and
development, shale was always considered as the
source rock for conventional reservoir. Thus there
are plenty of geochemical and logging data.
Typically, the pyrolysis data can be acquired easily,
fast and accurately with low cost. With the pyrolysis
data, together with production performance data, the
planar distribution of liquid hydrocarbons can be
predicted quantitatively. Then, in combination with
the shale facies research and the existing
drilling/completion technologies, cost reduction and
benefit improvement can be achieved in shale gas
exploration and development.
Rokosh et al. (2012) divided the Duvernay shale
in the WCSB into four regions, i.e. Gas Maturity,
Liquid Maturity, Oil Maturity and Immature,
according to the kerogen thermal genetic theory and
the Ro data (Rokosh et al., 2012). However, the
thermal maturity can simply be used to qualitatively
judge whether there is a potential of liquid
hydrocarbon in the region, while the shale oil and
gas operators and investors care more about whether
the shale is dominated by liquid hydrocarbon or gas
and how much liquid hydrocarbons are endowed.
The liquid hydrocarbon refers to condensate oil
herein.
The main purpose of this paper is, with the
Duvernay shale in WCSB as an example, to
establish the relations of HI vs. CGR, based on the
pyrolysis and production performance data, and use
these relations to predict the planar distribution of
Zhu, H., Xing, Y. and Kong, X.
A Method for Prediction of the Planar Distribution of Liquid Hydrocarbons in Shale Gas - A Case Study in Duvernay Shale in the West Canadian Sedimentary Basin.
In Proceedings of the International Workshop on Environment and Geoscience (IWEG 2018), pages 261-266
ISBN: 978-989-758-342-1
Copyright © 2018 by SCITEPRESS – Science and Technology Publications, Lda. All rights reserved
261
liquid hydrocarbons. On the basis of this, a set of
quantitative evaluation method is proposed
quantitative evaluation on liquid hydrocarbons in
shale.
2 GEOLOGIC SETTING
The West Canadian Sedimentary Basin (hereinafter
abbreviated to WCSB) is a typical wedge-shaped
foreland basin and covers an area of 170×10
4
km
2
.
WCSB is located between the Canadian Shield and
Cordillera fold mountain system. The Rocky
Mountain piedmont thickness is larger than 6000m
in Albert and British Columbia (Jarvie et al., 2010;
Shannon et al., 1989). WCSB can also be divided
into two parts such as Albert Basin and Williston
Basin. The study area is located in the central west
of Albert and the slope belt of WCSB, where the
strata are gentle and their burial depth is
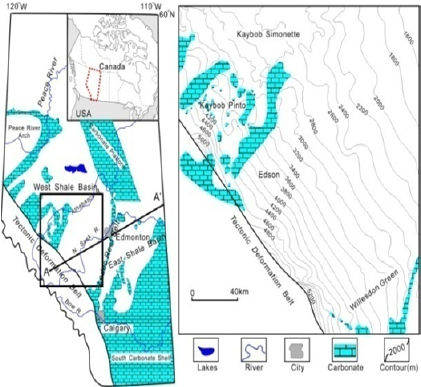
1400~5500m. The study area is located in the
central west of Albert and the slope belt of WCSB,
with gentle formations buried at 1400~5500m
(Figure 1).
Figure 1: Regional location map of the study area
(modified as per reference Jarvie et al., 2010 (
Jarvie et al.,
2010
).
Duvernay shale is a set of dark brown or black
organic-rich shale deposited in the maximum
transgression period of Upper Devonian Woodbend
Group. The shale and Leduc reefs deposited
simultaneously. Large scale transgression occurred
in the sedimentary period of Woodbend Group,
apron reefs were mainly developed near the Peace
River structural belt, the lithology inside the basin
was deepwater limestone and shale, and Leduc reefs
were characterized by patch reefs, and appeared
mainly in the shallow water area on the carbonate
platform and the west margin of the basin. At the
end of the sedimentary period of Woodbend Group,
the approximate 325km long NE-trending Rimbey-
Meadowbrook reef belt across Edmonton Region
divided Albert Basin into east and west shale basins
(Mossop and Shetsen, 1994).
The WCSB has evolved in three stages, i.e.
stable craton platform from pre-Cambrian to Middle
Jurassic, foreland from Middle Jurassic to Eocene,
and intra-craton basin from Eocene to the present.
3 DATA AVAILABLE AND
METHODS
3.1 Data Available
For this study, pyrolysis data of 40 wells (including
Beaton data in 2010) (Beaton et al., 2010) were
acquired, including 3 wells with data both before
and after extraction (whole core pyrolysis
experiment for 2 wells, and cutting pyrolysis
experiment for 1 well), and 37 wells with data
before extraction, and production data of 67 wells
were acquired. Among these wells, 32 wells have
both pyrolysis data and CGR data.
3.2 Methods
According to the geochemical theory, with the
pyrolysis, together with the production performance
data, the planar distribution of hydrocarbons at
different grades in the Duvernay shale is
quantitatively predicted. Based on the variation of
pyrolysis experiment parameters of samples before
and after extraction, the quantitative relations of
△S2 with Ro, △S2/S2 with Ro, △HI with Ro and
△HI with HI
unextracted
are established, and then
HI
unextracted
is corrected. Combined with the
production data, the quantitative relation between HI
and CGR is defined, and the HI division standard for
liquid hydrocarbons at different grades is clarified.
According to the division standard and the planar
distribution map of HI, the planar distribution of
liquid hydrocarbons at different grades is predicted
quantitatively (△S2=S
2unextracted
-S
2extracted
,
△HI=HI
unextracted
-HI
extracted
).
IWEG 2018 - International Workshop on Environment and Geoscience
262
4 RESULTS AND DISCUSSIONS
4.1 HI Correction
Espitalie et al. (1977) firstly proposed a rock
pyrolysis method for obtaining S1 and S2 which
respectively denote the amount of free or adsorbed
hydrocarbons in source rocks and the amount of
hydrocarbons generated from kerogen pyrolysis so
as to reflect the hydrocarbon generation capacity of
mature source rocks (Espitalie et al., 1980). S1 is
corresponding with the hydrocarbons volatilized
during heating to ≤300℃ in a Rock-Eval experiment,
and they are basically C7-33 hydrocarbons; S2 is
corresponding with the hydrocarbon yields from
pyrolysis during heating to >300℃ in the Rock-Eval
experiment. Delvaux et al. (1990) made some
modifications on the definition and normalized the
experiment results of the amount S1 of free or
adsorbed hydrocarbons and the amount S2 of
hydrocarbons generated from kerogen pyrolysis
(Delvaux et al., 1990). Dan Jarvie (1987), Lafargue E.
et al. (1998), Behar F. et al. (2001)
(Dan, 1984;
Lafargu et al., 1998; Behar et al., 2001) believed that
S2 was hydrocarbons released during the pyrolysis
of kerogen between 300 and 550 or 600 degrees C
with a linear temperature gradient usually between
25 and 30 degrees C per minute. Wang Anqiao et al.
(1987) found that the value of S2 after chloroform
extraction was less than that before chloroform
extraction through the comparison of a direct
pyrolysis experiment on a source rock sample with a
pyrolysis experiment on it after chloroform
extraction (Wang and Zheng, 1987). This indicates
that there are some liquid hydrocarbons in S2; due to
the adsorption and swelling action of organic
matters and too high boiling point of part liquid
hydrocarbons (boiling point of n-C18 302℃), these
liquid hydrocarbons cannot be evaporated out
at<300℃ in a Rock-Eval experiment. Delvaux et al.
(1990) also obtained the same conclusion from their
studies. According to the conclusion, part
macromolecular substances belonging to free
hydrocarbons S1 such as asphaltene and colloid in
crude oil have similar pyrolysis hydrocarbon
temperature during heating in a conventional sample
pyrolysis experiment, so that the experiment value
of free hydrocarbons S1 is relatively low while that
of pyrolysis hydrocarbons S2 is relatively high. The
determination of S2 is complicated by the retention
of some of the generated hydrocarbons by the rock
matrix, and thus HI (hydrogen index=S2/TOC×100)
will not give the true ratio of pyrolyzable
hydrocarbons to organic carbon unless appropriate
correction is made (Langford et al., 1990). The best
treatment method is to resample and conduct a post-
extraction pyrolysis experiment, but this will waste a
lot of original pyrolysis data. In this paper, the
regularity of all analytical data has been discussed
on the basis of the analysis of core pyrolysis
experiment data on two wells, and relevant formulas
have been fitted to correct HI.
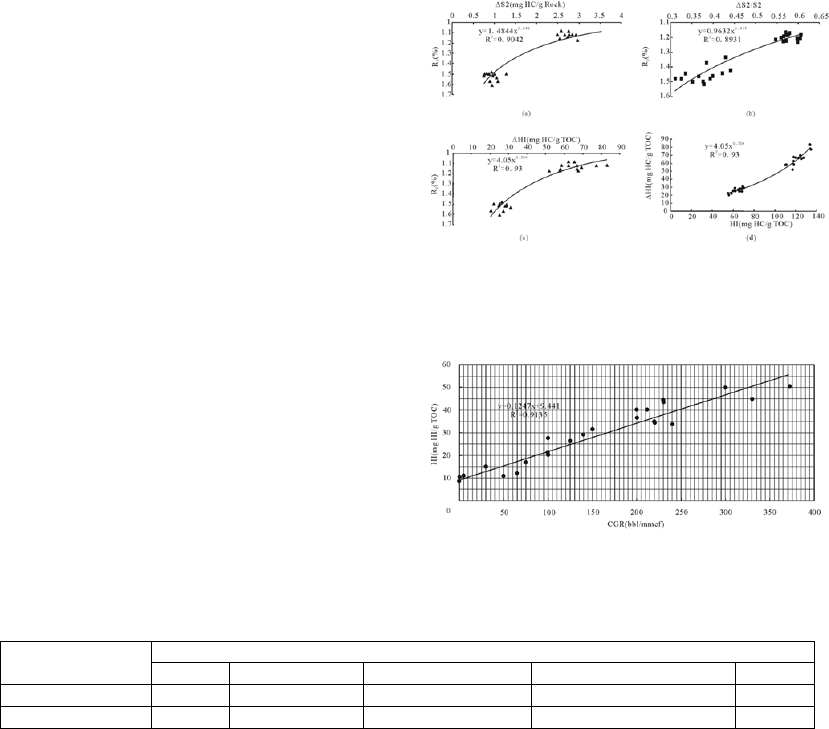
The comparative experiments on the full cores of
two wells before and after extraction show a large
difference, the S2 difference (△S2) is 0.75~3.52mg
HC/g Rock and the HI difference (△HI) is
20.54~82.97mg HC/g TOC. △S2, △S2/S2 and △HI
show power decrease with Ro with correlation
coefficient of 0.9, 0.9 and 0.93 respectively (Figure
2a~2c), i.e. the larger Ro is, the smaller △S2,
△S2/S2 and △HI are. △HI increases exponentially
with HI
unextracted
(Figure 2d) with a correlation
coefficient of 0.98, the larger HI
unextracted
is, the
larger △HI is. According to the above-mentioned
correlations, it is feasible that HI can be corrected by
fitting relation.
Based on the formula HI=S2/TOC×100(mg
HC/g TOC) and the above analysis, multiple
methods can be used to correct HI.
4.1.1 To Calculate HI by Correcting S2
According to the above analysis, S2=S
unextraced
-△S2,
where △S2 can be calculated from the regression
formula of △S2 with Ro, i.e. Ro = 1.4844×△S2
0.248
.
In addition, S2 can also be calculated from
△S2/S2. Let △S2/S2=K
S2recovery coefficient
, and then
S2=S2
unextracted
- KS
2recovery
coefficient
×S2
unextracted
=S2
unextracted
×(1-K
S2recovery coefficient
),
where K
S2recovery coefficient
can be calculated according
to the regression formula of Ro with △S2/S2, i.e.
Ro= 0.9632×K
S2recovery coefficient
0.413
. Substitute the
corrected S2 into the HI calculation formula to
calculate HI.
4.1.2 Direct HI Correction
Calculate △HI according to the regression formula
of △HI with HI, i.e. △HI=4.05× HI
unextracted
0.304
,
HI
correction
=HI
unextracted
-△HI.
A Method for Prediction of the Planar Distribution of Liquid Hydrocarbons in Shale Gas - A Case Study in Duvernay Shale in the West
Canadian Sedimentary Basin
263
4.2 Relation of HI with CGR
According to the viewpoints of Tissort et al. (1977),
the higher the thermal evolution degree, the smaller
the residual kerogen amount and the lower the
content of hydrocarbons S2 generated from
pyrolysis (Tissot and Welte, 1984). Therefore, the
ratio of S2/TOC can reflect the fact that the higher
the maturity, the smaller the value, the worse the
residual hydrocarbon generation capacity and the
lower the hydrocarbon generation amount. The oil
and gas produced from shale are the residual
hydrocarbons generated from thermal evolution of
organic matters in shale and not migrated, and the
amount of the residual hydrocarbons is affected by
conversion and hydrocarbon generation of organic
matters. The smaller the hydrocarbon generation
capacity of the residual organic matter is, the more
the shale oil and gas reserves may be. The HI of
kerogen which has experienced thermal evolution to
some extent is just used to calibrate the level of
liquid-rich hydrocarbons in shale based on the
characteristic of shale oil and gas such as self-
generating and self-preserving so as to finally
achieve the purpose of quantitative research.
Therefore, the relation of HI with CGR can be
established using the method of combining the HI of
kerogen with the shale oil and gas production of a
single well. The relation of HI with CGR of
Duvernay shale is established according to the
collected CGR and the corrected HI (Figure 3). As
shown in the figure 3, CGR has a linear relation with
HI, their correlation coefficient is up to 0.91,
showing a very good correlation.
4.3 Prediction of Planar Distribution of
Liquid-Rich Hydrocarbons
The shale oil/gas in the study area is mainly
condensate oil, thus the grading of liquid-rich
condensate can forecast the highly economic liquid-
rich region. Due to difficult recovery, complicated
operation modes and high E&D cost, the
conventional liquid hydrocarbon grading is no
longer suitable for the expensive shale oil/gas
exploration evaluation. The liquid hydrocarbon
grading in this paper is defined with consideration to
the economic profit in field practices. Specifically,
the fluids produced from a well are divided into five
grades according to CGR, i.e. dry gas, gas
condensate, rich gas condensate, very rich gas
condensate and rich oil. The quantitative relation
between HI and CGR is used to confirm the
threshold value of kerogen HI for the five grades of
liquid hydrocarbons (Table 1).
The planar distribution of liquid hydrocarbons at
all grades can be plotted on the basis of the planar
map of HI, and according to the liquid hydrocarbon
CGR division standard, or plotted directly with the
planar map of HI and according to the liquid
hydrocarbon HI division standard. The latter method
is adopted in this study, because the correlation
between the parameters and HI is good but not
100%, which will cause large error after multiple
calculations.
Figure 2: Relation chart of pyrolysis experiment
parameters.( (a) Relation of △S
2
with Ro; (b) Relation of
△S
2
/S
2
with Ro; (c) Relation of △HI with Ro; (d) Relation
of △HI with HI)
Figure 3: Relation chart of CGR with HI.
Table 1: Division standard for grades of liquid hydrocarbons in Duvernay shale.
Parameter Grade of liquid-rich hydrocarbons
Dry gas Gas condensate Rich gas condensate Very rich gas condensate Rich oil
CGR(bbl/MMcf)
*
<5 5~65 65~140 140~250 >250
HI(mg/g) <10 10~18 18~27 27~40 >40
* From Duvernay reserves and Resources Report (2016)
IWEG 2018 - International Workshop on Environment and Geoscience
264
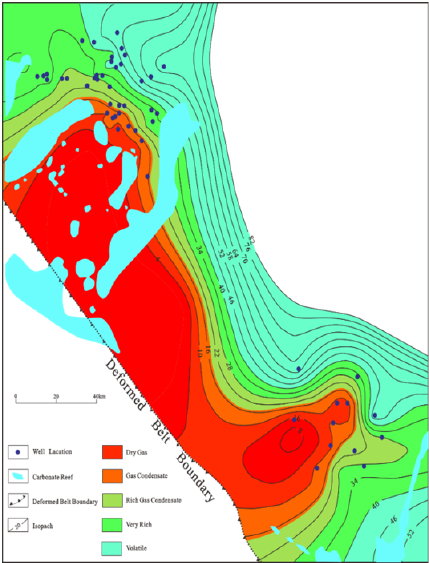
The kerogen HI increases from the deformed belt
in the southwest to the northeast (Figure 4). Pinto
along the Leduc ring reef belt is in the CH4
generation stage due to relatively high thermal
evolution degree, and the corresponding HI in the
area is low, generally less than 10 mg HC/g TOC.
Controlled by the deformed belt, Edson and local
areas in South-eastern Willesden Green show high
thermal evolution degree, thus the residual kerogen
pyrolysis hydrocarbon is less in the shale. In
Simonette and mostly Willesden Green, the organic
matters are in the condensate gas-wet gas generation
stage, showing the largest rate of conversion from
kerogen to hydrocarbon.
Figure 4: Planar distribution of HI values and all levels of
liquid hydrocarbons.
All five grades of liquid hydrocarbons are
observed in the study area, and they distribute
distinctively in zones from the deformed belt to the
northeast of the study area (Figure 4). In the region
close to the deformed belt and the Leduc ring reef
belt, dry gas is dominant. In the region within the oil
generation threshold in the northeast, rich oil is
dominant. The condensate oil, rich condensate oil
and very rich condensate oil distribute as bands in
NW-SE from Simonette to Willesden Green. The
dry gas region can serve as the reserve area, which
can be developed in case of allowable economic and
technical conditions. The rich oil region where
liquid oil is dominant is not an ideal target due to
proximal high clay mineral content, difficult drilling,
high recovery cost and low recovery rate. The rich
condensate oil and extra-rich condensate oil regions
are the primary targets in the near future. The
prediction results basically match the actual
production performance of active wells.
5 CONCLUSIONS
Based on the geochemical theory, together with the
pyrolysis data and well production data, the prediction
of the planar distribution of liquid-rich hydrocarbons in
Duvernay Shale is conducted. Some conclusions are
made as follows.
According to the pyrolysis comparison
experiments before and after extraction, △S2,
△S2/S2 and △HI have a good correlation with Ro,
△HI also has good correlation with HI
unextracted
, and
these quantitative relations can be used to correct
HI
unextracted
.
The corrected HI has a very good correlation
with CGR. The quantitative division standard for
liquid hydrocarbons has been established according
to production data, and the planar distribution of all
levels of liquid hydrocarbons can be predicted
according to HI.
The dry gas region is distributed mainly in the
tectonic deformation belt and Leduc ring reef belt.
The northeast region of the study area is mainly a
rich oil region. Gas condensate, rich gas condensate
and very rich gas condensate are distributed in NW-
SE banded shape from Simonette to Willesden
Green.
ACKNOWLEDGMENT
This work was supported by China National Science
and Technology Major Project (Grant No:
2011ZX05028-002) and CNPC Key Science and
Technology Project (Grant No: 2013E-050102). We
are grateful to authors for their research findings
cited in the paper. We also thank the anonymous
reviewers and the editors for their constructive
comments and suggestions, which improved the
manuscript.
A Method for Prediction of the Planar Distribution of Liquid Hydrocarbons in Shale Gas - A Case Study in Duvernay Shale in the West
Canadian Sedimentary Basin
265
REFERENCES
Beaton A P, Pawlowicz JG and Anderson S D A 2010-07
Organic Petrography of the Montney Formation in
Alberta. Shale Gas Data Release. ERCB/AGS Open File
Report
Behar F, Beaumont V And Penteado H L De B 2001 Roch-
Eval 6 technology: Performances and
development.Oil&Gas science and technology 56(2) 111-
134
Dan Jarvie 1984 Application of the Rock-EVAL III oil show
analyzer to the study of gaseous hydrocarbons in an
Oklahoma gas well. Presented at the 187th American
Chemical Society National Meeting, Geochemistry
Division. St. Louis, Mo
Delvaux D, Martin H and Leplat P 1990 Comparative rock-
eval pyrolysis as an improved tool for sedimentary
organic matter analysis. Orangic Geochemistry 16(4-6)
1221-12294
Espitalie J, Madec M and Tissot B 1980 Role of mineral
matrix in kerogen pyrolysis: influence on petroleum
generation and migration. AAPG 64 59-66
Jarvie D M, Philp R P and Jarvie B M 2010 Geochenical
assessment of Unconventional Shale resource plays, North
America Special Issue on Shale Resource Plays due out
2nd quater
Lafargue E, Marquits F and Pillot D 1998 Rock-eval 6
applications in hydrocarbon exploration, production, and
soil contamination studies. Revue de l’institut français du
pétrole 53(4) 421-437
Langford F F and Blanc M M 1990 Interpreting rock-eval
pyrolysis data using graphs of pyrolizable hydrocarbons
Vs. total organic carbon. AAPG 74(6) 799-804
Mossop G and Shetsen I 1994 Atlas of theWestern Canada
Sedimentary Basin (Calgary: Canadian Society of
Petroleum Geologists and the Alberta Research Council)
chapter 3-12 pp 22-202
Rokosh C D, Lyster S, Anderson S D A 2012-06 Summary of
Alberta's Shale- and Siltstone-Hosted Hydrocarbons,
ERCB/AGS Open File Report
Shannon P M and Naylor D 1989 Petroleum Basin
Studies(London) 41-57
Tissot B and Welte D H 1984 Petroleum formation and
occurrence, Springen, Berlin Heideberg New York 131-
160
Wang anqiao and Zheng Baoming 1987 Calibration of
analytic parameters for pyrolytic chromatography (in
Chinese with English Abstract). Experiment Petroleum
Geology 9(4) 342-350.
Yao T, Walter B A and William D M 2013 The Eagle ford
shale play, South Texas: Regional variations in fluid types,
hydrocarbon production and reservoir properties.
IPTC16808 1-12
IWEG 2018 - International Workshop on Environment and Geoscience
266
