
Experimental Study on Desorption Characteristics of Methane in the
Soft and Hard Layer Coal of Stratified Structure in the Northwest of
Guizhou, China
Xijian Li
1, *
, Kegang Ling
2
and Peng Pei
1,3
1
School of Mining, Guizhou University, Huaxi, Guiyang, Guizhou 550025, China;
2
Department of Petroleum Engineering, University of North Dakota, 243 Centennial Dr., Upson II Room 366, Grand
Forks, ND 58202, USA;
3
Institute for Energy Studies, University of North Dakota, 243 Centennial Dr., Upson II Room 366, Grand Forks, ND
58202, USA.
Email: 575914635@qq.com
Keywords: Soft and hard coals of stratified structure, coal gas outburst, coal gas mining, coal gas desorption
characteristic
Abstract:
Based on the importance of coal gas desorption characteristics to coal bed methane mining, extraction, and
prevention and control of coal and gas outburst, the coal samples from the soft and hard layer of stratified
structure in the northwest of Guizhou were selected as research subjects, and a High Capacity
Adsorption(HCA) device using high pressure capacity method was utilized to perform research on
adsorption characteristics of the soft and hard layer coal under different temperatures and pressures.
Seventy-two experiment groups have been carried out. The characteristics and rules of gas desorption of the
soft and hard layer coal were analyzed comprehensively. The results showed that the gas desorption rate of
the soft and hard layer coals was highest within the first minute after coal body was exposed or gas pressure
was relieved, and gas desorption volumes increase almost linearly, then leveled off. The gas desorption of
the soft and hard layer coals took place in the first 30 minutes after coal body was exposed or gas pressure
was relieved, and the first minute gas desorption volumes accounted for 62.67-86.06% of the first two- hour
gas desorption volumes. The initial gas desorption rate, the cumulative volume, and the desorption
proportion of different time periods were affected by temperature and pressure, and increased slightly with
the increase of temperature and pressure. Under the conditions of same temperature and pressure, the initial
gas desorption rates of the soft layer coal were 1.282-1.892 times of the hard. The cumulative gas
desorption of the hard layer coal would exceed that of the soft at the end of desorption. The shortest
desorption process can happen in 10 minutes. The results provide a reference and guideline to coal gas
mining and gas outburst control in the northwest of Guizhou.
1 INTRODUCTION
Although there are vast amounts of coal resources
and tremendous coal mining projects in Guizhou
province of China, the coal seams distribute in
complex geological settings, and disasters due to
coal and gas outburst accidents occur more
frequently than other places (
Li, 2013; Heng et al.,
2015). A critical overview of a large number of coal
and gas outburst cases shows that occurrences of
these outbursts are closely related to complicated
geological structure (
Li and Shi, 2013; Li and Lin, 2010;
Liu et al., 2015). Numerous investigations done by
scholars around the world have shown that
tectonically deformed coal has a strong gas diffusion
ability, high gas desorption rate, high porosity,
various strength, and favorable dynamic and
mechanical conditions of gas accidents(
Li et al., 2013;
Li, 2011; Wei et al., 2008; Cao et al., 2013; Wang and Sun,
2015; Liang et al., 2014; Gao and Tan, 2015; Liu and Liu,
2015
). Therefore, to prevent or control gas outburst
in tectonically deformed coal, understanding the gas
desorption characteristics of the coals is the key to
gas control work (Li et al., 2010; Li et al., 2014; Xie
304
Li, X., Ling, K. and Pei, P.
Experimental Study on Desorption Characteristics of Methane in the Soft and Hard Layer Coal of Stratified Structure in the Northwest of Guizhou, China.
In Proceedings of the International Workshop on Environment and Geoscience (IWEG 2018), pages 304-313
ISBN: 978-989-758-342-1
Copyright © 2018 by SCITEPRESS – Science and Technology Publications, Lda. All rights reserved
and Chen, 2007; Li et al., 2011; Liu et al., 2010).
There are many coal seams in the northwest
coalfield of Guizhou, and most of them consist of
layers of stratified structure. Many of these coal
seams are thin and interlayed with layers of different
lithology. Most coal seams have high gas contents
and are close to coal seam group with coal and gas
outburst dangers. These coal seams merge and
bifurcate frequently, and their structure is
complicated with low matrix permeability and
interlayed by soft and hard intervals. In the mining
process, the volume of coalbed gas emitted in
Xiaotun coal mine in Dafang county, Qinglong coal
mine in Qianxi county and Xinglong coal mine in
Xishui county is large. Because the emission
mechanism is complicated and the control of gas
outburst is difficult, gas burst seriously threatens the
safety of underground workers. It is noted that the
gas emission from coal depends mainly upon gas
desorption characteristics. In this paper, the
experiments on gas desorption from the samples
retrieved from Xiaotun, Qinglong, and Xinglong
coal mines were conducted under different
temperatures and pressures. By contrastive
analysis on gas desorption characteristics of the
samples from the soft and hard layer coals, the
desorption mechanism and the factors that influence
desorption characteristics were revealed. The results
provide a reference and guideline to coal gas mining
and gas burst control.
2 EXPERIMENTAL METHODS
AND PROCESSES
2.1 Sample Collection and Preparation
The coal samples were collected from the soft and
hard layers of the sixth coal seams of Xiaotun coal
mine, the No. 16 coal seam of Qinglong coal mine,
and the No. 18 coal seam of Xinglong coal mine.
The coal samples were prepared according to the
sample preparation standard, GB/T212-2008, issued
by China. The coal samples were crushed, sieved,
and then put into the bottle with ground stopper and
sealed. Standard analysis, true density (TD),
apparent density (AD), initial speed of gas emission
(
△
P), speed of gas diffusion (
△
D), and firmness
coefficient ( f) of the samples are shown in Table 1.
Notes: QLSC-The soft coal of Qinglong coal mine;
QLHC-The hard coal of Qinglong coal mine;
XTSC-The soft coal of Xiaotun coal mine; XTHC-
The hard coal of Xiaotun coal mine; XLSC-The
soft coal of Xinglong coal mine; XLHC-The hard
coal of Xinglong coal mine
2.2 Experimental Methods and Steps
The selected experimental equipment was the high
pressure and capacity adsorption device HCA,
which was manufactured by Chongqing Research
Institute of China Coal Technology Engineering
Group. According to the standard MT/T752-1997,
experiments were conducted as follows:
The fresh coal samples were crushed,
sieved by the 0.2-0.25 mm standard sieve,
then the particles of sizes between 0.2-0.25
mm were put into the bottles with ground
stopper and sealed with a label.
Fifty grams of samples, with an accuracy to
0.0001 grams, were weighed and put into
dry containers and numbered, then dried for
8 hours under temperature of 85 ℃ and
pressure of 13 Pa, and then were cooled
down.
One of the dried samples was loaded into a
coal sample tank and vibrated, and the tank
was sealed and filled with high pressure gas
of 4MPa. Then the tank was put into a
water bath and checked for air-tightness.
The valve was slowly opened to release
high-pressure gas in the tank, and the tank
was connected to the degassing system,
then put into the water bath.
The temperature of water bath was
increased to 60±0.1 ℃, then the vacuum
pump was started, and the vacuum
degassing valve was slowly opened to
remove the gas from the coal sample.
After the vacuum gauge showed the
pressure was below 4 Pa, the coal sample
tank was continuously pumped for at least
4 hours, then the valve was closed, and the
vacuum unit and vacuum gauge were
turned off.
When gas desorption experiments of coal
samples were carried out, experimental methods and
steps were as follows:
Experimental Study on Desorption Characteristics of Methane in the Soft and Hard Layer Coal of Stratified Structure in the Northwest of
Guizhou, China
305

Table 1: Basic parameters of coal samples.
Coal sample name
Water content
(Mad)%
Ash content
(Aad)%
Volatile content
(Vdaf)%
TD
(g/cm
3
)
AD
(g/cm
3
)
△ P
(mmHg)
△ D
(ml)
f
QLSC 3.42 22.96 8.75 1.61 1.54 15.209 1.520 0.78
QLHC 2.18 10.06 7.14 1.51 1.43 10.053 0.850 1.223
XTSC 3.58 19.99 7.86 1.57 1.49 19.779 2.100 0.303
XTHC 1.66 12.86 6.59 1.57 1.48 12.533 1.018 0.707
XLSC 5.42 10.41 8.10 1.56 1.49 15.904 1.411 0.333
XLHC 3.15 7.58 7.50 1.43 1.37 4.961 0.470 0.673
The temperature of water bath was adjusted
to 25±1℃, and the coal sample tank was
put into the constant temperature water bath.
The inflatable tank was filled with a certain
volume of high purity gas with
concentration of 99.99%, then the valve of
gas tank was closed.
The coal sample tank was connected to the
inflatable tank and the gas pressure data
acquisition instrument. The valves of coal
sample tank and the inflatable tank were
opened, then the high purity gas flowed
into the coal sample tank.
When gas pressure of the coal sample tank
reached a set value, the valve of the coal
tank was closed, then the gas was fully
adsorbed by the coal sample at a set
temperature.
The gas pressure inside the tank was read
from the gas pressure data acquisition
instrument, and the tank was filled with gas
immediately when the pressure inside the
tank was less than the set value, until the
pressure reached the set value.
When the gas adsorption on the coal sample
lasted more than 12 hours, the gas adsorption
equilibrium experiment was finished. The
temperature of water bath was adjusted to set
values(20±1℃、30±1℃、40±1℃) before the gas
desorption volume was measured. When the
temperature of water bath reached a set value and
became constant, experiment could begin.
The cylinder scale that was used to measure the
gas desorption volume was read and recorded every
10 seconds within 1 minutes, and data were read and
recorded every 1 minute from the beginning to 30
minutes, every 5 minutes from the 31 to 60 minutes,
and every 10 minutes from the 61 to 120 minutes.
The cumulative gas desorption volume per gram per
minute measured from the beginning to 10 seconds
is the initial gas desorption rate V1(ml/(g-min)), i.e.
the gas desorption rate of coal after 10 seconds of
exposure.
3 ANALYSIS OF
EXPERIMENTAL DATA
3.1 Desorption Experiment Under
Different Experimental
Temperatures
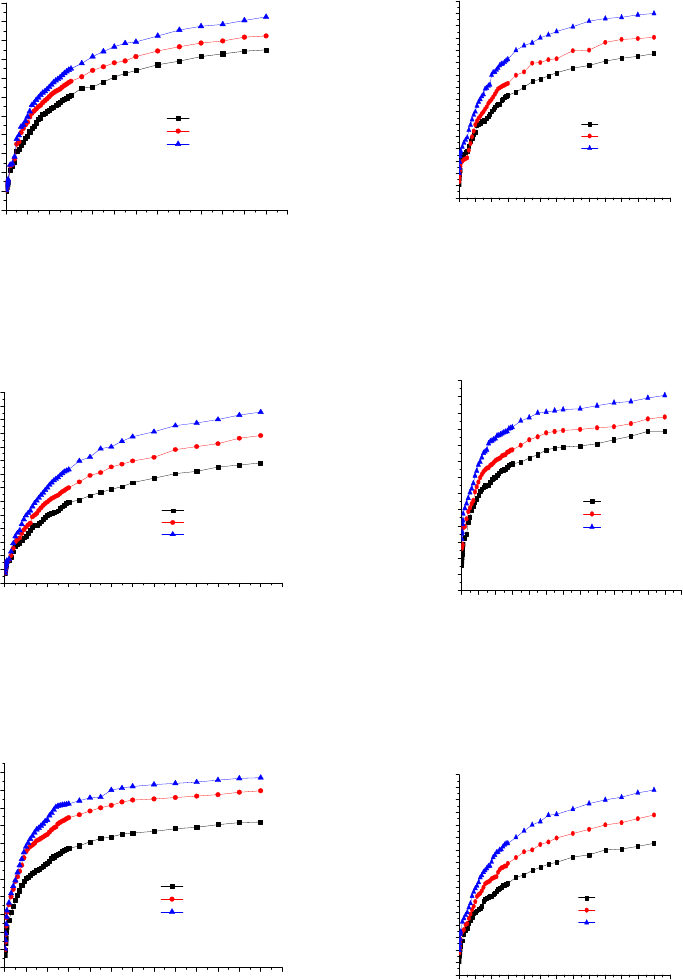
The experiments of 6 coal samples (soft and hard
layers) from 3 coal mines were carried out under
1.5MPa at 20℃, 30℃, 40℃, respectively. The
results were shown in Figures.1 to 6.
In order to study the relationship between the
initial gas desorption rates of the soft and hard coals
and the desorption temperature, the statistics
analysis were performed on the desorption data of
the soft and hard coals from Xinglong mine. The
results were shown in Table 2.
IWEG 2018 - International Workshop on Environment and Geoscience
306
0 600 1200 1800 2400 3000 3600 4200 4800 5400 6000 6600 7200 7800
0
1
2
3
4
5
6
7
8
9
10
11
t=20 ℃
t=30 ℃
t=40 ℃
Cumulative Volume (ml/g)
Time (s)
Figure 1: Desorption curves of QLSC at different
temperatures.
0 600 1200 1800 2400 3000 3600 4200 4800 5400 6000 6600 7200 7800
0
1
2
3
4
5
6
7
8
9
10
11
12
13
14
Cumulative Volume (ml/g)
Time (s)
t=20 ℃
t=30 ℃
t=40 ℃
Figure 2: Desorption curves of QLHC at different
temperatures.
0 600 1200 1800 2400 3000 3600 4200 4800 5400 6000 6600 7200 7800
1
2
3
4
5
6
7
8
9
10
11
12
Time (s)
Cumulative Volume
(
ml/g
)
t=20 ℃
t=30 ℃
t=40 ℃
Figure 3: Desorption curves of XTSC at different
temperatures.
0 600 1200 1800 2400 3000 3600 4200 4800 5400 6000 6600 7200 7800
0
1
2
3
4
5
6
7
8
9
10
11
12
13
14
15
16
Cumulative Volume
(
ml/g
)
Time (s)
t=20 ℃
t=30 ℃
t=40 ℃
Figure 4: Desorption curves of XTHC at different
temperatures.
0 600 1200 1800 2400 3000 3600 4200 4800 5400 6000 6600 7200 7800
0
1
2
3
4
5
6
7
8
9
10
11
12
13
Time (s)
C um ulative V olum e (m l/g )
t=20 ℃
t=30 ℃
t=40 ℃
Figure 5: Desorption curves of XLSC at different
temperatures.
0 600 1200 1800 2400 3000 3600 4200 4800 5400 6000 6600 7200 7800
0
1
2
3
4
5
6
7
8
9
10
11
12
13
14
15
16
Cum ulative V olum e (m l/g)
Time (s)
t=20 ℃
t=30 ℃
t=40 ℃
Figure 6: Desorption curves of XLHC at different
temperatures.
Experimental Study on Desorption Characteristics of Methane in the Soft and Hard Layer Coal of Stratified Structure in the Northwest of
Guizhou, China
307
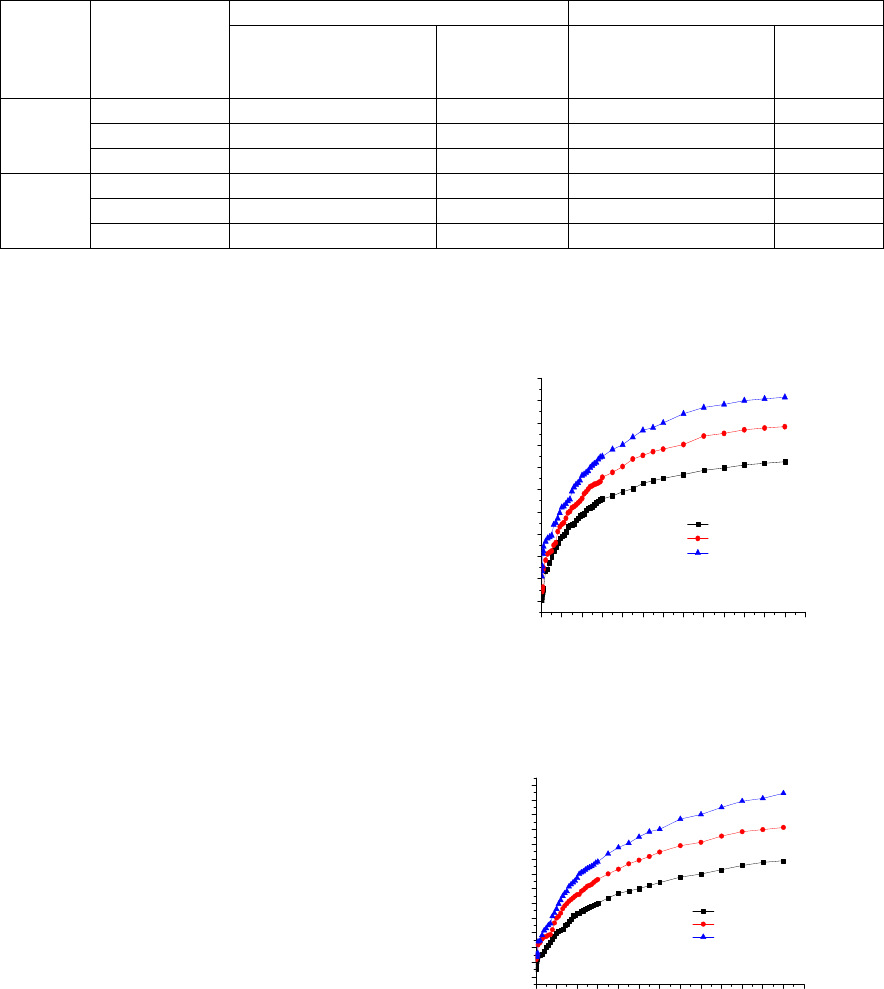
Table 2: The cumulative gas desorption volumes and percentage of XLSC and XLHC within 5 minutes (at pressure of 1.5
MPa).
Samples Temperature
0-1 min. 2-5 min.
Cumulative gas
desorption volume
(ml/g)
Percentage
(%)
Cumulative gas
desorption volume
(ml/g)
Percentage
(%)
XLSC
20±1 ℃ 2.877 29.20 2.085 20.45
30±1 ℃ 2.990 27.07 2.413 21.84
40±1 ℃ 3.154 25.64 2.89 23.50
XLHC
20±1 ℃ 2.054 17.39 1.985 16.51
30±1 ℃ 2.080 15.97 2.091 16.85
40±1 ℃ 2.192 14.71 2.579 17.31
Figures.1 through 6 showed that the curves fitted
the monotonically increasing function relationship,
in which the cumulative gas desorption volume of
the soft and hard interlayered coals increased with
the time. However, gas was desorbed quickly within
the first minute, and the desorption volume
increased almost linearly with desorption time, then
increased slightly. The gas desorption rates of the
samples from different coal mine were different. The
cumulative desorption volume increases when
temperature increases for all coal samples. ,
Table 2 showed that when desorption pressure
was kept constant, the cumulative gas desorption
volume of soft coal was 11 percentage higher than
that of hard coal. The gas desorption rate is the
highest in the first minute, and then decreased later.
Therefore, the increase of cumulative desorption
volume slowed off gradually. The cumulative
desorption volume from 2 to 5 minutes was
obviously smaller than that of the first minute under
the same temperature, but the decline rate decreased
with the increase of temperature.
3.2 Desorption Experiments Under
Different Desorption Pressures
The HCA experimental device was used, and
desorption experiments were carried out under the
temperature of 25 ℃ and the pressures of 0.74 MPa,
1.5 MPa, 3.0 MPa respectively. The experimental
results were shown in Figures.7 through 12.
In order to study the relationships between the
initial gas desorption rate (V1), cumulative gas
desorption volume and gas adsorption equilibrium
pressure, the data of desorption time from 0 to 2
hours at 25±1 ℃ were analyzed by for the soft and
hard coals from Xinglong mine, which are shown in
Table 3.
0 600 1200 1800 2400 3000 3600 4200 4800 5400 6000 6600 7200 7800
1
2
3
4
5
6
7
8
9
10
11
Time (s)
Cumulative Volume (ml/g)
P=0.74 MPa
P=1.5 MPa
P=3.0 MPa
Figure 7: Desorption curves under different desorption
pressures, QLSC.
0 600 1200 1800 2400 3000 3600 4200 4800 5400 6000 6600 7200 7800
0
1
2
3
4
5
6
7
8
9
10
11
12
13
Cumulative Volume (ml/g)
Time (s)
P=0.74 MPa
P=1.5 MPa
P=3.0 MPa
Figure 8: Desorption curves under different desorption
pressures, QLHC.
IWEG 2018 - International Workshop on Environment and Geoscience
308
0 600 1200 1800 2400 3000 3600 4200 4800 5400 6000 6600 7200 7800
1
2
3
4
5
6
7
8
9
10
11
12
Time (s)
Cumulative Volume (ml/g)
P=0.74 MPa
P=1.5 MPa
P=3.0 MPa
Figure 9: Desorption curves under different
desorption pressures, XTSC.
0 600 1200 1800 2400 3000 3600 4200 4800 5400 6000 6600 7200 7800
0
1
2
3
4
5
6
7
8
9
10
11
12
13
14
15
Cumulative Volume (ml/g)
Time (s)
P=0.74 MPa
P=1.5 MPa
P=3.0 MPa
Figure 10: Desorption curves under different
desorption pressures, XTHC.
0 600 1200 1800 2400 3000 3600 4200 4800 5400 6000 6600 7200 7800
0
1
2
3
4
5
6
7
8
9
10
11
12
13
Cumulative Volume (ml/g)
Time (s)
P=0.74 MPa
P=1.5 MPa
P=3.0 MPa
Figure 11: Desorption curves under different desorption
pressures, XLSC.
0 600 1200 1800 2400 3000 3600 4200 4800 5400 6000 6600 7200 7800
0
1
2
3
4
5
6
7
8
9
10
11
12
13
14
15
Cumulative Volume (ml/g)
Time (s)
P=0.74 MPa
P=1.5 MPa
P=3.0 MPa
Figure 12: Desorption curves under different desorption
pressures, XLHC.
Table 3: The 0-2 hours cumulative gas desorption volumes and percentage of the soft and hard coals from Xinglong coal
mine (25 ±1 ℃)
Samples Soft coal Hard coal
Gas equilibrium pressure 0.74 MPa 1.5 MPa 3 MPa 0.74 MPa 1.5 MPa 3 MPa
The initial gas desorption rate(V1)(ml/(gꞏmin)) 9.066 12.074 12.918 7.542 8.196 8.478
0-1 min
Cumulative volume(ml/g) 2.541 2.997 3.264 1.963 2.152 2.298
Percentage(%) 26.96 26.13 25.81 18.69 17.03 15.71
0-30 min
Cumulative volume(ml/g) 7.676 8.765 10.13 7.266 8.846 10.45
Percentage(%) 78.42 82.28 83.21 69.18 70.00 71.48
0-2 h
Cumulative volume(ml/g) 8.792 9.909 11.398 8.970 10.90 12.85
Percentage(%) 89.82 93.02 93.63 85.40 86.22 87.90
Experimental Study on Desorption Characteristics of Methane in the Soft and Hard Layer Coal of Stratified Structure in the Northwest of
Guizhou, China
309
Figures.7 to 12 showed that the higher the gas
equilibrium pressure, the higher the gas desorption
rate was at constant temperature, and the gas content
increased as the pressure increased. The gas
desorption rate decreased with desorption time. The
decline of desorption rate was the highest during the
first minute. The initial gas desorption rates of the
samples from the soft coals were larger than those
from the hard coals. The attenuation of gas
desorption rate of the soft coals was faster than that
of the hard coals as well.
Table 3 showed that the percentage of 0-1
minute cumulative volume decreased when gas
equilibrium pressure increased for both soft and hard
coals from Xinglong coal mine. The cumulative gas
desorption volume of the soft layer coal within the
first 30 minutes accounted for 78.42-83.21 % of the
cumulative desorption volume within 2 hours, and
the cumulative gas desorption volume of the hard
coal within the first 30 minutes accounted for 69.18-
71.48% of the total cumulative desorption volume
within 2 hours. Therefore, for both soft and hard
coals, the amount of gas emission in the early stage
of coal exposure or gas pressure relief changes
dramatically, and the gas desorption rate decreased
rapidly. Under the same gas equilibrium pressure,
the initial gas desorption rates (V1) of the soft coals
were 1.202-1.524 times of those of hard coals. The
0-1 minute cumulative volumes of the soft coals
were 1.294-1.420 times of those of the hard coals.
The percentages of 0-1 minute cumulative volumes
in total desorption volumes of the soft coals were
1.442-1.643 times of those of the hard coals. For the
same desorption time period, the cumulative amount
of desorption increased with the increase of gas
pressure. For example, the 0-2 hours cumulative
volume of the soft coal at 3 MPa increased by 2.606
ml/g than the volume at 0.74 MPa. This explained
that gas content in the coal mine increased as the
pressure increased, and the probability of gas
disaster increased.
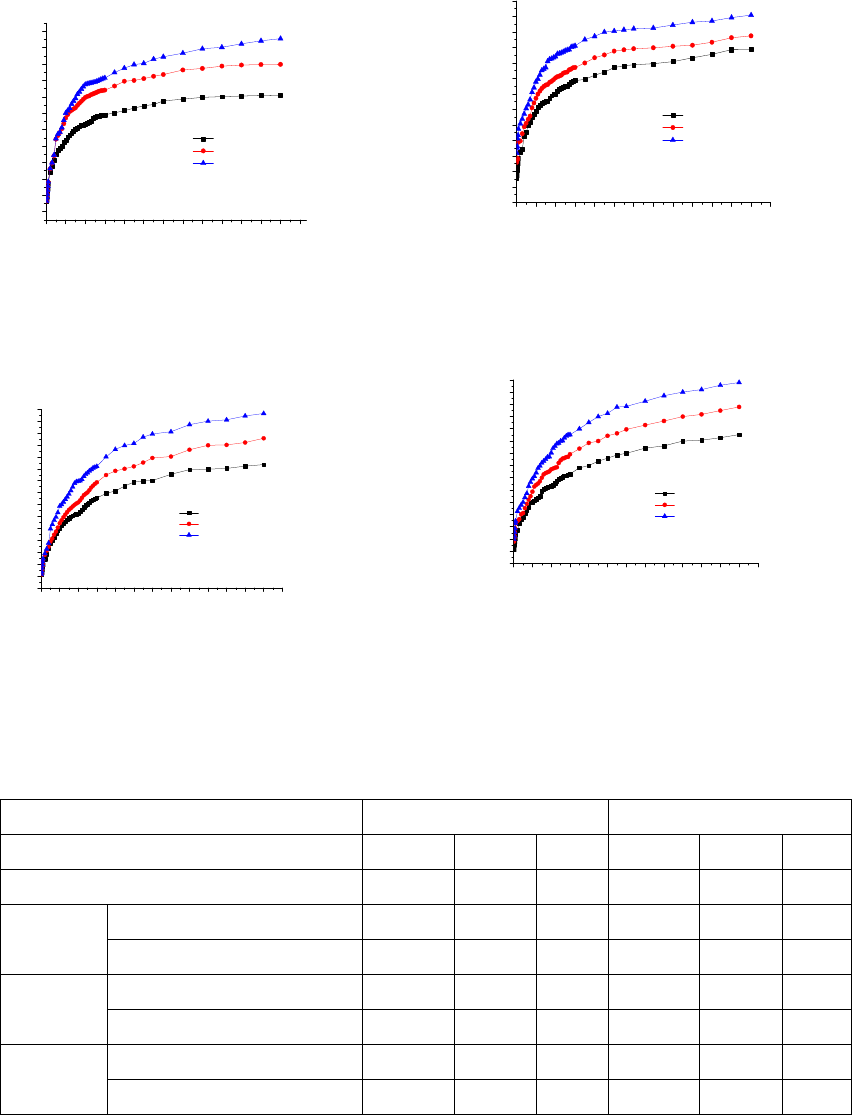
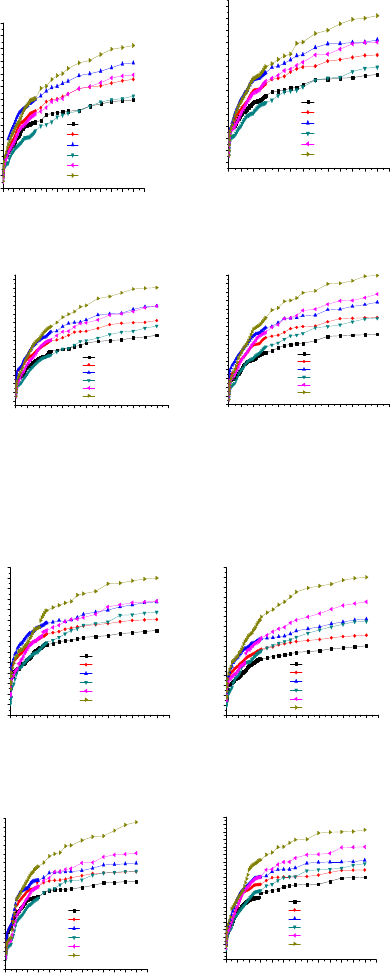
3.3 Desorption Experiments Under
Different Temperatures and
Equilibrium Pressures
In order to study the desorption characteristics of
soft and hard layer coal under different temperatures
and pressures, the experiment on gas desorption
characteristics of coal samples were carried out at
different temperature and pressure combinations.
Experiment pressures were set at 0.74MPa, 1.5MPa,
3MPa, and temperatures were set at 20℃、25℃、
30℃、35℃、40℃.
0 600 1200 1800 2400 3000 3600 4200 4800 5400 6000 6600 7200 7800
0
1
2
3
4
5
6
7
8
9
10
11
12
13
P=0.74 MPa
(
)
The soft layer
P=1.5 MPa
(
The soft layer
)
P=3.0 MPa
(
The soft layer
)
P=0.74 MPa
(
)
The hard layer
P=1.5 MPa
(
The hard layer
)
P=3.0 MPa
(
The hard layer
)
C um u lativ e V o lu m e (m l/g)
Time (s)
(a) 20℃
0 600 1200 1800 2400 3000 3600 4200 4800 5400 6000 6600 7200 7800
0
1
2
3
4
5
6
7
8
9
10
11
12
13
P=0.74 MPa
(
)
The soft layer
P=1.5 MPa
(
The soft layer
)
P=3.0 MPa
(
The soft layer
)
P=0.74 MPa
(
)
The hard layer
P=1.5 MPa
(
The hard layer
)
P=3.0 MPa
(
The hard layer
)
Cumulative V olume (m l/g)
Time (s)
(b) 25℃
0 600 1200 1800 2400 30 00 3600 4200 4800 5400 6000 6600 7200 7800
0
1
2
3
4
5
6
7
8
9
10
11
12
13
14
P=0.74 MPa
(
)
The soft layer
P=1.5 MPa
(
The soft layer
)
P=3.0 MPa
(
The soft layer
)
P=0.74 MPa
(
)
The hard layer
P=1.5 MPa
(
The hard layer
)
P=3.0 MPa
(
The hard layer
)
Cumulative Volume (m l/g)
Time (s)
(c) 30℃
0 600 1200 1800 2400 3000 3600 4200 4800 5400 6000 6600 7200 7800
0
1
2
3
4
5
6
7
8
9
10
11
12
13
14
15
P=0.74 MPa
(
)
The soft layer
P=1.5 MPa
(
The soft layer
)
P=3.0 MPa
(
The soft layer
)
P=0.74 MPa
(
)
The hard layer
P=1.5 MPa
(
The hard layer
)
P=3.0 MPa
(
The hard layer
)
Cumulative Volume (ml/g)
Time (s)
(d) 40℃
Figure 13: Desorption curves of QLSC and QLHC under
different temperatures and pressures.
0 600 1200 1800 2400 3000 3600 4200 4800 5400 6000 6600 7200 7800
0
1
2
3
4
5
6
7
8
9
10
11
12
13
14
P=0.74 MPa
(
)
The soft layer
P=1.5 MPa
(
The soft layer
)
P=3.0 MPa
(
The soft layer
)
P=0.74 MPa
(
)
The hard layer
P=1.5 MPa
(
The hard layer
)
P=3.0 MPa
(
The hard layer
)
Time (s)
Cum u lative V olu m e (m l/g )
(a)20℃
0 600 1200 1800 2400 3000 3600 4200 4800 5400 6000 6600 7200 7800
1
2
3
4
5
6
7
8
9
10
11
12
13
14
15
16
P=0.74 MPa
(
)
The soft layer
P=1.5 MPa
(
The soft layer
)
P=3.0 MPa
(
The soft layer
)
P=0.74 MPa
(
)
The hard layer
P=1.5 MPa
(
The hard layer
)
P=3.0 MPa
(
The hard layer
)
C um ulative V olum e (m l/g)
Time (s)
(b)25℃
0 600 1200 1800 2400 3000 3600 4200 4800 5400 6000 6600 7200 7800
0
1
2
3
4
5
6
7
8
9
10
11
12
13
14
15
16
17
P=0.74 MPa
(
)
The soft layer
P=1.5 MPa
(
The soft layer
)
P=3.0 MPa
(
The soft layer
)
P=0.74 MPa
(
)
The hard layer
P=1.5 MPa
(
The hard layer
)
P=3.0 MPa
(
The hard layer
)
Cumulative Volume (ml/g)
Time (s)
(c)30℃
0 600 1200 1800 2400 3000 3600 4200 4800 5400 6000 6600 7200 7800
0
1
2
3
4
5
6
7
8
9
10
11
12
13
14
15
16
17
18
19
P=0.74 MPa
(
)
The soft layer
P=1.5 MPa
(
The soft layer
)
P=3.0 MPa
(
The soft layer
)
P=0.74 MPa
(
)
The hard layer
P=1.5 MPa
(
The hard layer
)
P=3.0 MPa
(
The hard layer
)
Cumulative Volume (ml/g)
Time (s)
(d)40℃
Figure 14: Desorption curves of XTSC and XTHC under
different temperatures and pressures.
IWEG 2018 - International Workshop on Environment and Geoscience
310
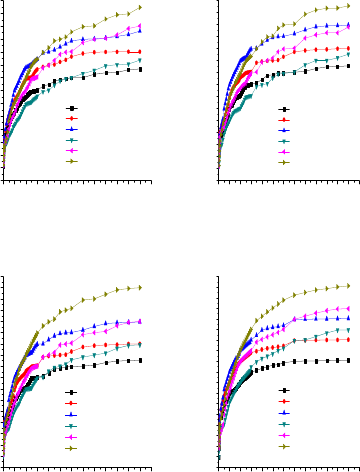
Figures.13 to15 showed that the 2-hour
cumulative gas desorption volumes of both soft and
hard coals from three different coal mines increased
slightly with the increase of temperature and
pressure. The 30-minute cumulative gas desorption
volumes of most soft coals were larger than those of
hard coals. However, the 2-hour cumulative gas
desorption volumes of the soft coals were smaller
than those of hard coals.
Table 4 showed that the 30-minute cumulative
gas desorption volumes of most soft coals were
larger than those of the hard ones from the same coal
mine under same experimental conditions. The
initial gas desorption rates (V1) of the soft coal were
7.116-12.94 ml/(gꞏmin) while those of the hard coals
were 3.762-10.09 ml/(gꞏmin). This explained that
there would be a large volume of gas emission of the
soft coal at the beginning of sudden pressure relief,
and the risk of coal and gas outburst in the soft coals
would be higher than that in the hard coals.
The percentage of 1-minute desorption volume
in total desorption volume of the soft coals were
much higher than that of the hard coals. The 1-
minute desorption volumes of the soft coal samples
from Qinglong coal mine were 1.367-1.652 times of
the hard one. The percentage of 1-minute desorption
volume in 2-hour desorption volume of soft coals
were 1.592-1.865 times of those of the hard ones
from same coal mine. For Xiaotun coal mine
samples, the 1-minute desorption volumes of the
soft coal samples from were 1.442-1.659 times of
those of the hard ones, and the percentage of 1-
minute desorption volume in total desorption
volume of the soft coals were 1.780-1.985 times of
those of the hard coals. The 1-minute desorption
volumes of the soft coal samples from Xinglong
coal mine were 1.368-1.481 times of those of the
hard ones, and the percentage of 1-minute
desorption volume in the total desorption volume of
the soft coals were 1.686-1.729 times of those of
hard coals. The 30-minute cumulative gas
desorption volume of the hard coals were larger than
those of the soft ones under the same temperatures
and pressures. These showed that the gas desorption
rate decays quickly in the soft coals after the first
minute. At the 30th minute, the cumulative gas
desorption volumes of the hard coals were larger
than those of the soft ones, and the difference in
cumulative gas desorption volumes between the soft
and the hard coals slowly increased afterwards.
0 600 1200 1800 2400 3000 3600 4200 4800 5400 6000 6600 7200 7800
0
1
2
3
4
5
6
7
8
9
10
11
12
13
14
P=0.74 MPa
(
)
The soft layer
P=1.5 MPa
(
The soft layer
)
P=3.0 MPa
(
The soft layer
)
P=0.74 MPa
(
)
The hard layer
P=1.5 MPa
(
The hard layer
)
P=3.0 MPa
(
The hard layer
)
Time (s)
Cum ulative V olum e (m l/g)
(a)20℃
0 600 1200 1800 2400 3000 3600 4200 4800 5400 6000 6600 7200 7800
0
1
2
3
4
5
6
7
8
9
10
11
12
13
14
15
P=0.74 MPa
(
)
The soft layer
P=1.5 MPa
(
The soft layer
)
P=3.0 MPa
(
The soft layer
)
P=0.74 MPa
(
)
The hard layer
P=1.5 MPa
(
The hard layer
)
P=3.0 MPa
(
The hard layer
)
C u m u lativ e V o lu m e (m l/g)
Time (s)
(b)25℃
0 600 1200 1800 2400 3000 3600 4200 4800 5400 6000 6600 7200 7800
0
1
2
3
4
5
6
7
8
9
10
11
12
13
14
15
16
17
P=0.74 MPa
(
)
The soft layer
P=1.5 MPa
(
The soft layer
)
P=3.0 MPa
(
The soft layer
)
P=0.74 MPa
(
)
The hard layer
P=1.5 MPa
(
The hard layer
)
P=3.0 MPa
(
The hard layer
)
C u m u la tiv e V o lum e (m l/g )
Time (s)
(c)30℃
0 600 1200 1800 2400 3000 3600 4200 4800 5400 6000 6600 7200 7800
0
1
2
3
4
5
6
7
8
9
10
11
12
13
14
15
16
17
18
P=0.74 MPa
(
)
The soft layer
P=1.5 MPa
(
The soft layer
)
P=3.0 MPa
(
The soft layer
)
P=0.74 MPa
(
)
The hard layer
P=1.5 MPa
(
The hard layer
)
P=3.0 MPa
(
The hard layer
)
C u m u la tiv e V o lu m e (m l/g )
Time (s)
(d)40℃
Figure 15: Desorption curves of XLSC and XLHC under
different temperatures and pressures.
The 30-minute cumulative gas desorption
volumes of the soft layer coal accounted for 72.74-
86.06 % of the 2-hour volumes. Meanwhile, during
the same time period, it accounted for 62.67-72.79 %
for the hard coals. The percentages of the soft coals
were 1.161-1.182 times of those of hard coals. These
indicated that the gas desorption of the soft and hard
coals mainly occurred in the first 30-minute, and the
gas desorption rates were decline significantly in the
interval from the 30
th
minutes to the 2
nd
hour. The
gas desorption rates of the hard layer coals were
larger than those of the soft coals during this time
interval, and the declines of the desorption curves of
the hard coals were less than those of the soft ones.
With the increase of the equilibrium pressures
and temperatures, the time for the desorption
volumes of the hard coals to exceed those of the soft
coals became shorter, and the shortest time observed
in the experiment, which was 10 minutes, took place
in samples from Xiaotun coal mine under the
conditions of 40±1℃ and 3MPa.
Experimental Study on Desorption Characteristics of Methane in the Soft and Hard Layer Coal of Stratified Structure in the Northwest of
Guizhou, China
311

Table 4: The initial gas desorption rates and the cumulative gas desorption volumes of the soft and hard layer coal at
different time periods(30±1℃).
Samples
Gas equilibrium
pressure(MPa)
The initial gas
desorption
rate(V1)
(ml/(gꞏmin))
0-1 min 2-30 min 30 min-1 h 1 h-2 h
Cumulative
volume(ml/g)
Percenta
g
(%)
Cumulative
volume(ml/g)
Percentage
(%)
Cumulative
volume(ml/g)
Percentage
(%)
Cumulative
volume(ml/g)
Percentage
(%)
QLSC
0.74 7.116 1.754 23.07 3.818 50.22 1.072 14.10 0.958 12.61
1.5 8.316 2.003 21.59 4.842 52.20 1.304 14.06 1.157 12.47
3 10.69 2.445 22.54 5.391 49.70 1.571 14.48 1.441 13.28
QLHC
0.74 3.762 1.062 12.37 4.320 50.30 1.567 18.25 1.638 19.08
1.5 5.692 1.465 13.56 5.584 51.67 1.913 17.70 1.844 17.06
3 5.962 1.623 12.27 6.909 52.24 2.461 18.61 2.233 16.88
XTSC
0.74 11.72 3.088 31.56 5.259 53.76 0.868 8.873 0.568 5.806
1.5 12.19 3.266 29.83 6.131 56.01 0.934 8.532 0.616 5.627
3 12.94 3.438 29.14 6.692 56.92 0.994 8.424 0.675 5.521
XTHC
0.74 6.950 1.988 17.73 6.166 54.99 1.784 15.91 1.274 11.36
1.5 7.500 1.969 15.03 7.501 57.26 2.004 15.30 1.626 12.41
3 10.09 2.385 14.94 8.854 56.53 2.373 15.15 1.750 11.17
XLSC
0.74 10.81 2.737 28.54 5.316 55.44 0.936 9.761 0.600 6.257
1.5 11.84 2.890 26.16 6.413 58.05 1.075 9.731 0.669 6.056
3 12.92 3.328 25.76 7.457 57.71 1.370 10.60 0.766 5.928
XLHC
0.74 6.918 1.848 16.93 5.983 54.81 1.678 15.37 1.407 12.89
1.5 7.812 1.970 15.13 7.179 55.13 2.091 16.06 1.781 13.68
3 9.990 2.433 15.09 9.299 57.70 2.498 15.50 1.787 11.09
4 CONCLUSIONS
The gas desorption characteristics of the coal
samples that came from the soft and hard coals of 3
coal mines in the northwest of Guizhou were studied
by the experiments under different temperatures and
pressures. Based on the analyses of the experimental
data, following conclusions can be drawn:
The curves fitted the monotonically increase of
the cumulative gas desorption volumes of the soft
and hard coals with the desorption time.
The gas desorption rates of the soft and hard
coals were high at early stage, then slowed down.
Gas was desorbed quickly within the first minute,
and desorption volumes increased linearly, then
leveled off.
The gas desorption of the soft and hard coals
mainly took place in the first 30-minute, and the gas
desorption volumes within 30 minutes after coal
exposure or gas pressure relief accounted for 62.67-
86.06% of the 2-hour desorption volumes.
The initial gas desorption rate, the cumulative
desorption volume and the desorption percentages
of different time periods were affected by
temperature and pressure. The desorption volume
was proportional to both temperature and pressure.
Under the conditions of the same temperature
and pressure, the initial gas desorption rates of the
soft coals were 1.282-1.892 times of those of the
hard coals.
Given enough desorption time, the cumulative
gas desorption volumes of the hard coals would
exceed those of the soft ones. The shortest time
observed in the experiments is 10 minutes.
IWEG 2018 - International Workshop on Environment and Geoscience
312
ACKNOWLEDGEMENTS
This research was supported by National Natural Sci
ence Foundation of China (No.51874107, and
No.51864008) and Major Applied Basic Research
Project of Guizhou province (JZ (2014)2005)
and Joint Funds of Department of Science &
Technology of Guizhou Province and Guizhou
University (No. LH [2017] 7282).
REFERENCES
Cao S G, Zhang Z G, Li Y 2013. Experimental study of
deformation properties of outburst-prone coal
induced by gas adsorption and desorption.
Journal of China Coal Society 38(10) 1792-1799
Gao Y, Tan G W 2015
. Analysis on influence of fault
structure upon coal and gas outburst in
Zhaozhuang mine.
Mining safety & environmental
protection 42(3) 104-107
Heng X W, Li Q S, Han Z L 2015.
Structural control
features of coal and gas outburst in Shuicheng
mining area.
Safety in Coal Mines 46(07)186-190
Li S G, An Z F, Lin H F, et al. 2014. Research on
characteristics of methane adsorption in coal
seam under the conditions of multiple factors.
Coal Science and Technology 42(6) 40-44
Li S G, Zhao Y, Zhang T J 2010.
Test systems of the
coal sample adsorption /desorption
characteristics based on low-frequency
vibproportionn.
Journal of China Coal Society 35(7)
1142-1146
Li X C, Nie B S, He X Q 2011.
Influence of gas
adsorption on coal body.
Journal of China Coal
Society 36(12) 2035-2038
Li X J , Shi T H 2013.
Experimental study on pore
structures of outburst coal and its adsorption
properties at typical mining fields in Guizhou
province.
Journal of Mining & Safety Engineering
30(03) 416-420
Li X J 2013. Expermental study on physicochemical
properties and molecular simulation on methane
adsorption properties of gas-outburst coal in Guizhou
area [D]China University of Ming and Technology
Li X J, Lin B Q 2010.
Status of research and analysis
on coal and gas outburst mechanism.
Coal
Geology & Exploproportionn 38(1) 7-13.
Li Y B 2011. Experimental study on gas desorption of
tectonic coal at initial stage [D] Henan Polytechnic
University
Li Y B, Zhang Y G, Zhang Z M 2013.
Experimental
study on gas desorption of tectonic coal at initial
stage.
Journal of China Coal Society 38(1) 15-20
Liang J, Kang Z Q, Yao H F 2014.
Experimental study
on gas adsorption capacity of tectonic coal in
Hancheng mining area.
Safety in Coal Mines 45(12)
6-10
Liu D M, Wu L Y, Yang Y Z 2015.
Research on the
safety evaluation of coal mine production
logistics based on AHP-entropy method.
Journal
of Safety and Environment 15(3) 33-36
Liu Y B , Cao S G, Li Y, et al. 2010.
Experimental
study of swelling deformation effect of coal
induced by gas adsorption.
Chinese Journal of
Rock Mechanics and Engineering 29(12) 2484-2490
Liu Y W, Liu M J 2015.
Effect of particle size on
difference of gas desorption and diffusion
between soft coal and hard coal.
Journal of China
Coal Society 40(3) 579-587
Wang G Z, Sun G Z 2015.
Experimental research on
influence of porosity on tectonic coal gas
permeability.
Safety in Coal Mines 45(7) 1-4
Wei J P, Chen Y C, Wen Z H 2008.
Study of gas
desorption laws of tectonically coal. Safety in
Coal Mines 39(8) 1-3
Xie Z H, Chen S J 2007.
Effect of moisture and
temperature to CH
4
adsorption of coal. Journal of
University of Science and Technology Beijing 29(2)
42-44
Experimental Study on Desorption Characteristics of Methane in the Soft and Hard Layer Coal of Stratified Structure in the Northwest of
Guizhou, China
313
