
Identification of Palaeochannels of Mihe River: An Approach Based
on the Integrated Geophysical Methods
Longfeng Guo
1
, Liangliang Li
2
, Lidong Fang
3
, Xu Wang
1
, Hengyu Jin
1
and Gang Wang
1,*
1
College of Water Conservancy & Civil Engineering,Shandong Agricultural University,Tai’an 271000;
2
Shandong Zhengyuan Construction Engineering Co.,Ltd,Jinan 250101;
3
China Metallurgical Geology Bureau,Geological Exploration Institute of Shandong Zhengyuan,Weifang 261000.
Email: gwang@sdau.edu.cn
Keywords: Mihe River, paleochannel, vertical electrical sounding, high-density electrical resistivity tomography,
resistivity
Abstract: Palaeochannel plays an important role in the economic construction. Geophysical methods are appropriate
tool to identify palaeochannel. On the basis of analyzed formation genetic type of the study area, this study
combining Vertical Electrical Sounding & High-density Electrical Resistivity Tomography were measured
paleochannel and the results were compared with drilling information. The resistivity results strongly
reflects the spatial distribution characteristics of stratum in the research area, where the palaeochannel is
represented by the high-resistivity values which is in the range of 18-40Ω•m indicating, the lithology mainly
as fine sand and silty-fine sand. It will establish the foundation for rational exploitation and comprehensive
utilization of palaeochannel resource in future in the area.
1 INTRODUCTION
Palaeochannels (Wu and Zhao, 1993) are old river
channel beds containing coarser unconsolidated
deposits which are formed either during the course
of dying of the river or deflection of the river
channel in a different direction. The sand layers,
with or without a clayey cover (of variable thickness)
at top, generally form potential aquifers owing to
better conductivity and availability of storage space
in the interstices of coarser granular material. The
palaeochannels also act as good groundwater
recharge avenues and pathways for groundwater
flow. Often the palaeochannels yield good quality
water in comparison to the adjoining areas. Such
palaeochannels can be used for sustainable
groundwater development and management for
different needs such drinking and irrigation.
Many researchers have earlier also studied
palaeochannels through using different techniques.
Especially the new techniques and methods have
greatly improved the accuracy and depth of research
in the last several decades (
Wu and Zhao, 1993; Wu et
al., 1991; Dave et al., 2002; Fu et al, 2008; Zhu et al. 2013;
Cao et al. 2016
). Geophysical methods provide some
of the uncomplicated and reliable groundwater
exploration techniques. As the research going in
various fields, the conventional resistivity method is
difficult to meet the work demand while High-
density Electrical Resistivity Tomography arising. It
is widely applied especially in recent years (
Mauro et
al. 2013; Wang et al. 2016; Dai and Xie 2015; Chen S et
al. 2017
).
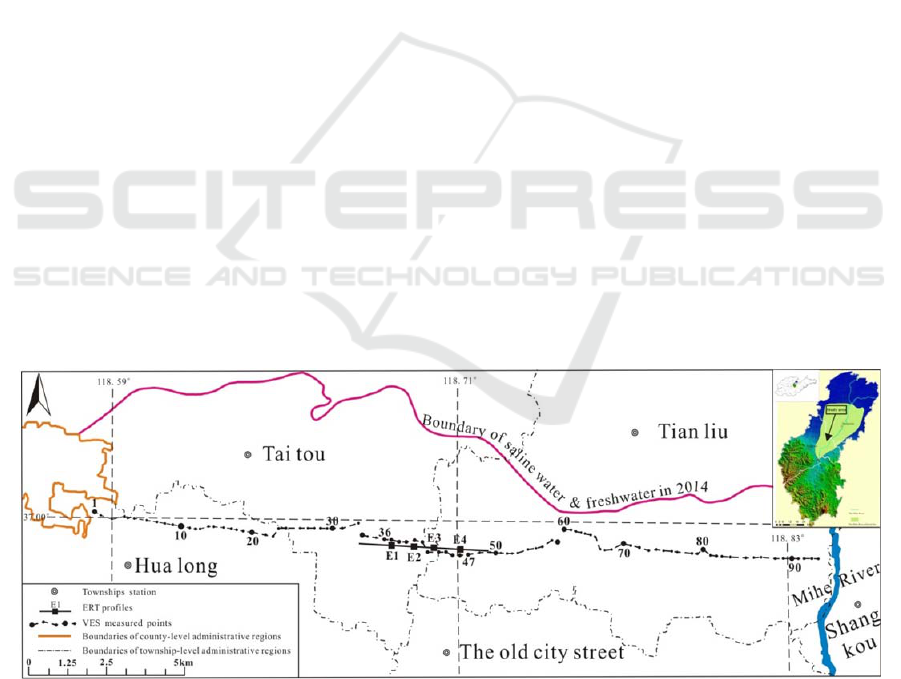
The study area is located in Shouguang City,
China. It is in downstream of the Mihe River
alluvial fan (North of the Mount Tai and the Mount
Yi, South of Laizhou Bay, Figure 1). Because of the
Mihe River erosion forms vast and flat plain where
Quaternary is thick and continuous. It is composed
of clayey sand mainly (
Han,1996). Under the
influence of the Ice Age in geological time Mihe
River forms paleochannel (
Han et al. 1999a). Its
mainstream belt is mainly composed of gravel, sand
and silt, the top and bottom plates are clay or loam.
The Mihe River palaeochannel is the main
enrichment area of groundwater. In the 1970s the
saltwater intrusion occurred in the area. As the main
secondary landform, palaeochannel is the main
channel of saltwater intrusion and also the fastest
intrusion, the most complex changes and the worst
Guo, L., Li, L., Fang, L., Wang, X., Jin, H. and Wang, G.
Identification of Palaeochannels of Mihe River - An Approach Based on the Integrated Geophysical Methods.
In Proceedings of the International Workshop on Environment and Geoscience (IWEG 2018), pages 353-359
ISBN: 978-989-758-342-1
Copyright © 2018 by SCITEPRESS – Science and Technology Publications, Lda. All rights reserved
353
affected landform units (
Han, 1996; Han et al. 1999b
).
Due to the over-exploitation of groundwater, three
large-scale regional groundwater funnel areas
(average groundwater level about -58m)centered
on Hualong, Shengcheng Street and Luocheng Street
have been formed. Therefore saltwater intrusion is
gradually intensified.
In order to meet the challenges arising out of the
crisis in water supply sector and saltwater intrusion
in the fresh water aquifers, it has been imperative to
map the palaeochannels of the rivers, which might
host fresh water. For this purpose this study will
combining Vertical Electrical Sounding & High-
density Electrical Resistivity Tomography identify
palaeochannel. The results will be compared to the
information obtained in the exploration drilling.
2 METHODOLOGY
Affected by saltwater intrusion, groundwater in the
area is divided into the northern saltwater zone, the
middle salty-freshwater transitional zone and the
southern freshwater zone (
Zhao et al. 2000
). The
survey lines is laid from west to east according to
the boundary of saline water & freshwater and the
direction of the road, as shown in Figure 1. Based on
the respective advantages of the two methods and
the preliminary determination of the distribution and
direction of palaeochannel, firstly we use One-
dimensional Electrical Sounding in the "macro" to
detect palaeochannel information; then High-density
Electrical Resistivity Tomography is conducted in
areas with palaeochannel response according to the
first step exploration results.
2.1 Vertical Electrical Sounding
Vertical Electrical Sounding (VES) is an electrical
exploration technique, which by changing the pole
pitch of AB and MN to control detection depth in
artificial electric field to obtain the vertical variation
rule of the rock resistivity characteristic at the
sounding point (Figure 2). The collection of VES
data uses DZD-6A multi-function direct current
electrical prospecting apparatus with symmetrical
quadrupole devices according to Table 1 data layout
polar distance. This is 94 sounding points in all
(Figure 1).
2.2 High-density Electrical Resistivity
Tomography
High-density Electrical Resistivity Tomography
(ERT) is an array of exploration method based on
conventional resistivity method. The measuring
principle is identical to VES, except that ERT
electrode arrangement completed once and more
collecting data along with high efficiency can more
intuitively reflect the characteristics of the
underground space electrical abnormal body [8].
Figure 1: Illustration map showing location of the study area and measured points & profiles.
IWEG 2018 - International Workshop on Environment and Geoscience
354
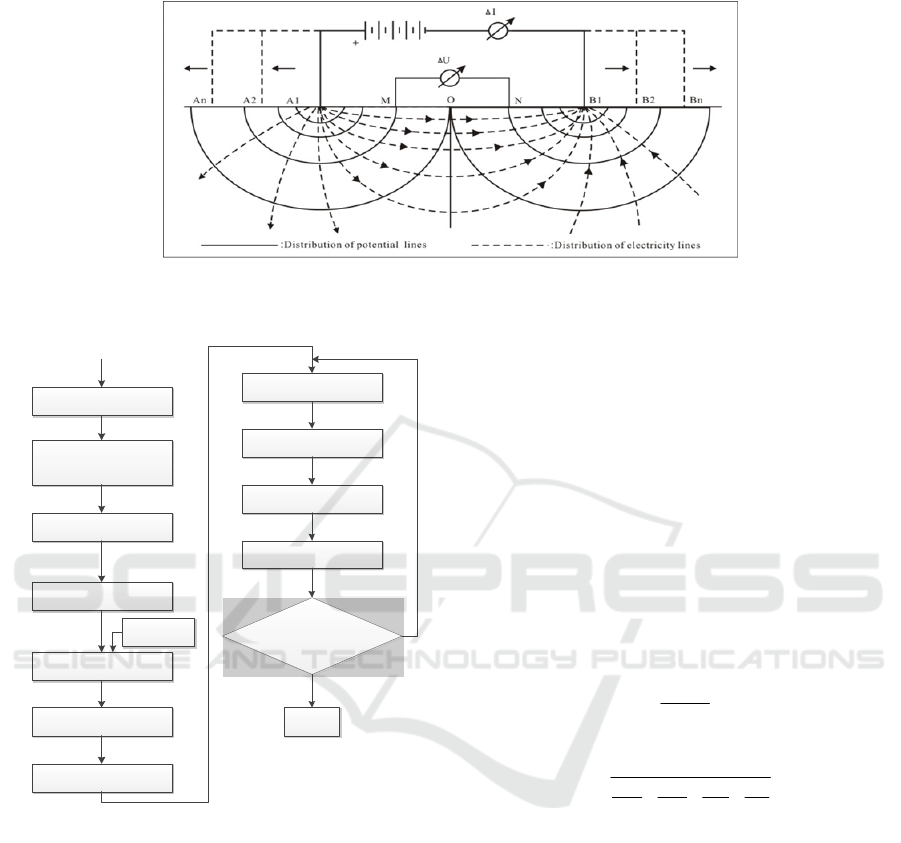
Figure 2: The schematic diagram of VES.
Start inversion program
Open data file
(electrode coordinates、actual
measured potential, et al)
Generate grid
Delete dad date
Start inversion
Establish initial model
Iterative time n =0
Known
information
Forward calculation
Calculate fitting error
Solve linearization problem
Modified model
Forward calculation
Calculate fitting error
Satisfied stop conditions
(RMS、
n
max
)
Stop
Y
N
Iterative time n=1
To next iterative time n=n+1
Figure 3: The flow diagram of resistivity inversion.
The collection of ERT data uses 61-channel
FlashRES-UNIVERSAL ultra-high-density direct
current electrical exploration system. The system
uses advanced full-waveform ZZ data acquisition
device breaking through conventional data
acquisition method. In the electrode system
composed of 64 measuring electrodes any one of
AB supply electricity forms an electric field, MN
can measure 61 potential (difference) data at the
same time. Therefore when A and B composed of
odd and even numbered electrodes respectively, ZZ
device can obtain 32×32×61=62464 data each data
acquisition.
According to the results of VES, it is
preliminarily assessed that the palaeochannel
response exists at the locations 36#~42# and 44#~
47#. To further understand the spatial distribution of
palaeochannel, ERT measurements were performed
near this location. Figure 1 shows four profiles E1~
E4 in total using full-waveform ZZ data acquisition
device. Each profile is arranged with 64 electrodes,
the unit electrode distance is 6m, and effective
measuring line length is 378m.
The collected data of VES and ERT can
calculate apparent resistivity
s
according to the
following formula.
MN
s
U
K
I
,
(1)
2
1111
K
AM BM AN NB
,
(2)
Where
MN
U
is potential difference between M
and N (V); I is current between A and B (A); K is
device coefficient; AM、BM、AN、NB are distance
between electrodes respectively (m).
Due to heterogeneity and anisotropy of the actual
stratum,
s
is not enough to reflect the electrical
characteristics of the medium. Therefore, the true
resistivity of the medium is calculated by the least
square inversion method. The inversion process is
shown in Figure 3.
Identification of Palaeochannels of Mihe River - An Approach Based on the Integrated Geophysical Methods
355
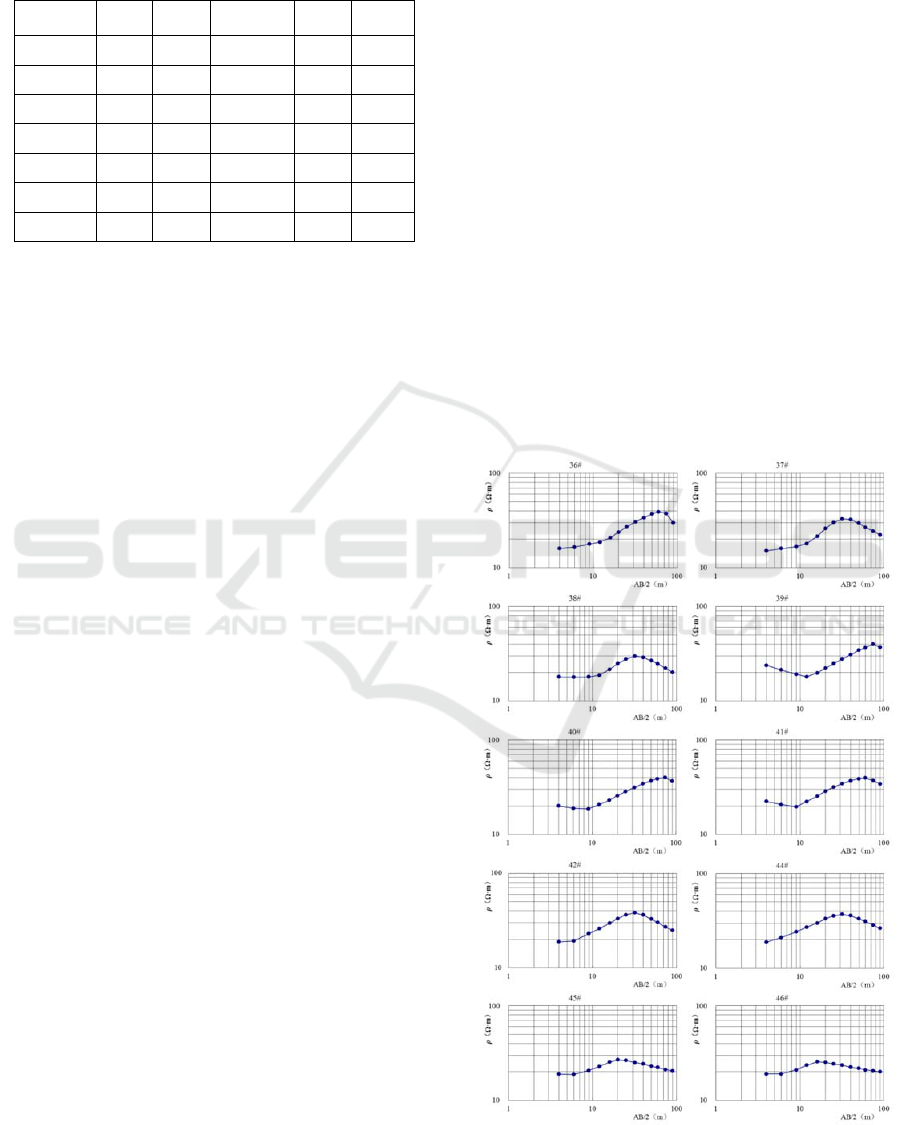
Table 1: Data acquisition list of VES (Unit: Meter).
Sequence
Number
AB/2 MN/2
Sequence
Number
AB/2 MN/2
1 2.5 1.5 8 25 4
2 4 1.5 9 32 4
3 6 1.5 10 40 4
4 9 1.5 11 50 4
5 12 1.5 12 60 6
6 16 1.5 13 74 6
7 20 1.5 14 90 6
3 ANALYSIS AND DISCUSSION
OF RESULTS
3.1 Analysis of VES Results
Sand and clay perform high and low resistivity
respectively in palaeochannel sediments. Figure 4
shows VES resistivity curves after inversion of
36#~42#、44#~46# sounding points.
Figure 4 shows the "K" sounding curves carried
out in the area. It indicates three different electrical
layers vertically. Numerically, the curve is
characterized by high center and low sides. The high
and low resistivity zones are caused by enrichment
of sand and clay respectively. This shows that the
sounding points have palaeochannel distribution
characteristics, and the corresponding lithology from
top to bottom is clay - sand - clay.
From resistivity values and distribution of curves,
it is evident that the maximum resistivity is 40Ω•m
(40#, 41#) and the minimum is 16Ω•m (37#). The
maximum is 2.5 times the minimum. The obvious
contrast of resistivity indicates that there are
different electrical strata at the sounding points.
According to the range of resistivity values of clay
& sand, all of the electrical sounding curves show an
increasing trend at 18-20Ω•m, which indicates the
existence of sand layer. With deepening of VES
dipole depth, the resistivity increases to the
maximum and then decreases gradually, which is
caused by disappearance of sand and appearance of
clay. Therefore the enrichment of sand
characteristics in palaeochannel can be inferred
based on characteristics of the curves. Table 2 shows
characteristics of palaeochannel sand layer deduced
from sounding curves.
Table 2 shows that the average buried depth of
the top of sand layer (as deduced from the 10
electrical sounding curves) is 9.9m; the maximum
depth of 16m (36#, 39#) and the minimum of 4m
(44#). The average of bottom depth is 45.2m, the
maximum depth is 80m at 40# sounding point and
the minimum is 16m at 46#. It is deduces that the
average sand thickness is 35.3m ,the maximum
thickness is 58m (39#) and the minimum is 10m
(46#).
3.2 Analysis of ERT Results
Figure 5 shows resistivity spatial distribution of the
ERT profiles E1 ~ E4 after inversion. The non-
uniform distribution of resistivity in profiles
indicates spatial heterogeneity in the stratigraphic
lithology. Four profiles on the structure show overall
three layers of "low - high - low " resistivity from
top to bottom. This is consistent with the features
reflected by VES.
Figure 4: The graphs of VES.
IWEG 2018 - International Workshop on Environment and Geoscience
356
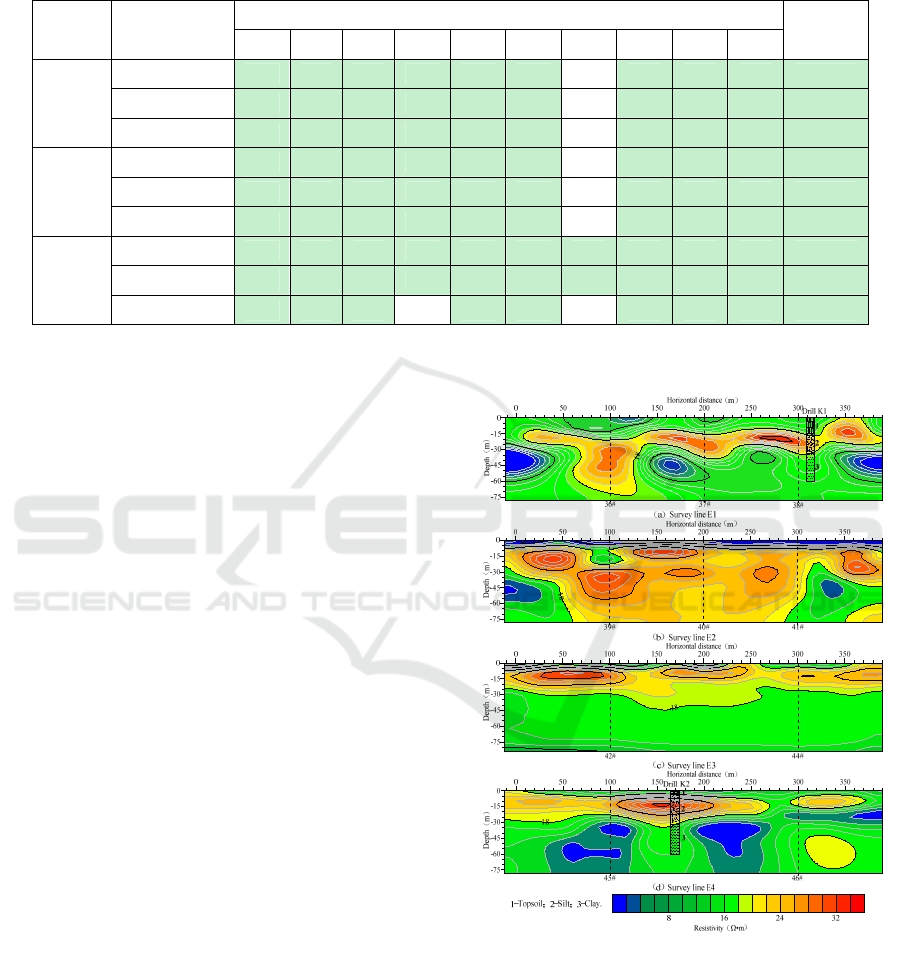
Table 2: The inference statistical table of the palaeochannel characteristics of sand layer.
Method
Sand features
(m)
Serial number of sounding points
Average
36# 37# 38# 39# 40# 41# 42# 44# 45# 46#
VES
Top depth
16 15 12 16 9 9 6 4 6 6 9.9
Bottom depth 68 35 33 74 80 60 32 32 22 16 45.2
Thickness 52 20 21 58 71 51 26 28 16 10 35.3
ERT
Top depth 18 15 12 22 7 8 5 3.5 5 6 10.1
Bottom depth 70 35 32 78 78 59 30 29.5 22 14 44.8
Thickness 50 20 20 56 71 51 25 26 17 8 34.4
Re (%)
Top depth
11.8 0.0 0.0 21.6 25.4 11.8 18.3 0.5 18.3 0.0 2.0
Bottom depth 2.9 0.0 3.1 5.3 2.5 1.7 6.4 8.1 0.0 13.4 0.9
Thickness 3.9 0.0 4.9 3.5 0.0 0.0 3.9 7.4 6.0 22.5 2.6
The resistivity values obtained by ERT are
slightly less than VES, the maximum is 38Ω•m and
the minimum is 3Ω•m. The maximum value is the
same as VES. However the minimum value has a
certain difference between them. It may be due to
amount of data collected, difference of data values
and regionalization of inversion process between
them and others. Based on collected data, the criteria
for dividing clay and sand is 18Ω•m. The calculation
results of two methods are shown in Table 2. The
location of VES sounding points in ERT profiles is
shown in Figure 5.
Table 2 shows that the average buried depth at
the top of the sand layer estimated from the ERT
profiles of the corresponding location is 10.1m, the
relative error (
) with the VES inference is 2.0%,
the absolute error (e
*
) of other sounding points is not
more than 2m except for 39# (e
*
=4m) and the results
of 37#, 38# and 46# is same to VES inference. The
estimated bottom sand depth is 44.8m,
with the
VES inference is 0.9%, the absolute error of other
sounding points is not more than 2m except for 39#
(e
*
=4m). The
of 36#, 37#, 38#, 40#, 41#and 45#
is less than 5% and the results of 37#and 45# is
same to the VES
inference. This implies that the
results of two methods are basically in agreement.
The top and bottom positions of 39# are 4m deeper
than the VES result. From continuity of spatial
distribution in the high resistivity region of ERT
profiles, the result of ERT is more reliable. The
average thickness of the sand layer estimated is
34.4m, with
of 2.6% from the VES results. The
largest
is located at 46#, followed by 44# and
45# are 7.4% and 6.0% respectively. Others are
within 5% and 37#, 40# & 41# are 0.
Figure 5: The resistivity profiles of ERT and drilling
information of K1 & K2.
Through the above comparative analysis, ERT
and VES can more conclusively deduce the
information of clay layer and sand layer in the
stratum except for 44#. Profile E1 show that the
sand layer in other areas are mainly enriched in the
stratum within a depth of about 15m except for the
Identification of Palaeochannels of Mihe River - An Approach Based on the Integrated Geophysical Methods
357

sand layer exposed at 345m-357m. The thickness of
sand layer at 65m-125m is about 50m, and the
thickness of other areas is about 15m. The location
of Profile E2 is the main enrichment zone of the
sand layer with a depth of about 8m. The thickness
of the sand layer is about 25m at 0-50m and 350m-
390m. The middle area is fully enriched with sand in
exploration depth and extends to deeper. The typical
"U" type distribution is in accordance with
sedimentary structure of palaeochannel. The spatial
distribution of sand layer at profile E3 is more
uniform. Except for at 225m-260m and 360m-390m
near the surface, the average sand depth in other
areas is about 5m and the average thickness is about
24m. There is a discontinuity in the sand space at
profile E4, which occurs at 270m-290m. The sand is
mainly concentrated at 0-270m, the average depth is
about 5m and the average thickness is about 22m.
There is a sand lens body at 290m-370m with an
average depth of about 5m and a thickness of about
10m.
3.3 Comparative Analysis of
Exploration Drilling Results
In order to further verify characteristics of
palaeochannel, this study arranged K1 & K2 drilling
lithological data on E1 & E4 profiles respectively
(Figure 5). The comparison of two results shows that
high conformity between them and reliability of this
integrated geophysical method.
4 CONCLUSIONS
Based on the integrated geophysical methods of
VES & ERT and stratum differences in resistivity
parameters, prospective palaeochannels have been
identified. The results of geophysical methods were
in accordance with the drilling data. It will establish
the foundation for rational exploitation and
comprehensive utilization of palaeochannel resource
in future in the area.
The geophysical methods show the sand layer in
palaeochannels reflected by high resistivity which is
in the range of 18-40Ω•m in the average buried
depth of about 10m. The buried depth in the middle
is deep, the depth at both ends is shallow, and the
average sand thickness is about 35m. The typical
"U" type distribution is in accordance with the
sedimentary structure of palaeochannel. The clay in
palaeochannel reflected by low resistivity which is
in the range of 5-18Ω•m. It constitutes the top & the
bottom floor and protection structure of
palaeochannel.
ACKNOWLEDGEMENT
This study was supported by the Natural Science
Foundation of China (41202174).
REFERENCES
Cao S, Feng X, Lu Q, et al. 2016. Application of GPR in
depicting sedimentary reservoir of paleochannel
sandstone bodies[J] Global Geology 35(1) 223-234
Chen S, Yu S W, Liu H Q, et al. 2017. Application and
research of high density resistivity method in
hydrogeological prospecting—— a case study on
Jiangping town map[J]. Progress in Geophysics 32(2)
0849-0855
Dai T Y, Xie S P. 2015. Application and research of high
density resistivity method in hydrogeological
prospecting—— a case study on Jiangping town
map[J]. Progress in Geophysics 30(6) 2885-2891
Dave Baines, Derald G. Smith, Duane G. Froese, et al.
2002. Electrical resistivity ground imaging (ERGI): a
new tool for mapping the lithology and geometry of
channel-belts and valley-fills [J].Sedimentology 49
441-449
Fu X J, Liu K Y, Li G M. 2008. The electrical
characteristics of Symmetrical Four Resistivity
Sounding Curves in the ancient river belt and
interchannel areas [J].Groundwater 30(5) 107
Han M, Li D G, Zhao M H, et al. 1999a. The Study of the
Surface-emerging Ancient Channels on the south coast
Plain of Laizhou Bay[J] Scientia Geographica Sinica
19(5) 451-456
Han M, Zhao M H, Li D G, et al. 1999b. Study on the
ancient channels and the relationship between the
ancient channels and the sea (salt) water intrusion of
the south coastal plain of Laizhou Bay[J]. Journal of
Natural Disasters 8(2) 73-80
Han M. 1996 Realationship between the seawater
intrusion and landforms in Laizhou Bay area[J].
Oceanologia at Limnologia Sinica 27(4) 414-420
Mauro Mele, Mauro Cremaschi, Maura Giudici, et al.
2013. The Terramare and the surrounding hydraulic
structures: a geophysical survey of the Santa Rosa site
at Poviglio (Bronze Age, northern Italy) [J]. Journal of
Archaeological Science 40(12) 4648-4662
Wang G, Liu R X, Huang S W, et al. 2016. In-situ
experimental study of water infiltration properties
within low-permeable fractured bedrock based on
high-density electrical resistivity tomography [J].
China Science Paper 11(3) 263-269
IWEG 2018 - International Workshop on Environment and Geoscience
358

Wu C, Zhao M X 1993 On exploitation and utilization of
ancient channel resources and relevant policies——A
case study on the North China Plain [J]. Resources
Development and Conservation 9(1) 21-24
Wu C, Zhu X Q, He N H, et al. 1991 The Research of
Paleochannels in the North China Plain [M]. Beijing:
China Science and Technology Press
Zhao M H, Jiang A X, Han M, et al. 2000 The
groundwater environment of the Shallow-buried
Paleochannel Zones and the Alluvial-diluvial Fans on
the south coast Plain of Laizhou Bay [J]. Envirnmental
Science 21 57-61
Zhu W, Tang W, Du J Z, et al. 2013. The formation and
evolution of paleochannel in Nenjiang river [J].
Ground water 35(2) 85-86
Identification of Palaeochannels of Mihe River - An Approach Based on the Integrated Geophysical Methods
359
