
Preliminary Results of the Southern Mariana Trench Wide-Angle
Seismic Experiment
Genggeng Wen
1, 2
, Kuiyuan Wan
1,*
and Jinlong Sun
1
1
CAS Key Laboratory of Ocean and Marginal Sea Geology, South China Sea Institute of Oceanology, Chinese Academy of
Sciences, Guangzhou 510301, China;
2
University of Chinese Academy of Sciences, Beijing 100049, China.
Email: kywan@scsio.ac.cn
Keywords
: Southern Mariana Trench, challenger deep, wide-angle seismic
Abstract: The Mariana subduction zone is a key area of magmatism and tectonic evolution in the western Pacific,
which has the deepest abyss “Challenger Deep” on the earth. An active source seismic experiment with an
array of ocean bottom seismometers (OBS) were conducted across the Challenger Deep in the southern
Mariana Trench during November-December 2016, and we have acquired the first significant wide-angle
seismic data. We relocated the OBSs position and revised the travel-time of the phases, using the travel-time
data of the direct water waves, and obtained high-quality seismic sections based on these corrections. The
phase records are complex because of the topography variations but each OBS has recorded continuous and
clear phases with a maximum offset of 120 km. The phases of crustal refraction were identified at 5~80 km
offsets with little difference on the two sides of the southern Mariana Trench, while the reflections from
Moho were found to be very different. From the seismic record profiles, those phases provide an important
foundation for analyzing the structure and evolution of crust and the features of its internal velocity
structure in Mariana Trench-Arc-Basin system.
1 INTRODUCTION
The OBS wide-angle seismic survey has the
characteristics of large depth of exploration and
wide range: its investigate depth can reach 30~40
km and the depth of the Moho interface can be
reached under the continental crust. Different
seismic phases and clear signals can be identified
from more than 100 km distance (sometimes up to
200~300 km) (Xia et al. 2007). Thus, the OBS wide-
angle seismic survey is used in the study of the crust
and mantle velocity structure (Ruan et al. 2004).
All the time, the Mariana Trench is hot research
with a narrow and deep-water abyss more than 6,000
m. The trench extends parallel to the island arc, with
a “V” cross-section, which is located between the
island arcs and the oceanic basin. In 2002, Simon
Fraser University in Canada cooperated with the
United States and Japan Agency for Marine-Earth
Science and Technology (JAMSTEC) carried out a
three-dimensional (3D) deep seismic survey of
Mariana Trench subduction zone, revealing the
distribution of its internal velocity structure in
temporally and spatially (Caluert, et al. 2008). In
2003, JAMSTEC also carried out a deep seismic
experiment which across the entire Mariana island
arc and back-arc system. A wide-angle reflection-
refraction seismic record was acquired that about
700 km, the crustal and upper mantle velocity
structures and the arc crust evolution model were
obtained. The model can explain the process of IBM
(Izu-Bonin-Mariana) arc crust creation (Takahashi et
al. 2008; Tatsumi Y et al. 2008). Although there
have done lots of research in the Mariana island arc,
rarely deep seismic experiments have been carried
out in the deepest trench of the world. During
November-December 2016, we have conducted an
active source seismic experiment with an array of
ocean bottom seismometers (OBS) across the
Challenger Deep in the southern Mariana Trench.
The experiment strives for a breakthrough in the
study of major scientific issues in deep trench, and
have great significance in revealing the formation
process of the trench and the relationship with
364
Wen, G., Wan, K. and Sun, J.
Preliminary Results of the Southern Mariana Trench Wide-Angle Seismic Experiment.
In Proceedings of the International Workshop on Environment and Geoscience (IWEG 2018), pages 364-368
ISBN: 978-989-758-342-1
Copyright © 2018 by SCITEPRESS – Science and Technology Publications, Lda. All rights reserved
magmatism and tectonic movement in Mariana
Trench-Arc-Basin system.
2 THE SEISMIC DATA
COLLECTION IN THE
MARIANA TRENCH
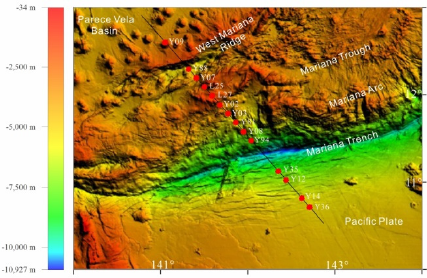
The deep seismic data were acquired by R/V
“Shiyan 3” of the South China Sea Institute of
Oceanology, during December 2016 near the
Challenger Deep in the Mariana Trench (Figure 1).
Eighteen 4-component OBSs (14 were recycled),
spaced in ~15 km intervals, were deployed along the
349 km NW-SE profile across the Challenger Deep
and Mariana arc. The 6000 cubic inches air gun
arrays were towed at ~10m depth to produce a low-
frequency source (3~15 Hz), which delivered a
working pressure of 2000 psi. The excitation time is
about 90 s and the shot distance intervals about
223.0 m and a total of 1572 shot were fired along
the survey line.
Figure 1: Topography and bathymetry map of the Mariana
Trench (the red circles represent OBS stations).
3 THE PROCESSING OF OBS
DATA
The original data collected by seismic exploration
includes original navigation data (HYPACK files
and timer files) and original OBS data. The original
navigation data were processed to navigation
UKOOA file. In UKOOA file, the shot number and
the shot position are from the HYPACK files, the
excitation time is from the timer files. The UKOOA
file can be used for cropping seismic data. The
original OBS data is RAW files that records two
horizontal components, one vertical component and
one hydrophone component which can be converted
into standard SAC format by the RAW2SAC
program. SAC format can show the continuously
waveform data and it can enable the common
operations such as seismic phases picking, filtering
and so on. SAC format can be converted into
standard SEGY file by the SAC2Y program (Barry,
et al. 1975; Qiu, et al. 2011; Zhao, et al. 2004).
Finally, the SEGY data is processed and visualized,
then the seismic record profiles were obtained
(band-pass filtered from 3 to 15 Hz and the reduce
velocity is 6.0 km/s). According to the seismic
record profiles, we can judge the quality of the
seismic record data and the characteristics of travel-
time that from different seismic phases.
Due to the influence of ocean currents, the
location of OBS falls on the seafloor will deviate
from the deployed positions, the more depth of
water and the more deviation from the deployed
positions. Obtaining the exact location of OBS
is
particularly important to the data processing because
the location deviation of OBS will affect the travel-
time of deep seismic phases, such as Pg, PmP and
Pn (Pg is the refraction within the crust, PmP is the
Moho reflection, Pn is the Moho refraction).
Especially, the influence will become bigger when
carried out three-dimensional (3D) seismic
exploration. The Monte Carlo method is generally
used to invert the location which is closest to the
actual location of OBS (Ao, et al. 2010; Zhang, et al.
2013). The process is as follows: picking up the
travel-time of direct water phases from the seismic
record profiles and finding the corresponding shots.
The curves of travel-time are fitted by the quadratic
curve fitting method, then the velocity of seawater
and the depth of OBS are inversed. Taking the OBS
deployed positions as the center, with a radius of 2
km and the search area “R” is delineated, which is
possible location that OBS on the seafloor.
According to the standard normal distribution,
thousands of points are randomly generated by the
Monte-Carlo method within the area R (Figure 2 a
and b). In that case, the area R is basically covered.
By the gridded bathymetric data sets, calculate the
theoretical travel-time that is between each point in
area R and the shot points for pick up the direct
water wave (Figure 2 c). Next, we calculate the root-
mean-square residuals (RMS) between the
theoretical travel-time and the observed travel-time
(Figure 2 d) to find the latitude and longitude
Preliminary Results of the Southern Mariana Trench Wide-Angle Seismic Experiment
365
coordinates corresponding to the minimum value of
RMS that as the location of the corrected OBS. If
the relocated position of OBS is accurate, then the
direct water wave travel-time curve must be
symmetrical, so direct wave travel-time curve
symmetry or not can judge whether the correction is
correct.
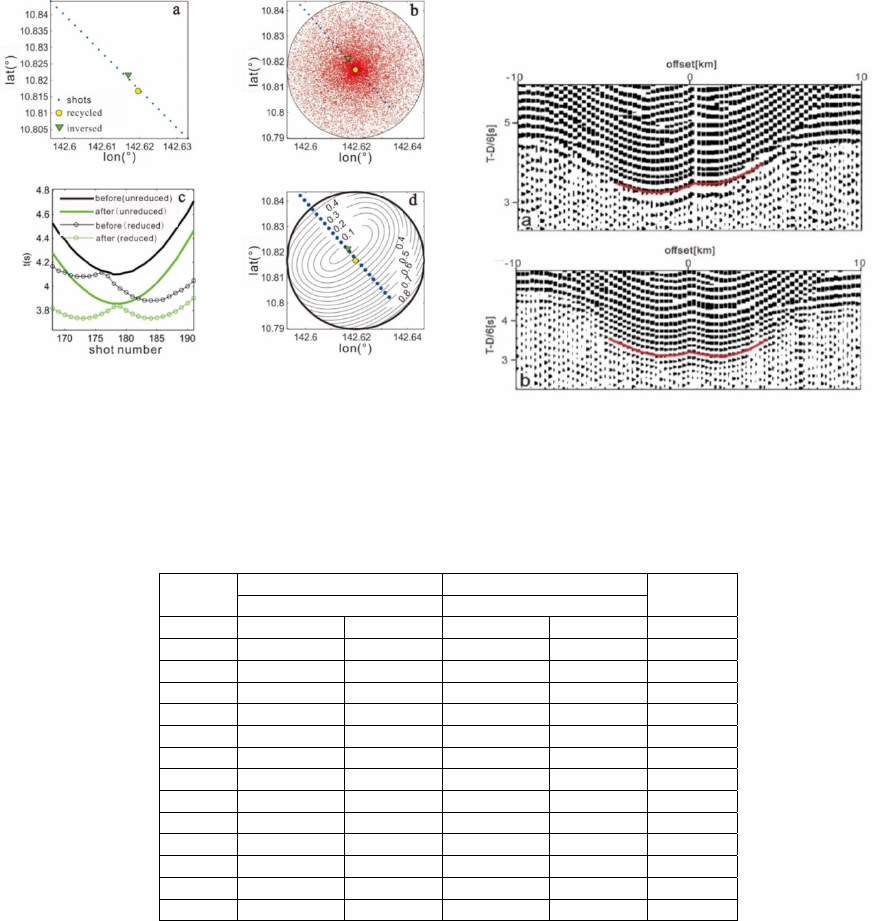
Figure 2: OBS relocation using the Monte-Carlo method
(taking obsY14 as an example).
(a) Contrast of OBS position and shot position before and
after correction (b) The search area R.
(c) The theoretical travel time and the reduce travel time
curve that before and after correction.(d) The contour map
of RMS.
Table 1 show that the relocation parameters of
OBS stations along the survey line. From Table 1,
we can know that the value of RMS is less than 6.0
ms, which indicate that the result of correction is
reliable. It can be seen from Figure 3 that the
symmetry of the direct water phases in seismic
record profile is better than before correction, it
means that the relocated position is closer to the
actual position.
Figure 3: Contrast of direct water phases (Pw) before and
after correction of obsY14. (a) before correction. (b) after
correction.
Table 1: Relocation parameters of OBS stations along the survey line.
Station Rec
y
cled
p
osition Relocated
p
osition RMS
(s)
lon
(
°
)
lat
(
°
)
lon
(
°
)
lat
(
°
)
obsY36 142.709656 10.713066 142.710154 10.713349 0.005819
obsY14 142.619663 10.816673 142.616404 10.821096 0.003510
obsY12 142.439940 11.020450 142.441096 11.022307 0.005462
obsY35 142.350578 11.122969 142.351797 11.124636 0.003075
obsY94 142.041620 11.475710 142.040969 11.480242 0.003310
obsY08 141.951940 11.578050 141.950584 11.583437 0.003457
obsY81 141.862190 11.680380 141.860966 11.685728 0.003630
obsY03 141.772726 11.782211 141.774115 11.784745 0.002996
obsY02 141.681278 11.883481 141.683936 11.887525 0.003319
obsL27 141.592537 11.986747 141.593683 11.989987 0.005529
obsL25 141.502816 12.088570 141.504691 12.091123 0.004712
obsY07 141.412384 12.191542 141.413171 12.195028 0.005393
obsY88 141.321854 12.293921 141.322159 12.298346 0.003661
obsY09 141.051429 12.600061 141.053252 12.602530 0.003493
IWEG 2018 - International Workshop on Environment and Geoscience
366
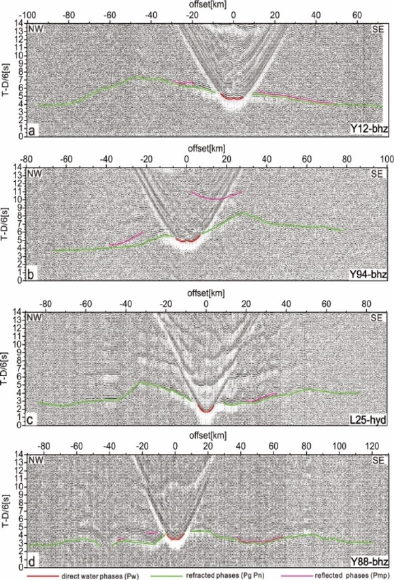
Figure 4: Deep seismic record profiles from different
tectonic units. (a). Y12 station, in the Pacific Plate (b).
Y94 station, in the Fore Arc (c). L25 station, in the
Mariana Arc (d). Y88 station, in the Mariana Trough.
4 THE DEEP SEISMIC RECORD
PROFILES
The Mariana subduction zone comprises Parece
Vela Basin (PVB), West Mariana Ridge (WMR),
Mariana Trough (MT), Mariana Arc (MA), Fore
Arc(FA), Trench and Pacific Plate. We selected
several seismic record profiles from different
tectonic units (Figure 4). We find that the major
phases, such as Pg and PmP, are identified and
different in the seismic records. To account for the
various S/N ratios and levels of data quality of the
different phases and OBS records, the picks were
assigned uncertainties ranging from 50 ms to 100 ms
based on the empirical parameterization of Zelt and
Forsyth (Zelt and Forsyth, 1994).
Pg is the refraction within the crust that is clearly
visible and can be identified on four stations, but the
pattern of the Pg travel-time curve varies
significantly, indicate that the complex of basement
topography and crustal structure in this area. The Pg
phase can be tracked about 160 km on Y12 station
(range of -90 km~70 km at offsets). From 70 km to -
47 km, the Pg travel-time is increasing. At -47 km, it
suddenly decreases. The probable reason is that the
Pacific plate subducting and result in large change of
basement topography near the trench (Figure 4a). On
Y94 station, the Pg phase is observed at offsets from
-65 km to 70 km. At 32 km, the Pg travel-time
suddenly decreases, probably due to the tapering of
depth from trench to forearc (Figure 4b). The Pg
phase can be tracked about 160 km on L25 station
(range of -85~75 km at offsets). In the range of -
40~-30 km, the Pg travel-time suddenly decreases,
which may be related to the underground anomalous
structure (Figure 4c). On Y88 station, the Pg phase
is observed at offsets from -85 km to 120 km. At -
50~-40 km, the Pg travel time changes dramatically
that probably related to volcano (Figure. 4d).
PmP is a reflected wave from the Moho interface.
Its extension range, the amplitude and energy vary
significantly on four stations, indicate that the
complex of Moho interface and crustal structure in
this area. On Y12 station, the Pmp phase is observed
at offsets range of -30~-20 km and 10~50km. From
SE to NW, the travel time of Pmp is increasing
which indicate that the depth of Moho interface
increases due to the subduction of Pacific plate
(Figure. 4a). On Y94 station, the Pmp phase is
observed at offsets range of -40~20 km and 3~28
km. The travel time of Pmp at 3~28 km is obviously
greater than -40~20 km, indicate that the depth of
the Moho interface is large between trench and
forearc (Figure 4b). On L25 station, the Pmp phase
is observed at offsets range of 20~35 km (Figure.
4c). On Y88 station, the Pmp phase is observed at
offsets range of 40~65 km, -19~10 km and -35~30
km (Figure. 4d). The amplitude and energy of PmP
are weak on that both stations, which shows that the
complex of crustal structure in Mariana arc-back arc
system.
5 CONCLUSIONS AND
EXPECTATIONS
The deep seismic experiment was carried out in
Challenger Deep and we have obtained all the
seismic record profiles. The process includes
original RAW data to SAC format, SAC format to
SEGY format and the OBS position relocations.
During the position relocations process, the Monte
Preliminary Results of the Southern Mariana Trench Wide-Angle Seismic Experiment
367
Carlo method is used to relocate the position of OBS
on seafloor. After a series of data processing, the
deep seismic record profiles were obtained. The
seismic record profiles indicate that seismic data are
of high quality in this deep seismic experiment. We
selected four seismic record profiles from different
tectonic units which includes the Pacific Plate, Fore
Arc, Mariana Arc and Mariana Trough.
Furthermore, we described the dramatic changes of
the Pg and Pmp phase from different profiles, which
related to basement topography and crustal structure.
The variety of phases travel-time show that the
complex of the crustal structure and evolution in the
Mariana Trench-Arc-Basin system.
In next step, we will construct the velocity
structure model by picking up the Pg and Pmp
travel-time. Combined with regional geological and
geophysical information, we will study the
characteristics of the deep structure of the Mariana
Trench-Arc-Basin system, we also wish to explore
the dynamics of Mariana subduction zone, analyze
the structure and evolution of this area.
ACKNOWLEDGMENT
The field work of this study was assisted by the all
staff and research workers of R/V Shiyan 3. This
work is supported by the Natural Science
Foundation of China (Nos. 41676042, 41376060,
and 41506046).
REFERENCES
Ao W, Zhao M H, Qiu X L, et al. 2010 The correction of
shot and OBS position in the 3D seismic experiment
of the SW Indian Ocean Ridge [J] Chinese Journal of
Geophysics (in Chinese) 53(12) 2982–2991
Barry K M, Cavers D A, Kneale C W 1975
Recommended standards for digital tape formats [J]
Geophysics 40(2) 344–352
Caluert A J, Klemperer S L, Akahashi N, et al. 2008
Three-dimensional crustal structure of the Mariana
island arc from seismic tomography [J] J Geophys Res.
113(B1) 1-24. doi : 10.1029/2007 JR004939
Qiu X L, Zhao M H, Ao W, et al. 2011 OBS survey and
crustal structure of the Southwest Sub-basin and
Nansha Block, South China Sea [J] Chinese Journal of
Geophysics (in Chinese) 54(12) 3117–3128
Ruan A G, Li J B, Feng Z Y, et al. 2004 Ocean bottom
seismometer and its development in the world
Donghai Marine Science (in Chinese) 22(2) 20-27
Takahashi N, Kodaira S, Tatsumi Y, et al. 2008 Structure
and growth of the Izu-Bonin-Mariana arc crust: 1.
Seismic constraint on crust and mantle structureof the
Mariana arc–back-arc system [J] J Geophys Res 113
B01104. doi:10.1029/2007JB005120
Tatsumi Y, Shukuno H, Tani K, et al. 2008 Structure and
growth of the Izu-Bonin-Mariana arc crust: 2. Role of
crust-mantle transformation and the transparent Moho
in arc crust evolution [J] J Geophys Res. 113(B02203)
1–19 doi:10.1029/2007JB005121
Xia S H, Qiu X L, Zhao M H, et al. 2007 Data processing
of onshore-offshore seismic experiment in Hong Kong
and Zhujiang River Delta region Journal of Tropical
Oceanography (in Chinese) 26(1) 35-38
Xia S H, Zhao M H, Qiu X L et al. 2010 Crustal structure
in an onshore-offshore transitional zone near Hong
Kong,northern South China Sea [J] Journal of Asian
Earth Science.s 37(5) 460-472
Zelt C and D Forsyth 1994 Modeling wide-angle seismic
data for crustal structure:Southeastern Grenville
Province J. Geophys Re.s 99(B6)11,687–11,704,
doi:10.1029/93JB02764
Zhao M H, Qiu X L, Xia K Y, et al. 2004 Onshore-
offshore seismic data processing and preliminary
results in the NE South China Sea [J] Journal of
Tropical Oceanography (in Chinese) 23(1) 58–63
Zhang L, Zhao M H, Wang J, et al. 2013 Correction of
OBS position and recent advances of 3D seismic
exploration in the central sub-basin of South China
Sea [J] Earth Science-Journal of China University of
Geosciences (in Chinese) 38(1) 33–42
IWEG 2018 - International Workshop on Environment and Geoscience
368
