
The Influence of Climate Change on the Fresh Water Plume in the
Pearl River Estuary
Yuxiang Chen
1,*
,Min Zhang
2
,Huazhi Zou
3
,Pimao Chen
1
and Zhenzhao Tang
1
1
South China Sea Fisheries Research Institute, Chinese Academy of Fishery Sciences. Guangzhou, Guangdong, 510300,
China;
2
South China Sea Marine Prediction Center, State Oceanic Administration, Guangzhou, China;
3
Key Laboratory of the Pearl River Estuarine Dynamics and Associated Process Regulation, Ministry of Water Resources,
Guangzhou, China.
Email: 543449929@qq.com.
Keywords
: Sea level rise, water plume, Pearl River Estuary, numerical simulation
Abstract: In this study, a 3D mathematical model of Pearl River Estuary (PRE) and offshore is constructed. Numerical
simulation is applied to study the mechanism of the plume of the PRE and the influence of future sea level
rise. The model is verified by runoff and water elevation during the July 1999 flood season. The harmonic
constants obtained from the simulation are compared with the existing results, and the results are in good
consistency. The numerical simulation shows that the expansion of the plume is mainly affected by runoff,
topography, Coriolis force, wind and sea surface height. The rise of sea level will make the salt isoline lines
of the PRE move to upstream, but it does not affect the overall scope of the fresh water, the range of fresh
water is mainly influenced by upstream flow. After the sea level rise the fresh water of the west coast of
Guangdong Province appears to be expanded to the west in spring, summer and autumn. At the same time,
the estuary circulation of the north-south is enhanced. The increased estuary circulation causes more fresh
water flows out through the surface, which strengthened the westward expansion of the Coriolis force. In
summer the special symmetrical structure of plume will be destroyed after sea level rise which is also the
result of the change in the estuary circulation.
1 INTRODUCTION
The expansion of fresh water plume in the estuary
has been a problem of great concern in the study of
physical oceanography. The Pearl River is the
second largest river in China. Saltwater intrusion has
attracted widespread attention because of of its
negative impacts on the water supply. However, the
fresh water plume in water resource conservation
status has not been correctly recognized. Runoff
carries a lot of sediment, nutrients and other
substances into the PRE and its adjacent sea area, it
has a great influence on the physical, chemical and
biological processes and the movement of sediment
in the surrounding sea. Studying the law of motion
and mechanism of the PRE plume has critical
theoretical significance and practical value for the
saltwater intrusion, freshwater erosion, water
resource utilization, sediment transport and
ecological environment in PRE. Research shows
that: fresh water is mainly spread out of the sea in
the form of plume flow, formation of low saltwater
mass and saltwater fronts with pinnate distribution.
The plume is mainly affected by runoff, topography,
tide, wind, Coriolis force, baroclinic effect,
background circulation, and sea level height.
In China research on freshwater plume is mainly
based on field observation, satellite remote sensing,
theoretical research, numerical simulation and
numerical simulation combined with other methods.
The research on the fresh water plume is mainly
concentrated on the Yangtze River in China (Wang
et al., 2012; Zhang et al., 2014). Before 2010, there
were relatively few studies on the plumes of the
PRE. Recently, with the richness of data and the
improvement of technical means, the studies of fresh
water plume in the PRE received many attetions. In
the analysis of measured data, Dong et al observed
386
Chen, Y., Zhang, M., Zou, H., Chen, P. and Tang, Z.
The Influence of Climate Change on the Fresh Water Plume in the Pearl River Estuary.
In Proceedings of the International Workshop on Environment and Geoscience (IWEG 2018), pages 386-394
ISBN: 978-989-758-342-1
Copyright © 2018 by SCITEPRESS – Science and Technology Publications, Lda. All rights reserved
the plume of Pearl River during the flood and dry
seasons, the results showed that, high layer
stratification of the plume, the estuarine surface
forms plume flow, and the plume deflects eastward
from the entrance under the south-west monsoon in
the flood season, while during the dry season, the
east of the estuary is a vertical and homogeneous
high salt water and the plume is deflected westward
under the action of geostrophic force (Dong et al.
2004). The surface temperature and salinity
measurements in the northern South China Sea were
analyzed (Sun et al., 2008), indicating that the
southwest monsoon increased and more fresh water
expands eastward, the sea level in the near shore is
higher and the plume of the Pearl River is expanding
westward (Pang 2006). Based on the measured data,
the dynamic characteristics of the plume in summer
were analyzed (Ou et al., 2009). Yang yang found
that the plume of Pearl River will also extend to the
western and esatren, specifically east can be
extended to the center of the Red Bay, and the west
can be extended to the east of Hailing Island. The
plume expands to 21.2 °N driven by the southwest
monsoon, and the plume is very obvious above the
10m depth (Yang and Meng et al., 2010). In the
numerical simulation of plume, the hydrodynamic
force of the plume in the PRE and the small scale
circulation in the winter plume are studied by the
POM model, that the plume of PRE formed by the
river water and high brine of shelf, the deep plume is
not part of the basic tidal, wind and river flow, while
the tide and river flow affects the surface
characteristics of the plume (Wong et al. 2003A;
Wong et al. 2003B; Wong et al., 2004C). The
interaction between the summer Pearl River plume
and the upwelling of the south-west wind driven by
the South China Sea is investigated by the measured
and numerical simulation (ROMS) (Gan et al. 2009).
In recent years, numerical simulation and the
combination of numerical simulation and
measurement have a lot of appearances (Lu et al.
2010; Wang et al. 2012; Shu et al. 2011; Pan et al.,
2014; Lai et al. 2015; Zeng et al. 2015; Yan et al.,
2015).The method of remote sensing inversion has
also begun to be adopted by researchers (Lu and
Zhan 2013; Zhaoyun et al. 2017; Qiu et al. 2017).
As far as we know, there is little research on the
impact of sea level change on the plume of the Pearl
River Estuary. Therefore, this research is 1) to study
the rule of plume movement in the Pearl River
Estuary, and 2) to understand the influence and
dynamic mechanism of sea level change on the
plume of the Pearl River Estuary.
2 DATA AND METHOD
2.1 Data and Model Description
The FVCOM developed by Chen changsheng and
his team at University of Massachusetts was used in
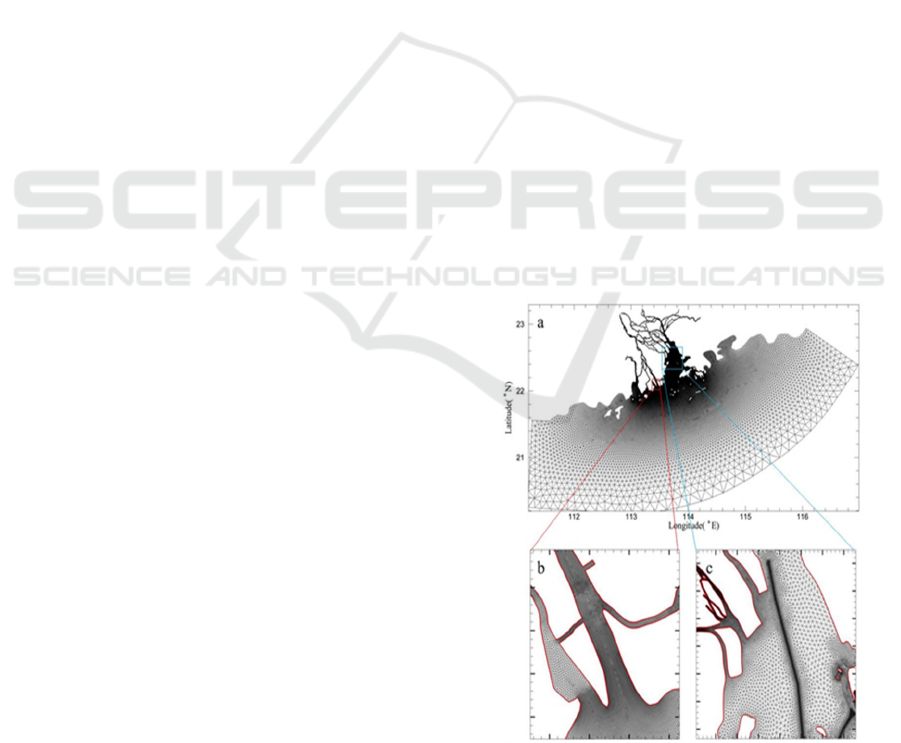
this research (Chen et al., 2003). Grid and water
depth are shown in Figure 1 and 2. Based on the
existing model (Chen et al., 2014; Chen et al.,
2016), at the open ocean boundary, the model was
forced by water elevation that was calculated by the
harmonic constants of 8 main tidal constituents (M
2
,
S
2
, N
2
, K
2
, K
1
, O
1
, P
1
, Q
1
) interpolated from the
results in the South China Sea (Li et al., 2002). The
measured river discharges (Figure 4) in every 6
hours from 6 major rivers(marked in red texts in
Figure 3) were included to provide the freshwater
input into the domain. The surface wind forcing is
monthly average wind field around the world gained
from National Oceanic and Atmospheric
Administration . The initial thermohaline field is the
monthly climate data from the South China Sea
Marine Atlas (Editorial Board for Marine Atlas,
2006) with the existing observation data assimilated
(Ji et al., 2015).
Figure 1: Model grid (a) and local grid (b Modalmen and c
Lingdingyang).
The Influence of Climate Change on the Fresh Water Plume in the Pearl River Estuary
387
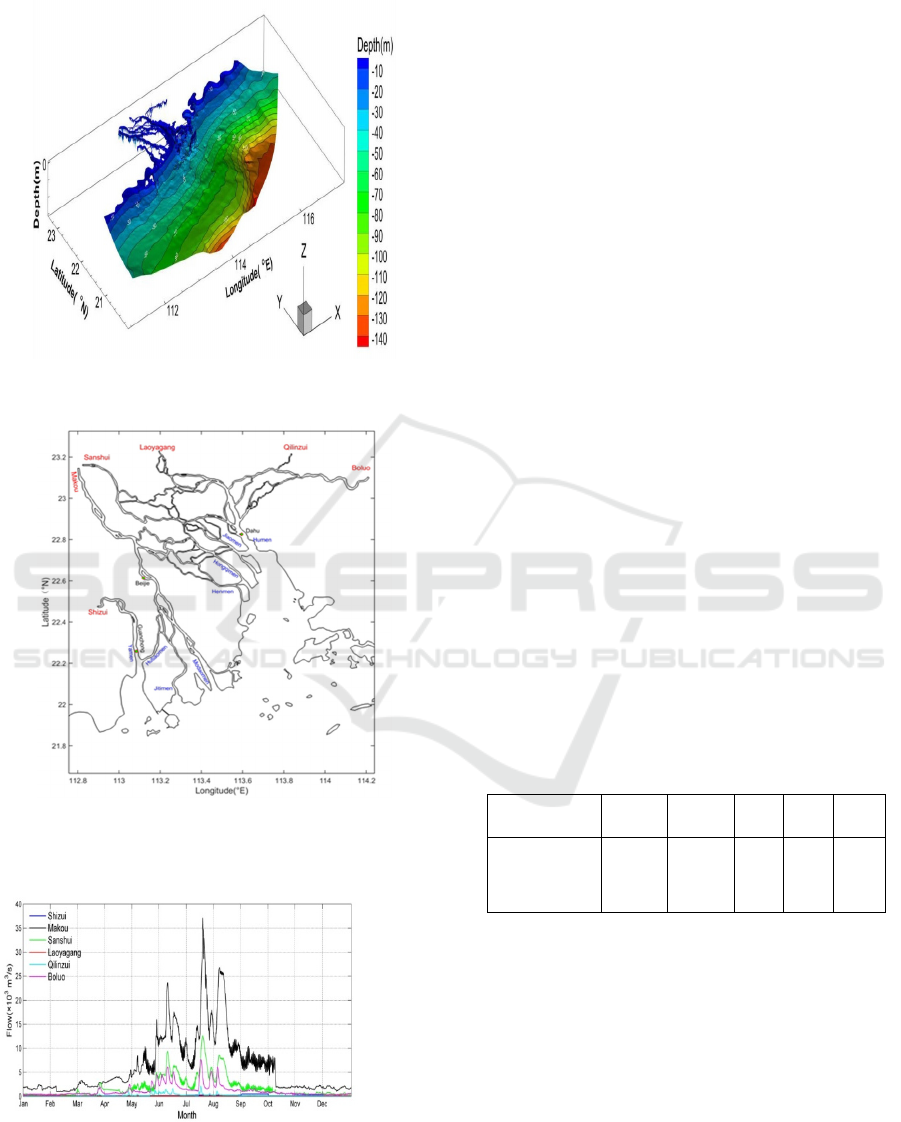
Figure 2: The 3D water depth of the study area.
Figure 3: Upstream boundary, estuary and station in the
study area.
Figure 4: The measured river discharges in every 6 hours
from 6 major rivers in 2006.
2.2 Model Validation
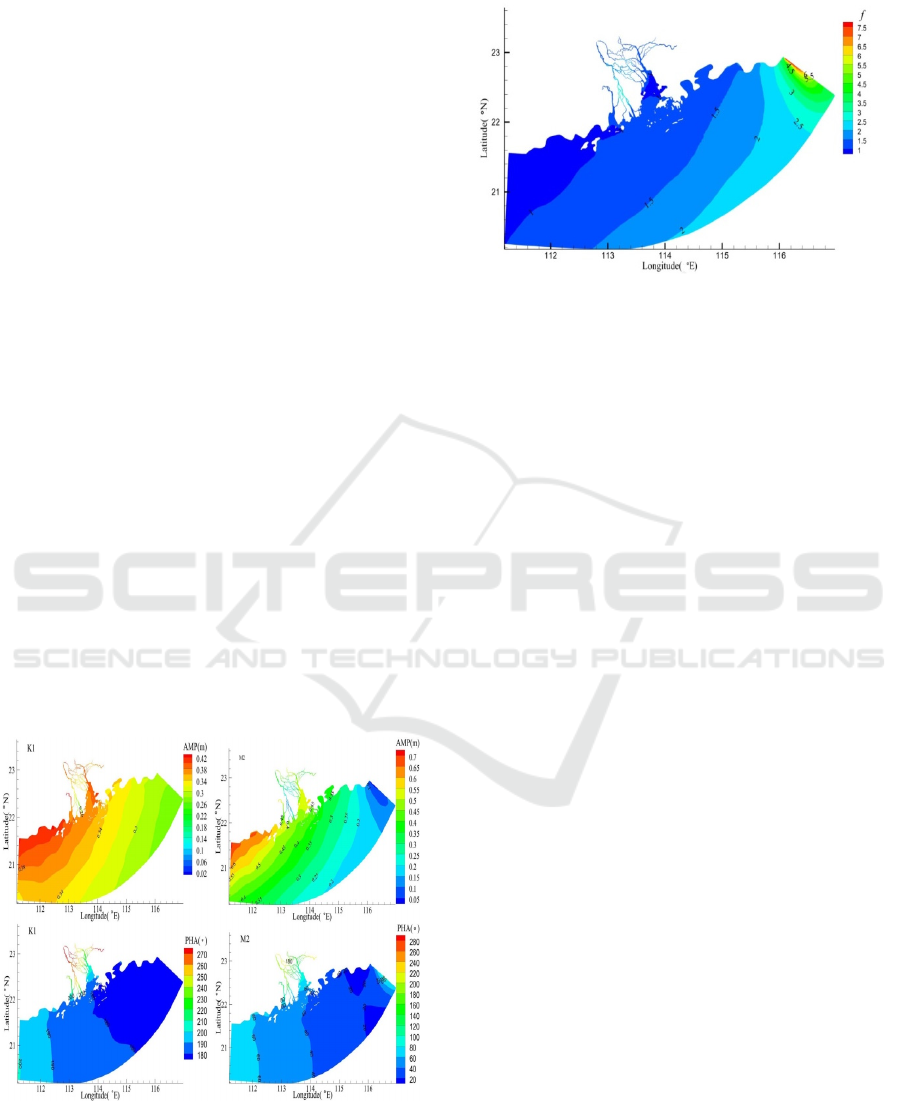
2.2.1 Verification of Water Elevation
The flow model validation salinity in previous
studies have been published (Chen et al., 2016). This
paper mainly studies the plume, and plume mainly
in the summer wet period. Therefore verify the
model by selecting some of the measured data
during the July 1999 flood.
Figure 5, the rise of the water elevation caused
by flood is very obvious, the water elevation is
positive from Makou to Beijie in Xijiang river, it is
no flood stream, the highest water elevation uplift to
6 m at Makou, and Beijie is close to 3 m. The water
elevation in the whole river network area has been
raised dramatically, the mesh of mode faces great
pressure. To further quantify the accuracy of model
results, we calculated the root mean square error
(RMSE), relative error (RE), correlation coefficient
(r), nash-sutcliffe efficiency coefficient (NSE), and a
skill assessment parameter (Table 1). Although the
RMSE of Makou reached 0.18 m, the simulation
precision is acceptable (RE is 3.8%) compared with
the actual elevation of 6 m, r values are larger than
0.85, and skill values are larger than 0.9. The
simulation results can well reflect the changes of the
water elevation in the river network during the flood
period. Therefore, the model used in this paper can
be adequate to deal with the flood. Further the
model can be used for the next simulation of plume.
Table 1: RMSE, RE, skill, r, and NSE for modeled
elevation.
Observation
station
RMSE
(m)
RE(
%)
skill r NSE
Guanchong
Dahu
Beijie
Makou
0.09
0.07
0.05
0.18
15.6
7.3
0.5
3.8
0.97
0.98
0.97
0.91
0.96
0.98
0.97
0.99
0.93
0.96
0.92
0.70
IWEG 2018 - International Workshop on Environment and Geoscience
388
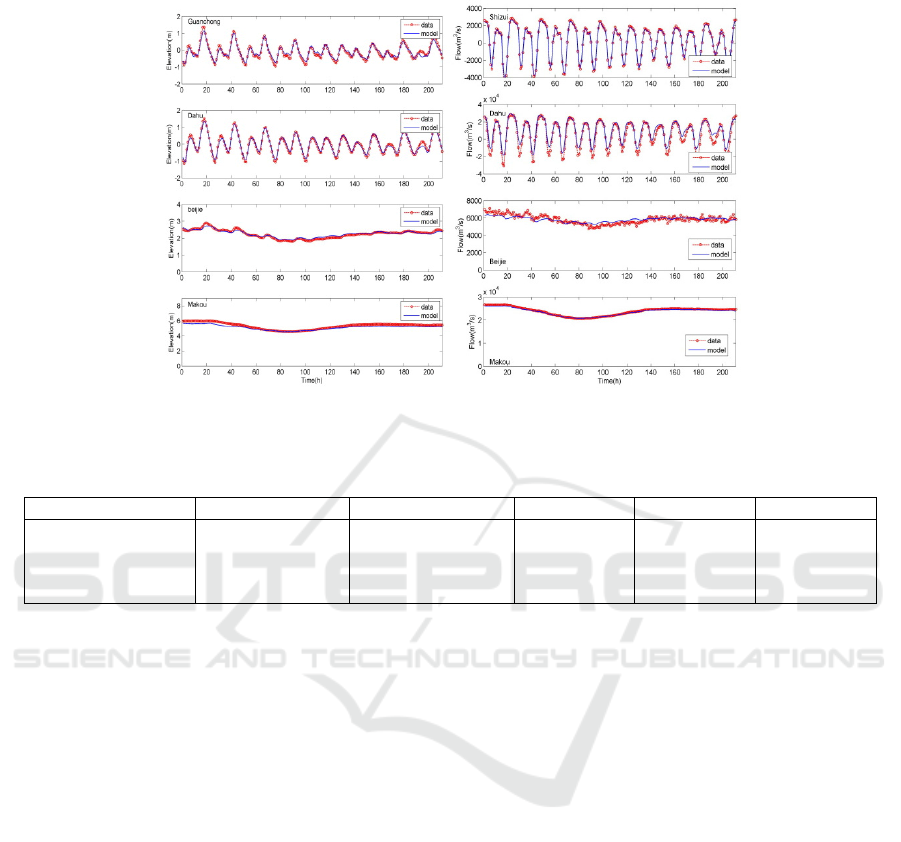
Figure 5: Water elevation (left) and flow (right) verification diagram (the actual red ring dotted line is the measured value,
the blue line is the simulated value).
Table 2: RMSE, RE, skill, r, and NSE for modeled flow.
Section RMSE(
m
3
/s) RE(%) skill
r
NSE
Shizui
Dahu
Beijie
Makou
121.6
5050.8
325.6
307.0
5.1
3.6
0.2
1.1
0.99
0.96
0.79
0.99
0.99
0.97
0.79
0.99
0.99
0.87
0.55
0.96
2.2.2 Verification of Flow
Table 2 is the RMSE, RE, skill, r, and NSE for
modeled flow. The RMSE is larger near the Dahu
entrance, but compared to the peak flow (40000
m
3
/s), the RE is smaller, so the result is acceptable.
The skill, r, and NSE are less than 0.85 in Beijie,
this means the simulation results are close to the
average value of the observations (RE is 0.2%), the
measured value fluctuates greatly, possibly due to
observation errors, and the overall results are
reliable. The simulation results can well reflect the
changes of the flow in the river network during the
flood period. Therefore, the model used in this paper
can be adequate to deal with the flood. Further the
model can be used for the next simulation of plume.
3 RESULTS
3.1 Tide Harmonic Constants
The spread of the plume is very wide, the accuracy
of the simulation results over the entire area is
particularly important. Through the the numerical
harmonic analysis of the simulation results, the
amplitude and phase distribution of
eight main constituents were obtained (Figure 6, list
only K
1
and M
2
). The results of this paper are
compared with the existing results. The amplitude of
the K
1
is about 0.28 m in the eastern part of the
simulation area, and the amplitude increases
gradually in the process of spreading westward, the
maximum amplitude is 0.42 m (increased 50%). The
amplitude of O
1
is between 0.24-0.34 m, and the
amplitude of P
1
is between 0.09-0.13 m, the
amplitude of Q
1
is located at 0.04-0.06 m. It can be
found that the amplitude of P
1
is twice of Q
1
. The
phase of P
1
is equal to K
1
, while the phase of Q
1
lags
behind K
1
. The amplitude of K
1
is 0.38-0.40 m, the
amplitude of O
1
is 0.28-0.30 m, the amplitude of P
1
is 0.09-0.10 m, and the amplitude of Q
1
is 0.05-0.06
m in the Lingdingyang area.
The semidiurnal constituent in the simulated area
is dominated by the M
2
. The amplitude of M
2
increased significantly in the process of spreading
westward (from 0.1 m to 0.65 m), this result is very
close Wang Biao (0.12-0.56 m) (Wang, 2012).
There is a low value of phase in the southeast corner
(Figure 6), this indicates that the semidiurnal
constituent from the open sea divides into two
The Influence of Climate Change on the Fresh Water Plume in the Pearl River Estuary
389
branches, and spreads westward and northeast
respectively. This result is consistent with the
existing research (Wang, 2012, Zhu et al. 2009). The
amplitude of S
2
tide is about half of M
2
, between
0.04 m and 0.28 m, the amplitude of K
2
is about
0.01-0.12 m, and the amplitude of N
2
is about 0.04-
0.14 m. Overall, the amplitude and phase of M
2
, S
2
,
K
2
and N
2
have great similarity in the distribution.
M
2
is significant in the Lingdingyang sea, reach to
0.45-0.55 m, the amplitude of S
2
, K
2
and N
2
are
0.26 m, 0.06 m and 0.10 m.
3.2 Tide Constant
The tidal types are generally different for different
estuaries. Dietrich defines the tidal coefficient F (F=
(K
1
+O
1
) / (M
2
+S
2
)) (Dietrich, 1963). Tidal
coefficient F less than 0.25 is semidiurnal tide type;
0.25-1.5 is mixed tide, and semidiurnal tide is
dominant; 1.5-3.0 is mixed tide, and diurnal tide is
dominant; greater than 3.0 is diurnal tide. The tidal
coefficient F near the PRE is mostly between 0.8
and 1.5 (Figure 7). This indicates that the tidal type
in the PRE is mixed tide dominated by semidiurnal
tide, which is consistent with the result of Wang
Biao (Wang, 2012). The tidal coefficient F increased
to 2-3 in the river network. The tide change to mixed
tide dominated by diurnal tide. This means that the
influence of the diurnal tide is greater than semi-
diurnal tide in the river network. The results of tide
are consistent with the existing research results, the
simulation results are reasinable for further research.
Figure 6: The harmonic constants of diurnal tide (left) and
Semidiurnal tide (right) in PRE.
Figure 7: The distribution of tidal coefficient.
3.3 Analysis on the Law and
Mechanism of Fresh Water
Movement in the Pearl River
Estuary
After the Pearl River flows into the sea, it mixes
with the local seawater to form low salt water. This
is the plume of the Pearl River. This paper uses the
32 PSU salinity line as the boundary between the
fresh water plume and the high salt water in the
open sea. The following will analyze the extending
form and dynamic mechanism of the Pearl River
plume during the season.
The main factors considered in this paper are
five, tidal, wind, Coriolis force, runoff, and sea
level. This section mainly considers the seasonal
changes in sea level. The runoff is based on
measured data at the upstream boundary. Tides are
given by model predictions combined with
measured data, which incorporate sea level heights
for each season. The wind is downloaded from the
Internet using the monthly average wind
interpolated to the grid by region. Four experimental
cases are set up for the plume, named as Case_1,
Case_2, Case_3, Case_4. Case_1 is an actual case
study, Case_2 is a case without wind, Case_3 is a
case without Coriolis force, and Case_4 is a case
without Wind and Coriolis force. At the same time,
two sea level scenarios have also been considered.
Base is the sea level scenario of 2006, P80 is
scenario after sea level rises about 80cm. The results
are monthly mean value. Through the comparative
analysis of experimental results, the distribution of
plume in the Pearl River Estuary during different
seasons was ascertained. We will analyze the
distribution of plume during each season and the
influence mechanism of various factors of the PRE.
IWEG 2018 - International Workshop on Environment and Geoscience
390

The simulation results of 2006 are compared with
the observations of Yang Yang (Yang and Meng et
al., 2010). The distribution results are consistent.
Due to space limitations, this paper only lists
summer results.
In spring, the surface plume of PRE is mainly
westward along the coast. The plume can extend
south to near 21.4 °N. The factors causing the
westward expansion of plume include Coriolis force,
northeast monsoon and sea level height. The
Coriolis force is the main driving force of west
expansion. The northeast monsoon will cause the
Ekman effect to significantly restrict the outward
expansion. The bottom plume is also mainly west-
expanded, except that the area of plume is
significantly smaller than the surface layer.
In summer. The surface plume area of the PRE
reaches the maximum in the whole year, mainly
because the runoff reaches the maximum value
throughout the year. At the same time, the plume
echibits a unique symmetrical structure (Figure 8,
Black box), the main reason is the Ekman effect of
the southwest monsoon. The summer surface plume
extends westward and eastward simultaneously, The
driving force for the expansion to the west is the
Coriolis force and sea level, and the driving force for
the expansion to the east is the southwest monsoon
and sea level. The bottom plume still extends to the
west, and the monsoon has no effect on the
distribution of the plume at the bottom.
Figure 8: The plume distribution in the four cases under
Base scene in summer.
In autumn, the runoff weakened significantly, the
monsoon began to change, and the northeast wind
gradually strengthened. The northeast monsoon and
the Coriolis force restrict the spread of plume into
the open sea. The surface plume constrict to the
coast and form a significant northeast-southwest
plume. At this time, the Pearl River plume is mianly
westward. The dynamic factors for westward
expansion include Coriolis force, northeast monsoon
and sea level height. Although the northeast
monsoon hindered the eastward expansion of the
plume, there is still an isolated low-salt center in the
outside of Daya Bay. This center is the remnant of
the eastward plume in summer, which is separated
from the body of the plume after the autumn
monsoon shifts to become an isolated water mass..
There is also a low-salt center at the bottom of the
east of Daya Bay, which is smaller than the surface
and closer to the shore. The bottom plume still
expands to the west, and the main driving force is
the Coriolis force. The monsoon has no effect on the
bottom.
The surface plume of the PRE are mainly west
expansion under the influence of the northeast
monsoon and Coriolis force in the winter, and is
limited to shallow water areas along the western
coast of Guangdong. The main factors of western
expansion are Coriolis force, northeast monsoon,
and sea level height. The range of plume is smallest
throughout the year in winter.
3.4 Prediction and Mechanism
Analysis of the Impact of Sea Level
Rise on the Fresh Water of the
Pearl River Estuary
The previous section analysed the law and dynamic
mechanism of the plume in the PRE. This section
focuses on the analysis of the effects of sea level rise
on the plume in the PRE. Figure 9 is the plume
distribution of Case_1 under Base and P80 scene in
summer.
In spring, the plume of the PRE will move to
north as a whole after the rise of sea level, and the
range does not change much. The westward
extension of the plume on the western coast of
Guangdong is slightly strengthened.
The Influence of Climate Change on the Fresh Water Plume in the Pearl River Estuary
391
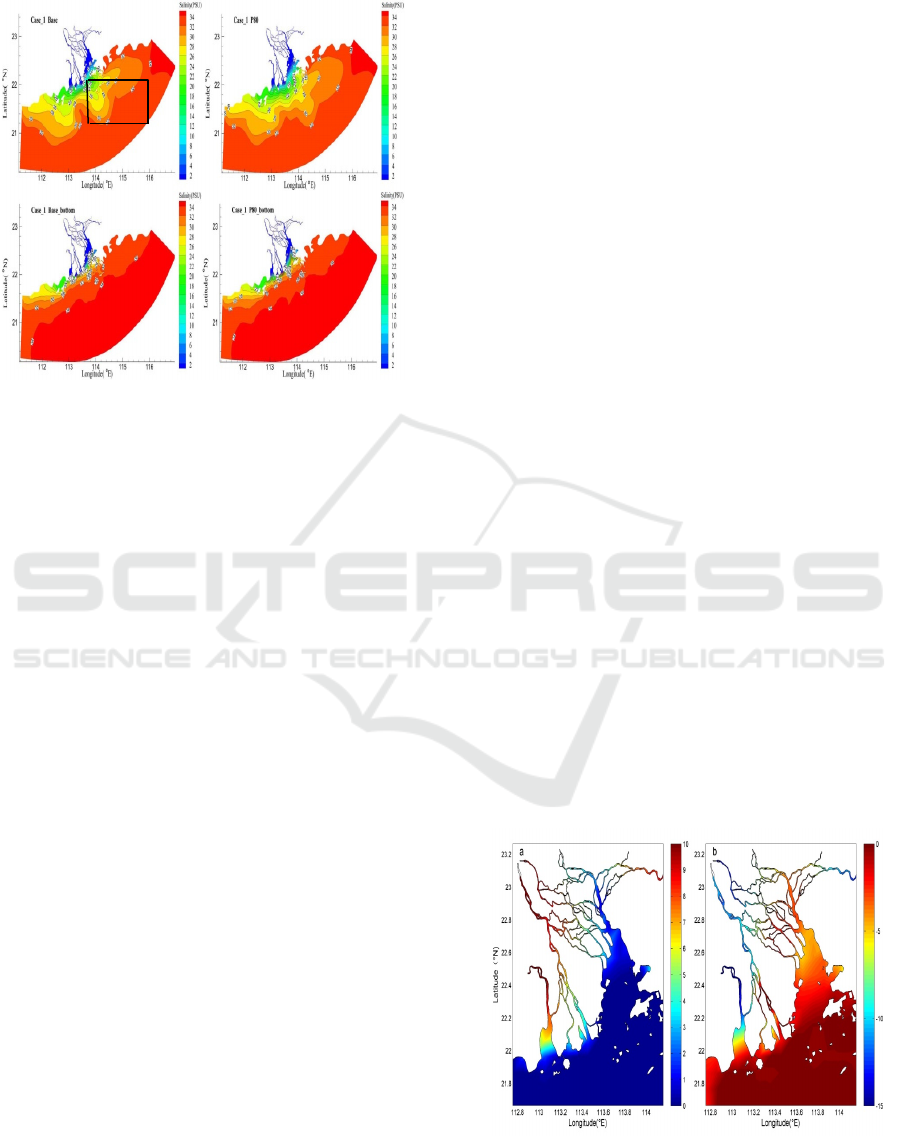
Figure 9: The plume distribution of Case_1 under Base
and P80 scene in summer.
The most obvious effect of sea level rise on
surface plume in summer is destruction of the
original symmetrical distribution structure (Figure
9). The reason is the strengthen of north-south
estuarine circulation in PRE, more fresh water flow
into the open sea through the surface after sea level
rise. The range of eastern expansion of the plume in
the summer does not change much after the rise of
the sea level. However, the easternmost position has
shrunk slightly to the west. The westward expansion
of the plume in the western coast of Guangdong has
shown a trend of increasing westward expansion.
In autumn. The isohalines outside the estuary are
obviously moving northward after the sea level rise,
the isohaline of 32 psu extend slightly eastward. The
low-salt center in the eastern coast of Guangdong
appears to move west, the size of the water mass
does not change. The western plume of the western
coast of Guangdong has seen a phenomenon of west
expansion, and the longest distance to the southward
expansion has also increased. At the bottom, the
original low-salt water mass disappeared. The range
of the bottom plume decreases slightly after sea
level rise. Because the plume area is inherently
small, sea level rise has not affected the range of
winter plume.
4 DISCUSSIONS
Sea level rise is a long-term process. For ease of
study, this paper does not consider long-term change
in runoff, topography and other factors. Previous
study has found that sea level rise will affect the
tide, salinity, saltwater intrusion, and estuary
circulation in the PRE (Chen et al., 2016). It also
affects the plume of this paper. The most
fundamental reason for these effects is that the sea
level rise has changed the WSS (Water Surface
Slope) of the river. The decrease of WSS means that
the water level gradient on the upstream and
downstream is reduced, and the runoff suppression
force is weakened. Runoff and tide have always
been a shifting relationship at the estuary. Runoff
suppressing force weakens, and tidal action will
strengthen in the river channel. Previous research
has found that tidal range and current will increase
and come earlier in the river channel after sea level
rise, the more obvious the upstream (Chen et al.,
2016). The results of the harmonic analysis also
illustrate this situation (Figure 10). Of course, the
impact of sea level rise on tide is limited to the river
channel and estuaries that are affected by tide. There
is almost no impact on the open sea. The Pearl River
estuary has a north-south estuarine circulation, high-
salinity seawater upstreams from the bottom layer
under tidal action, and fresh water flow out from the
surface. After the sea level rise, the tidal effect
increases, and more high-salinity seawater upstream
from the bottom. Although the runoff suppressing
force weakens, more freshwater flows out from the
surface. This enhances the north-south estuary
circulation. More freshwater float on high-salinity
seawater after rushing out of the estuary, continue to
expand outwards due to inertia and Coriolis force.
This breaks the unique symmetrical structure of the
summer and also resulted in the westward expansion
of the plume to strengthen.
Figure 10: Difference of M2 tidal amplitide(a, cm) and
phase lag(b, °) between the Base and P80.
IWEG 2018 - International Workshop on Environment and Geoscience
392

5 CONCLUSIONS
The factors causing the westward expansion of
plume include Coriolis force, northeast monsoon
and sea level height in spring. In summer, the plume
echibits a unique symmetrical structure, the main
reason is the Ekman effect of the southwest
monsoon. The summer surface plume extends
westward and eastward simultaneously, The driving
force for the expansion to the west is the Coriolis
force and sea level, and the driving force for the
expansion to the east is the southwest monsoon and
sea level. The dynamic factors for westward
expansion include Coriolis force, northeast monsoon
and sea level height in autumn. Although the
northeast monsoon hindered the eastward expansion
of the plume, there is still an isolated low-salt center
in the outside of Daya Bay. The surface plume of the
PRE is mainly west expansion under the influence
of the northeast monsoon and Coriolis force in the
winter, and is limited to shallow water areas along
the western coast of Guangdong.
Sea level rise will cause the salt isohaline lines
of the PRE to migrate to the upstream, but it will not
change the overall extent of the plume, and the range
of plume is mainly affected by the upstream runoff.
The plume on the coast of western Guangdong
appears to have expanded westward in the spring,
summer, and autumn seasons after the sea level rise.
In the summer and autumn, the plume's eastward
expansion distance decreased. The unique
symmetrical structure of summer plume will be
destroyed. The reasons for these changes are the
decrease of the WSS and the strengthening of the
estuary circulation after sea level rise.
ACKNOWLEDGEMENTS
This research was jointly supported by Central
Public-interest Scientific Institution Basal Research
Fund, South China Sea Fisheries Research Institute,
CAFS (NO. 2016TS37), and Shenzhen science and
technology innovation project
(JCYJ20160331141759795).
REFERENCES
Chen C S, Liu H D and Robert C B 2003 An unstructured
grid, finite-volume, three-dimensional, primitive
equations ocean model: application to coastal ocean
and estuaries Journal of Atmospheric and Oceanic
Technology 20 159-186
Chen Y X, Ji Q Y and Xu Q, et al. 2014 Hydrodynamic
simulation of xiangshan harbor and adjacent water
based on the high resolution numerical model
Modeling and Computation in Engineering
Ⅲ
149-
157
Chen Y X, Zuo J C, Zou H X, Zhang M and Zhang K R
2016 Responses of estuarine salinity and transport
processes to sea level rise in the Zhujiang (Pearl
River) Estuary Acta Oceanologica Sinica 35(5) 38-48
Dietrich G 1963 General oceanography: an introduction
New York: Wiley.
Dong L X, Su J L and Wong L A, et al. 2004. Seasonal
variation and dynamics of the Pearl River plume[J].
Continental Shelf Research 24 1761-1777
Editorial Board for Marine Atlas 2006 Marine Atlas of
South China Sea (Hydrology) Beijing: China Ocean
Press 13-168
Gan J P, Li L and Wang D X, et al. 2009 Interaction of a
river plume with coastal upwelling in the northeastern
South China Sea Continental Shelf Research 29 728-
740
Ji Q Y, Zhu X M and Wang H, et al. 2015 Assimilating
operational SST and sea ice analysis data into an
operational circulation model for the coastal seas of
China Acta Oceanologica Sinica 34(7) 54-64 doi:
10.1007/s13131–015-0691-y
Lai Z, Ma R and Gao G, et al. 2015. Impact of
multichannel river network on the plume dynamics in
the Pearl River estuary J. Geophys. Res. Oceans 120
5766-5789
Li P L, Zuo J C and Li L, et al. 2002 Orthogonalized
convolution method for analysis of South China Sea
tidal data from topex/poseidon Oceanologia et
Limnologia Sinica (in Chinese), 33(3) 287-295
Lu L Y and Zhan J M 2013 Study on the expansion of
fresh water in the Pearl River Estuary based on
Remote Sensing 316-324 (in Chinese)
Lu Z M and Gan J P, et al. 2010 The influence of coastal
upwelling and a river plume on the subsurface
chlorophyll maximum over the shelf of the
northeastern South China Sea Journal of Marine
Systems 82 35-46
Ou S Y, Zhang H and Wang D X 2009 Dynamics of the
buoyant plume off the Pearl River Estuary in summer
Environ Fluid Mech 9 471-492
Pan J, Gu Y and Wang D 2014 Observations and
numerical modeling of the Pearl River plume in
summer season J. Geophys. Res. Oceans 119 2480-
2500
The Influence of Climate Change on the Fresh Water Plume in the Pearl River Estuary
393

Pang H L, et al. 2006 Analysis of diffuse route of the
Zhujiang River diluted water in summer Marine
Forecasts 23(3) 58-63 (in Chinese)
Qiu Chunhua, Su Danyi and Mao Huabin, et al. 2017
Observational evidence for turbulent effects on total
suspended matter within the Pearl River plume
Continental Shlf Reasearch 151 15-22
Shu Y Q, Wang D X and Zhu J, et al. 2011 The 4-D
structure of upwelling and Pearl River plume in the
northern South China Sea during summer 2008
revealed by a data assimilation model Ocean
Modelling 36 228-241
Sun Z Y, Hu J Y and Mao H B 2008 Underway
observation of surface temperature and salinity in
north south china sea in September 2006 Journal of
tropical oceanography 27(1) 6-10(in Chinese)
Wang B 2012 Saltwater intrusion in the Pearl River
Estuary Shagnhai: East China Normal University. (in
Chinese)
Wang D, Zhuang W and Xie S P, et al. 2012 Coastal
upwelling in summer 2000 in the northeastern South
China Sea J. Geophys. Res. 117(C4) 76-85
Wang J F, Wang Y and Wang G 2012 Analysis of
direction change mechanism of the changjiang river
diluted water based on FVCOM and observation
Advances in earth science 27(2) 194-201(in Chinese)
Wong L A and Chen J C, et al. 2003 A model study of the
circulation in the Pearl River Estuary (PRE) and its
adjacent coastal waters: 1. Simulations and
comparison with observations Journal of geophysical
research 108(C5) 3156
Wong L A and Chen J C, et al. 2003 A model study of the
circulation in the Pearl River Estuary (PRE) and its
adjacent coastal waters: 2. Sensitivity experiments
Journal of geophysical research 108(C5) 3157
Wong L A, Chen J C and Dong L X 2004 A model of the
plume front of the Pearl River Estuary, China and
adjacent coastal waters in the winter dry season
Continental Shelf Research 24 1779-1795
Yan Q, Wu H and Zhu J R 2015 Numerical simulation on
the major river plumes in China seas Journal of east
china normal university (natural sciences) 4 87-96 (in
Chinese)
Yang Y and Meng Q, et al. 2010 Expansion of the Pearl
River diluted water in 2006 and its ecological response
Journal of tropical oceanography 29(6) 15-21 (in
Chinese)
Zeng L L and Wang Q, et al. 2015. Hydrographic field
investigations in the Northern South China Sea by
open cruises during 2004-2013 Bull 60(6) 607-615
Zhang W J, Zhu S X and Li X Q, et al. 2014 Numerical
Simulation and Dynamical Analysis for Low Salinity
Water Lens in the Expansion Area of the Changjiang
Diluted Wate China Ocean Eng. 28(6) 777-790
Zhaoyun Chen, Wenping Gong and Huayang Cai, et al.
2017 Dispersal of the Pearl River plume over
continental shelf in summer Estuarine, Coastal and
Shelf Science 197 252-262
Zhu J, Hu J Y and Zhang W Z, et al. 2009 Numerical
study on tides in the Taiwan strait and its adjacent
areas Marine science Bulletin 11(2) 23-32
IWEG 2018 - International Workshop on Environment and Geoscience
394
