
Characteristics Analysis of Multi-Directional Geo-Electric Field
Observation Data in FengNing Area
Rui Yan
1*
, Lanwei Wang
1
, Guiyun Song
2
and Shizhong Zhang
1
1
Institute of Crustal Dynamics, China Earthquake Administration, Beijing 100085
2
The Water Conservancy Bureau in the West Coast New Area of Qingdao, Qingdao 266400
Email: yanxiaoxiao_best@163.com
Keywords: Geo-electric field, multi-directional, long trend characteristics, periodic characteristics
Abstract: Based on the experimental data of multi-directional geo-electric field observation in FengNing station, the
time series trend, periodic characteristics and correlation of different direction data are carried out in this
paper. The results show that: 1. There are not obvious regular temporal characteristics in different
measurement directions. The temporal changes in different direction are anisotropy. 2. The value of
spontaneous electric field in different directions is different and has not obvious seasonal characteristics.
The value of telluric field is similar in different direction, which is higher in summer and lower in winter. 3.
Frequency-spectrum analysis suggests that the dominant period of telluric field is mainly 12 hours, 8hours,
24hours or 6hours. There is no obvious period of spontaneous electric field. 4. For spontaneous electric
field, the correlation between different directions is best, while there is a good correlation between two
opposite directions for telluric field. With the increasing of observational data number, the correlation will
be worse.
1 INTRODUCTION
In the process of earthquake preparation, the
changes of crustal media and seismogenic stress can
cause the electrical variations of the crustal, which
can change geo-electric field. So developing the
observation and research on geo-electric field and
exploring the geo-electric field variation
characteristics and mechanism in the process of
earthquake preparation are meaningful (Mao et al.,
1999).
In the past, the geo-electric field observations
were mainly used to find minerals and explore earth
structure. In these 40 years, it is applied to the study
on seismic precursor (Sun and Wang, 1984; Li et al.,
2014). Before 1980s, the single-pole direction
observation method was used in geo-electric field,
which measured potential difference between two
electrodes on a certain direction near the earth
surface. In 1981, Varotsos, Alexopoulous and
Nomicos put forward a method of seismic electrical
signals (SES) to predict earthquake and the multi-
pole distance observation of geo-electric field began
to be used (Varotsos and Alexopoulous, 1984a;
Varotsos and Alexopoulous, 1984b). Afterwards, the
geo-electric field which is used to forecast
earthquake evoked great repercussions in
international academia (Varotsos and Alexopoulous,
1984a; Varotsos and Alexopoulous, 1984b; Qian and
Zhao, 2005). Since 1990s, the digital geo-electric
field observation technology based on ZD9/ZD9A
instruments has been developed in China. At
present, there are more than 100 digital geo-electric
field observation stations all over China, which has
covered main structural belt, earthquake-prone area
and key monitoring area (Ma, 2008; Xi et al., 2016).
According to different field sources, the geo-
electric field can be divided into telluric field and
spontaneous electric field. The telluric field is a
varying field caused by various field sources outside
the earth; the spontaneous electric field is a stable
field formed by various physical and chemical
interactions underground. The geo-electric field
observed by ZD9A in fact has these two parts,
namely the telluric electric field and spontaneous
electric field (Qian and Lin, 1995). In most stations
of 100 stations in China, there are only two
(orthogonal) observation directions. This
observation method cannot reflect accurately the
characteristics of spontaneous electric field, such as
its locality and anisotropy.
In order to have a better exploration on the
characteristics of spontaneous electric field and
Yan, R., Wang, L., Song, G. and Zhang, S.
Characteristics Analysis of Multi-Directional Geo-Electric Field Observation Data in FengNing Area.
In Proceedings of the International Workshop on Environment and Geoscience (IWEG 2018), pages 421-427
ISBN: 978-989-758-342-1
Copyright © 2018 by SCITEPRESS – Science and Technology Publications, Lda. All rights reserved
421
telluric field, researchers started to try multi-
directional Geo-electrical field observation, that is,
the electrodes are laid out in multi-direction. The
gradient changes of spontaneous electric potential in
each direction (at least 8 directions) can be recorded
synchronously. The variation in each measuring
direction with time changing is gathered. The
preliminary characteristics such as diurnal and
frequency spectrum are also studied using the data
(Xi et al., 2013).
In this paper, the experiment data of geo-electric
field in multi-direction observed in FengNing station
is presented. The long time series trend, periodic
characteristics and correlation of different direction
data is studied, which help to further explore the
characteristics of the spontaneous electric field and
the telluric field observation data.
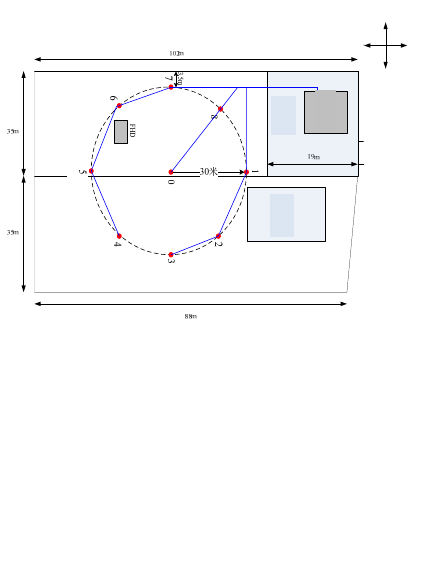
2 EXPERIMENTAL DATA
The multi-directional geo-electric field observation
tests were carried out from 2012 using the GEF-1
observation system consisting of GEF-1 instrument
and LGB-1 solid non-polarizable electrode. There
are 26 measurement channels. The geo-electric field
in multi-directional can be observed. The frequency
band is 0~0.005Hz. There are 9 observation points
including 8 observation directions and the central
standard observation point (Figure 1). In the eight
directions, three electrodes are buried in each
electrode pit; each electrode is connected with the
electrode 1 in electrode pit 0. Each direction has
three measurement values, and the three
measurement values can be inspected each other in
order to ensure the accurate electrode observation.
So there are measurement data from 24 channels.
There are also three electrodes in pit 0. The
electrode 1 is the main electrode, which is also
linked with the other two electrodes in pit 0. Both
potential differences between electrodes 1 and 2 and
between electrodes 1 and3 are measured so as to test
whether the central electrode1 in pit 0 works
normally or not.
The sampling rate is 60s. One data file is
obtained every day including 26 channels of data
records where the former 24 channels of data are
difference value between the three electrodes in each
pit and electrode 1 in central pit 0; The 25
th
and 26
th
channels of data are the potential difference between
electrodes 1 and 2 and between electrodes 1 and 3 in
central electrode pit (pit 0), respectively.
Figure 1: Electrode Layout of Multi-directional Electric
Field Instrument.
The data which is disturbed by all kinds of
factors is ruled out to the greatest extend. According
to the quality evaluation of electrode and data (Qian,
2010), the accurate data in FengNing station for two
consecutive years (2013-2014) are selected to
analyses while the observation data from May, 10,
2014 to August, 19, 2014 are ruled out due to
electrode problems.
3 DATA ANALYSIS
3.1 Long Trend Characteristics of
Time Series
At present, it is hard to distinguish the spontaneous
electric field from the telluric field. According to the
standard “The Method of Earthquake-related Geo-
electrical Monitoring and Geo-electric Field
Observation” and the tests to the various parameters,
the method of ‘five days’ moving average is selected
to get the spontaneous electric field data (Qian and
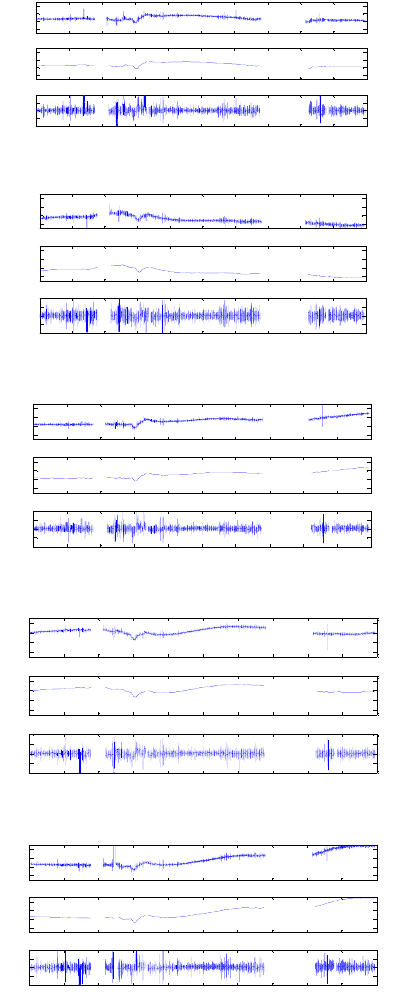
Lin, 1995). Figure 2 shows the time series of
original observation data in two consecutive years,
the five days’ moving average (spontaneous
potential) and the telluric field observation data from
the eight directions in the multi-directional geo-
electrical field.
The data in directions of north and south, east
and west, northeast and southwest, northwest and
southeast of the original observation are all in the
opposite directions. Their diurnal variations show
the typical opposite trends, while the opposite trends
are not found in their long time series. The possible
reason may be that, in addition to the diurnal
variations, many other elements have influenced the
long time series. So, the general trend of long time
N
Observation
House
Cement
platform
vegetable
plot
IWEG 2018 - International Workshop on Environment and Geoscience
422
would not be completely opposite and it is not like
the diurnal variation curve, which has the simple
elements and shows the opposite trend.
For the original observation data, the time series
of the different observation directions show the
different trends, but a similar fluctuation can be seen
at the same time in each direction. There are many
glitches in the observation data from the direction of
north, south, southwest, southeast and northwest,
which means that exist high frequency interference;
while there are less glitches in the observation data
from the direction of northwest, east-west and west,
which means they have less high frequency
interference. We think that the reason of these
situations is related to the electrode embedment and
the environment, such as some contamination to
electrodes.
From the time series, the ‘five days’ moving
average value, which is on behalf of the spontaneous
electric field, show the same evolutionary trend with
the original observation data. Due to the different
position of electrode embedment, the spontaneous
potential is different in each direction.
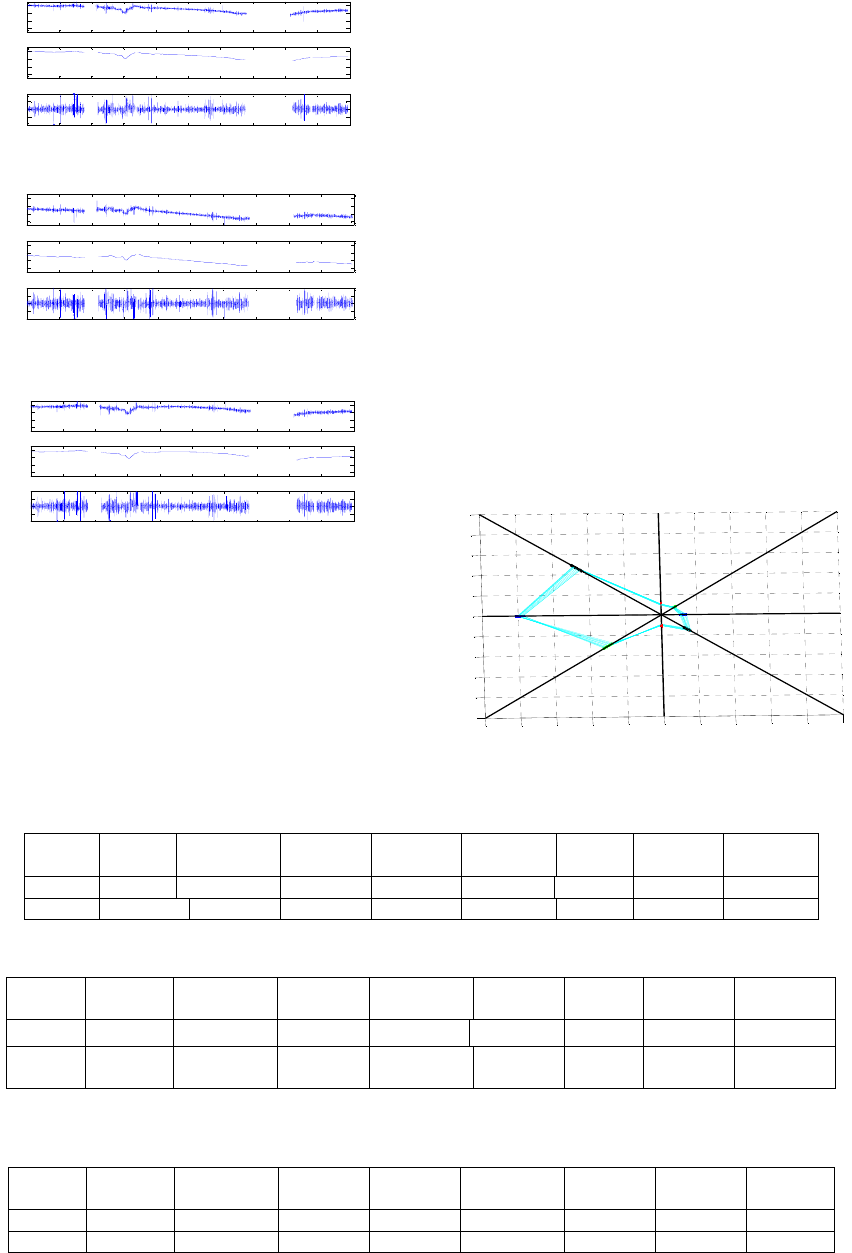
There are no obvious seasonal characteristics in
original data and the spontaneous electric field. The
values vary greatly in different directions. Figure 3
shows an azimuthal map of data gathered in the
eight directions during two consecutive months,
evidencing the anisotropy of the field. This is
consistent with Mota et al.’s results (Mota et al.,
2004), in which the authors used the same approach
but with vertical electrical sounding to detect
electrical anisotropy in 8 directions over a fractured
rock mass.
As for the calculated telluric electricity field, the
data in each direction are stable. The diurnal
variation has higher values in the middle of the year
while has the lower values in the beginning and in
the end of the year (Cui, 2013).
3.2 Periodic Characteristics
The periodic characteristics and amplitudes of the
original data, the calculated telluric field and
spontaneous electric field for two consecutive years
were presented on Tables 1 to 3.
The telluric field in the eight directions display
mostly a 12-hour period, followed by 8 hours period
and 24 hour period (Table 1), which is consistent
with previous studies (Du et al., 2006). The
spectrum values of dominant periods in different
direction are different. The telluric field data in the
south, southwest and southeast directions have larger
values which are influenced by the high frequency
elements, while the values of other directions are
relatively close.
(a) North (Pit. 1)
(b) South (Pit. 5)
(c) Northeast (Pit. 2)
(d) Southwest (Pit. 6)
(e) East (Pit. 3)
20130101 20130313 20130524 20130804 20131015 20131226 20140308 20140519 20140730 20141010 20141231
-2
0
2
4
mV
20130101 20130313 20130524 20130804 20131015 20131226 20140308 20140519 20140730 20141010 20141231
-2
0
2
4
mV
20130101 20130313 20130524 20130804 20131015 20131226 20140308 20140519 20140730 20141010 20141231
-40
-20
0
20
40
mV/k m
Tim
e
20130101 20130313 20130524 20130804 20131015 20131226 20140308 20140519 20140730 20141010 20141231
-2
0
2
4
mV
20130101 20130313 20130524 20130804 20131015 20131226 20140308 20140519 20140730 20141010 20141231
-2
0
2
4
mV
20130101 20130313 20130524 20130804 20131015 20131226 20140308 20140519 20140730 20141010 20141231
-40
-20
0
20
40
mV/k m
Time
20130101 20130313 20130524 20130804 20131015 20131226 20140308 20140519 20140730 20141010 20141231
-2
0
2
4
mV
20130101 20130313 20130524 20130804 20131015 20131226 20140308 20140519 20140730 20141010 20141231
-2
0
2
4
mV
20130101 20130313 20130524 20130804 20131015 20131226 20140308 20140519 20140730 20141010 20141231
-40
-20
0
20
40
m
V/km
Time
20130101 20130313 20130524 20130804 20131015 20131226 20140308 20140519 20140730 20141010 20141231
-2
0
2
4
mV
20130101 20130313 20130524 20130804 20131015 20131226 20140308 20140519 20140730 20141010 20141231
-2
0
2
4
mV
20130101 20130313 20130524 20130804 20131015 20131226 20140308 20140519 20140730 20141010 20141231
-40
-20
0
20
40
mV/k m
Time
20130101 20130313 20130524 20130804 20131015 20131226 20140308 20140519 20140730 20141010 20141231
-2
0
2
4
mV
20130101 20130313 20130524 20130804 20131015 20131226 20140308 20140519 20140730 20141010 20141231
-2
0
2
4
mV
20130101 20130313 20130524 20130804 20131015 20131226 20140308 20140519 20140730 20141010 20141231
-40
-20
0
20
40
mV/k m
Time
Characteristics Analysis of Multi-Directional Geo-Electric Field Observation Data in FengNing Area
423
(f) West (Pit. 7)
(g) Southeast (Pit. 4)
(h) Northwest (Pit. 8)
Figure 2: Results of the Spontaneous Electric Field and
Telluric Field from the Eight Directions. (From the top to
the bottom respectively are the original observation data,
spontaneous potential and the telluric field).
The dominant periods of the original observation
data are mainly 8 hours, followed by 12 hours, 24-
hour and 6-hour period (Table 2). In addition, there
are longer periods for the special directions such as
30 days and 19 days, which may be related to
fluctuation of observation data or their long period
elements. The observation directions with the long-
period observation data have the larger amplitude of
the dominant frequency.
In Table 3, the periods of calculated spontaneous
electric field are mainly 580 days and 290 days,
which are the close to one-year or two-year long
period. However, the data are wrong during May,
2013 and May to August, 2014 due to the abnormal
equipment. After eliminating the abnormal data, the
number of the data which has been calculated is 580.
Obviously, the calculated period of spontaneous
electric field in Table 3 is related to the number of
the data which has been calculated. The periodic
result only is caused by the number of data
calculated, not the real period. Therefore, it
shouldn’t be a correct period conclusion. From
Figure 2, we can see that there is no obvious regular
tendency in long time series. So, for the time series
which have no tendency, it is no sense to calculate
its period by FFT.
Figure 3: Spontaneous electric field data directions in
FengNing station topological graph.
Table1. Observation data period and the dominant frequency amplitude of the telluric field.
Period
(
h
)
N
Pit 1
S
Pit 5
NE
Pit 2
SW
Pit 6
E
Pit 3
W
Pit 7
SE
Pit 4
NW
Pit 8
1 8/0.80 12/1.51 12/0.96 12/1.04 12/0.79 12/0.64 24/1.17 8/0.73
2 12/0.77 24/1.19 8/0.77 8/0.9 12/0.73 8/0.61 12/1.04 12/0.72
Table2: Periodic characteristics of the original observation data and the dominant frequency amplitude.
Period
(
h
)
N
Pit 1
S
Pit 5
NE
Pit 2
SW
Pit 6
E
Pit 3
W
Pit 7
SE
Pit 4
NW Pit 8
1
8/0.022 59d/0.033 8/0.021 8/0.020 30d/0.025 8/0.015 8/0.019 30d/0.031
2
6/0.014 8/0.030 24/0.017 12/0.013 8/0.015
12/0.01
2
19d/0.01
4
8/0.021
Table3: Periodic characteristics of original observation data in spontaneous potential and the dominant frequency
amplitude.
Period
(
h
)
N
Pit 1
S
Pit 5
NE
Pit 2
SW
Pit 6
E
Pit 3
W
Pit 7
SE
Pit 4
NW
Pit 8
1 580/0.54 580/0.92 580/0.78 290/0.69 570/1.87 580/0.72 580/1.02 290/0.62
2 290/0.29 290/0.43 290/0.40 580/0.33 285/0.72 290/0.45 116/0.22 580/0.55
20130101 20130313 20130524 20130804 20131015 20131226 20140308 20140519 20140730 20141010 20141231
-2
0
2
4
mV
20130101 20130313 20130524 20130804 20131015 20131226 20140308 20140519 20140730 20141010 20141231
-2
0
2
4
mV
20130101 20130313 20130524 20130804 20131015 20131226 20140308 20140519 20140730 20141010 20141231
-40
-20
0
20
40
mV/k m
Time
20130101 20130313 20130524 20130804 20131015 20131226 20140308 20140519 20140730 20141010 20141231
-2
0
2
4
mV
20130101 20130313 20130524 20130804 20131015 20131226 20140308 20140519 20140730 20141010 20141231
-2
0
2
4
mV
20130101 20130313 20130524 20130804 20131015 20131226 20140308 20140519 20140730 20141010 20141231
-40
-20
0
20
40
mV/k m
Time
-5
-4
-3
-2
-1
0
1
2
3 4
5
-5
-4
-3
-2
-1
0
1
2
3
4
5
E
S
Z
N
W
IWEG 2018 - International Workshop on Environment and Geoscience
424

3.3 Correlation between Different
Directions
The stable observation data are selected to calculate
the telluric field and the spontaneous electric field.
And the correlation between the different directions
is analyzed, as shown in Table 4 to 6.
From Tables 4 to 6, the spontaneous electric field
has the best correlation between each direction.
Because, as it was already mentioned, the
spontaneous electric field is a stable field formed on
the earth surface by underground physical and
chemical processes, which commonly has
limitations (Qian and Lin, 1995). Therefore after
removing most of the telluric field
with periodic changes from original data, the
spontaneous electric field accounts a large part,
which is more influenced by the regional
environment. This is the reason of best correlation
between data in short time.
From Table 5, we can see that each two opposite
directions of the 8 measurement directions, namely
directions 1 (north) and 5 (south), directions 2 (north
east) and 6 (south east), directions 3 (east) and 7
(west), and directions 4 (south east) and 8
(northwest), have the best correlation separately.
This shows that the telluric field in the same
direction is more consistent, the trend is closer.
With the increasing of data, the correlation of
each pair of directions become weak, that shows that
the long time series observational data of geo-
electric field will be mixed with more and more
other components. So, the correlation will be weak
and the changes are anisotropy. This may also be
one of the reasons why we cannot get the
characteristics of long-time series of geo-electric
field observational data.
Table 4. Correlation of spontaneous electric field data between different directions.
1 2 3 4 5 6 7 8
1 1.0000 0.1602 -0.0045 -0.0393 -0.5052 -0.5411 0.7210 0.5676
2 0.1602 1 0.9578 0.8823 -0.8032 -0.7828 0.6133 0.7997
3 -0.0045 0.9578 1.0000 0.9588 -0.8069 -0.7855 0.5815 - 0.7190
4 -0.0393 0.8823 0.9588 1.0000 -0.8098 -0.7899 0.6289 0.5797
5 -0.5052 -0.8032 -0.8069 -0.8098 1.0000 0.9959 -0.9179 -0.8043
6 -0.5411 -0.7828 -0.7855 -0.7899 0.9959 1.0000 -0.9376 -0.8123
7 0.7210 0.6133 0.5815 0.6289 -0.9179 -0.9376 1.0000 0.7451
8 0.5676 0.7997 0.7190 0.5797 -0.8043 -0.8123 0.7451 1.0000
Table 5: Correlation of the telluric field data between different directions.
1 2 3 4 5 6 7 8
1 1.0000 0.4063 -0.4722 -0.8424 -0.9211 -0.5990 0.5144 0.7592
2 0.4063 1.0000 0.5317 0.0528 -0.4513 -0.8229 -0.4281 -0.0965
3 -0.4722 0.5317 1.0000 0.8327 0.3750 -0.2796 -0.8978 -0.7906
4 -0.8424 0.0528 0.8327 1.0000 0.7724 0.2187 -0.7992 -0.909
5 -0.9211 -0.4513 0.3750 0.7724 1.0000 0.7255 -0.4343 -0.7169
6 -0.5990 -0.8229 -0.2796 0.2187 0.7255 1.0000 0.2509 -0.1179
7 0.5144 -0.4281 -0.8978 -0.7992 -0.4343 0.2509 1.0000 0.8867
8 0.7592 -0.0965 -0.7906 -0.9097 -0.7169 -0.1179 0.8867 1.0000
Table 6: Correlation of the original observation data between different directions.
1 2 3 4 5 6 7 8
1 1.0000 0.4585 -0.4849 -0.8020 -0.7934 -0.5566 0.6116 0.7532
2 0.4585 1 0.4552 -0.0017 -0.5221 -0.7174 -0.1281 0.1045
3 -0.4849 0.4552 1.0000 0.8608 -0.1268 -0.3030 -0.6018 -0.5833
4 -0.8020 -0.0017 0.8608 1.0000 0.4494 0.0547 -0.6069 -0.7620
5 -0.7934 -0.5221 0.1268 0.4494 1.0000 0.8709 -0.6783 -0.7322
6 -0.5566 -0.7174 -0.3030 0.0547 0.8709 1.0000 -0.3170 -0.3673
7 0.6116 -0.1281 -0.6018 -0.6069 -0.6783 -0.3170 1.0000 0.8714
8 0.7532 0.1045 -0.5833 -0.7620 -0.7322 -0.3673 0.8714 1.0000
Characteristics Analysis of Multi-Directional Geo-Electric Field Observation Data in FengNing Area
425
4 CONCLUSIONS AND
DISCUSSION
The obvious regular long trends in all eight
directions are not found in original data, calculated
spontaneous electric field and calculated telluric
field observed in FengNing station (Figure2). After
quality inspection, all observation data can be
classified as normal. They are the objective reflex of
geo-electric field in FengNing area, and the time
series long trend show anisotropy, which is
consistent with results obtained by Mota et al. (Mota
et al., 2004). About the geo-electric field
characteristics during calm period, Mogi et al. (Mogi
et al., 2000) have also studied the short-term and the
long-time variation of electric field. Short-term
electric field variations were found to correspond
mainly to geomagnetic activity, while long-term
variation was mostly gradual shift and was clearly
uncorrelated to precipitation and to ground water
level variations (Mogi et al., 2000).
From Figure 2 and 3, the amplitude of original
data and spontaneous electric field in 8 directions is
different. The telluric field in the middle of year is
high and is low in the beginning and by the end of
the year. The observation values in different
directions are nearly the same. These results are
consistent with the present research results (Qian
and Lin, 1995; Xi et al., 2013). In addition, Zhang et
al. (Zhang et al., 2012) think that the differences in
electric field variation amplitude and shapes
between different stations and among ground
observing data reflect the different response process
at stations with different underground
electromagnetic structures and the response
mechanism to current system in lithosphere. The
direction of anomalies may be affected and
controlled by regional stress state and the strikes of
fault belts (Zhang et al., 2012). Li et al. (Li et al.,
2014) researched the abnormal variations of geo-
electric field observed at three stations in the
Shanghai area and found that data in even very close
three stations can vary greatly. They pointed that the
huge differences of curve shape, amplitude and
phase are caused by different electrical properties
under the stations (Li et al., 2014). The different
laying way of the electrode, and the different
distance between the electrodes are other reasons,
which is also mentioned by Mogi et al. (Mogi et al.,
2000). So, the amplitude and shape of data in
different stations may be different due to the local
Earth’s surface, the underground layer conductivity,
and also the electrode. It is also why there is or is not
annual variation in long time series of geo-electric
field.
The regular diurnal variations of telluric field can
be recorded using the multi-direction observation.
The dominant period of the original data and
telluric field is mainly 12, 24, 8 or 6 hours, which is
in accordance with the results of the previous
researches (Ye, 2006). Ye (Ye, 2006) studied the
spectrum characteristics of geo-electric diurnal
variation based on data from stations in China,
which showed that in geo-electric diurnal variation,
the amplitude of the 12 h semidiurnal wave is the
largest, followed in turn by the 24~25h diurnal wave
and the 8 h periodic wave (Ye, 2006). In general, the
diurnal variation and its frequency represent the
telluric electric field part in the data, which is
homogenous with the ionospheric electric field and
is correlated with the daily geomagnetic fluctuation
(Qian and Lin, 1995 ; Mogi et al., 2000; Ye, 2006).
However, the spontaneous electric field is in a slow
evolutionary process, there is no obvious period
found from two years data so far.
The spontaneous electric field is a stable electric
field formed on the Earth’s surface by the
underground medium under the effect of physical
and chemical processes, so the correlation is better
between different directions. For the telluric field,
there is a good correlation between two opposite
directions. With the increasing of observational data
amount, the correlation will be worse, showing that
the long time series of all directions are gradually
anisotropic.
The geo-electric field characteristics of
experimental data in multi directions in FengNing
station was presented in this paper. The results of
calculated spontaneous electric field and the telluric
field in FengNing station are basically consistent
with the ones in theory. However, there are still
some phenomena that are not very consistent with
the theoretical basis, such as the telluric field that
didn’t display obvious seasonal variation, except on
the amplitude, which has high value in summer and
low value in winter. In fact, the telluric field is
caused by Sq current system. The long-term
seasonal and solar cycle variability and significant
day-to-day variability in the Sq current system are
found as early as 1960 (Hasegawa, 1960). The main
reason may be that there are a variety of other
components in the actual observation data, besides
the spontaneous electric field and the telluric field,
even undetected interference components in data
quality assessment. Therefore, sometimes the
objective processing result of the observation data
cannot fully reflect the real characteristics of the
IWEG 2018 - International Workshop on Environment and Geoscience
426
spontaneous electric field and the telluric field.
Further research is necessary in the following
aspects: continue to accumulate reliable data, select
further better quality data and eliminate more
interference comprehensively. More statistical
analysis and phenomenon accumulation are
necessary and meaningful.
REFERENCES
Cui T F 2013 The diurnal variation of geo-electric field
along the longitude and latitude chains in China
mainland and its physical interpretation[Master’s
thesis] (in Chinese) Lanzhou: Thesis for Master’s
Degree of Lanzhou Institute of Seismology.
Du X B, Xi J L and Tan D C 2006 Specification for the
construction of seismic station Geoelectrical station
part 2:Geoelectrical field observatory The Seismology
Trades Standard of the PRC(in Chinese) 2-51
Hasegawa M 1960 On the position of the focus of the
geomagnetic Sq current system J. Geophys. Res. 65(5)
1437-1447
Li W, Ma Q Z and Wang G M 2014 Abnormal signal
recognition by multi-dipole observation of geoelectric
field Earthquake reseach in China 30(1) 91-101
Li W, Ma Q Z and Wang G Y 2014 Abnormal signal
recognition by multi-dipole observation of geoelectric
field Earthquake research in China 30(1) 91-101
Ma Q Z 2008 Multi-dipole observation system and study
on the abnormal variation of the geoelectric field
observed at Capital Network before the 2006 Wen an,
Hebei of China, Ms5.1 earthquake Acta Seismologica
Sinica (in Chinese) 30(6) 615-625
Mao T E, Xi J L and Wang Y Q 1999 The variation
characteristics of the telluric field in the process of
earthquake Chinese J.Geophys (in Chinese) 42(4) 520-
52
Mogi T, Tanaka Y, Widarto D S, Arsadi E M, Puspito N
T, Nagao T, Kanda W, Uyeda S 2000 Geoelectric
potential difference monitoring in southern Sumatra,
Indonesia-Co-seismic change Earth Planets Space 52
245-252
Mota R, Monteiro Santos F A, Mateus A, Marques F O,
Goncalves M A, Figueiras J and Amaral H 2004
Granite fracturing and incipient pollution beneath a
recent Landfill facility as detected by geoelectrical
surveys Journal of applied geophysics 57 11-22
Qian F Y and Zhao Y L 2005 Study on geoelectric field
method for short-term and impending earthquake
prediction Earthquake (in Chinese) 25(2) 33-40
Qian J D and Lin Y F 1995 Seismic electromagnetic
observation techniques (in Chinese) Beijing:
Seismological Press
Sun Z J and Wang H J 1984 Geoelectric conspectus (in
Chinese) Beijing: Earthquake Press
Qian J D 2010 The department of earthquake monitoring
and prediction. Seismic electromagnetic theory and
observation technology(trial edition) (in Chinese).
Beijing: Seismological Press
Varotsos P and Alexopoulous K 1984a Physical properties
of the variations of the electric field of the earth
preceding earthquakes I.Tectonophysics 110 73-98
Varotsos P and Alexopoulous K 1984b Physical
properties of the electric field of the earth preceding
earthquakesII, Determination of epicenter and
magnitude Tectonophysics 110 99 -125
Xi J L, Song Y R, Hu M Z, Liu C, Xu X G and Shang X Q
2013 Research on the observation methods and
techniques of omni-directional spontaneous electric
field Acta Seismologica Sinica 1 94-107
Xi J L, Zhao J L, Liu C, Zhuang N, Guan X Y and Ma A
M 2016 Research and application of the new type
networked geo-electric field observation technology
Progress in Geophysics 6 2690-2699
Ye Q 2006 Research on the basic features of the
geoelectric field variation and the physical explanation
[Master’s thesis](in Chinese) Lanzhou: Lanzhou
Institute of Seismology, China Earthquake
Administration
Zhang X M, Chen H R, Liu J, Shen X H, Miao Y Q, Du X
B and Qian J D 2012 Ground-based and satellite DC-
ULF electric field anomalies around Wenchuan M8.0
earthquake Advances in Space Research 50 85-95
Characteristics Analysis of Multi-Directional Geo-Electric Field Observation Data in FengNing Area
427
