
Analysis Method of Surface Changes Due to Open-Pit Mining
Activities: A Case Study of Pingshuo East Open-Pit Mine in China
Wenbo Zhu
1,2*
, Jin Zhang
1,
, Jingtao Li
3
and Yanhui Ma
3
1
College of Mining Engineering of Taiyuan University of Technology, No.79, West Yingze Street, Taiyuan, 030024, China;
2
College of Resources and Environment of Shanxi Agricultural University, Taigu, 030801, China;
3
Department of Coal Quality and Geologic Survey, China Coal Pingshuo Group co., Ltd, Pingshuo Living Quarters,
036006 Shuozhou, P. R. China.
Email:tyzhuwenbo@163.com.
Keywords:
Surface changes, open-pit mining activity, dynamic analysis, multi-sequential DEMs
Abstract: The open-pit mining activity has caused the surface to be in an unstable state of change, causing problems
such as slope instability, geological hazard, and damage to the ecological environment. The analysis of
open-pit mine surface changes is of positive significance to the sustainable development of the mining area
and the improvement of the ecological environment. Based on the spatial-temporal process, the open-pit
surface changes area can be divided into three dynamic surface units due to the open-pit mining activities,
that is, the progressing mining area, the continuing mining area and the discontinued mining area. Taking
the East open-pit mine of Pingshuo Mining Area in China as an example, this paper uses the multi-
sequential Digital Elevation Models (DEMS) for calculation to extract the dynamic surface units. The
geometric changes and vertical changes of the open-pit surface were analyzed and evaluated quantitatively.
The analysis method of surface changes due to open-pit mining activities quantitatively in the GIS
environment, is of practical value for the investigation and evaluation of artificial surface changes in open-
pit mines.
1 INTRODUCTION
Human activities are leaving a significant signature
on the Earth via altering its morphology, evolution,
and ecosystem (Foley et al., 2005; Ellis, 2011;
Brown et al., 2013; Tarolli, 2014). Open-pit mines
cause important and anthropogenic topographic
signatureson the Earth (Tarolli and Sofia, 2016;
Chen et al., 2015). Open pit mining is a typical
anthropogenic activity for stripping and cutting the
earth's surface. This activity can cause drastic
geomorphic changes of the mine’s landscape,
affecting the surface evolution of the Earth (Tarolli
and Sofia, 2016). During the mining process, the
earth's surface is in an unstable state over a long
period, this leads to the damage and/or deterioration
of natural environment, as a result of forming a
terrain environment with negative depths and steep
slopes on a large-scale and causing a series of
geological hazards, soil erosion and land
reclamation etc.
Currently, the methods used for land cover
changes of open-pit mine are high-resolution remote
sensing technologies, including UAV, TLS, LIDAR
and so on. The high-resolution topographic data
combined with the image data were used to extract
the data variation of surface information such as soil
erosion, land cover and geological hazard in open-
pit mines, investigating and analyzing characteristic
changes and dynamic monitoring of natural
environments caused by mining activities. Neugirg
(Neugirg et al., 2015) analyzed the soil erosion
patterns on the steep slopes and Haas (Haas et al.,
2016) quantified and analyzed the geomorphic
processes using the long-term data of LIDAR and
UAV photogrammetry in five and a half years of
Italian open-pit iron mine; Martín-Duque (Martín et
al., 2010) discussed the reclamation problems of
open-pit mining during 13-year monitoring using
TLS technology; Tong (Tong et al., 2015)
researched the three-dimensional modeling and
monitoring method through the UAV and TLS for
classifying the land covers in the open-pit mine;
Yucel (Yucel and Turan, 2016) created 3D terrain
models to quantify areal changes linked to
anthropogenic and meteorological effects over the
Zhu, W., Zhang, J., Li, J. and Ma, Y.
Analysis Method of Surface Changes Due to Open-Pit Mining Activities - A Case Study of Pingshuo East Open-Pit Mine in China.
In Proceedings of the International Workshop on Environment and Geoscience (IWEG 2018), pages 449-457
ISBN: 978-989-758-342-1
Copyright © 2018 by SCITEPRESS – Science and Technology Publications, Lda. All rights reserved
449
study period of open-pit mine lakes using UAV
photogrammetry.
The technique for Geomorphic Change
Detection (GCD), which is based on gridded
models, can be applied by ground-based topographic
survey data to measure the process-based changing
information to geomorphologists (James et al., 2012;
Carley et al., 2012; Schaffrath et al., 2015; Hu and
Wu, 2016). The use of multi-sequential
DEM(Digital Elevation Model) calculations to
extract areas of change is an effective method for
surface change monitoring. James (James et al.,
2012) considered that differentiating two or more
sequential DEMs is a rudimentary form of spatially
distributed and dynamic geomorphological analysis;
the time-discrete DEMs in the static mode can also
be used to identify the location of geomorphic
stability/instability, past trends, processes, and
change rate; Carley (Carley et al., 2012) used the
subtraction of DEMs between different points in
time as a method to determine temporal scour
patterns and fill of the channel change detection
between contour maps and point cloud models;
Schaffrath (Schaffrath et al., 2015) estimated
geomorphic change of an extreme flood on a
landscape scale in 2010; Hu (Hu and Wu, 2016)
researched the method for extracting ground
deformation and analyzed the link between regional
ground deformation and local deformation for the
West Open-Pit Mine in Fushun, Liaoning province,
China.
In this paper, an analysis method that is using
dynamic topographic data was proposed to evaluate
open-pit mining surface changes. By analyzing the
spatio-temporal relationship of the open-pit mining
activities, three dynamic surface units were defined
in the mining process, and the calculation models
between elevation deformation information and
dynamic surface units were established to simulate
the spatial evolution of surface mining. A case study
was focused on investigating the dynamic changes
of the ground surface information of Pingshuo East
open-pit mine, which is located in the loess plateau
region, China, using the DEM date collected five
periods (6 months for one period) from Jan 2015 to
Jan 2017. The vertical deformation information and
mining area were extracted through differential
calculating the DEM data obtained in the different
periods, and dynamic surface units in each time
period are obtained by using spatial sets operations;
dynamic simulation of the mining process and
visualization change of the surface space were
carried out chronologically; and surface damage
intensity of the dynamic region were evaluated using
the geometric and vertical variation parameters.
2 MATERIALS AND METHODS
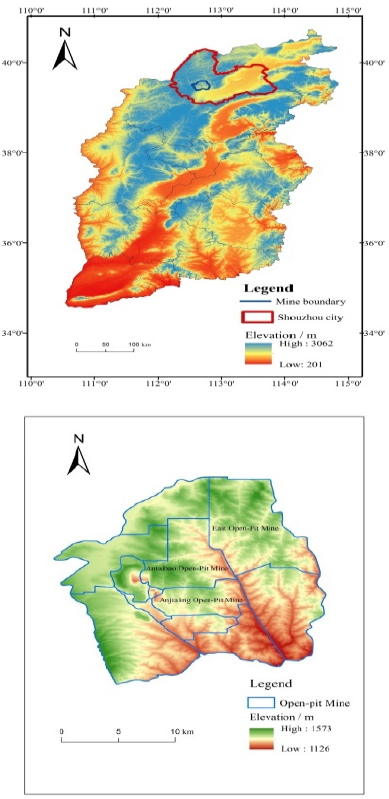
2.1 Study Area
(a) Location of Pingshuo mine
(b) Open-pit mine in Pingshuo mine
Figure 1: Location of the study area.
East Open-Pit Mine (39°23′-39°37′N,112°
10′-113°30′E) is located in Shuozhou City,
Shanxi Province, China, and one of three open-pit
mines (Anjialing open-pit mine, Antaibao open-pit
mine and East open-pit mine in PingShuo coal
mine(as shown in Figure 1). The Pingshuo coal mine
covers an area of 176.3 km
2
with a geological reserve
IWEG 2018 - International Workshop on Environment and Geoscience
450
of 5 billion tons, having 3 layers of coal seam with
an average thickness of 26 meters. This mine is
located in the Loess Plateau and a region of bare
hills, and its soil and ecosystem are easy to be
eroded and damaged, having an altitude between
1200m and 1600m and elevation difference within
500m. This area has a typical arid and semi-arid
continental monsoon climate and its average annual
temperature is in the range of 4.8 -7.8°C and annual
precipitation is about 428.2-449.0 mm. The mining
direction is heading towards west direction. The
west side of the slope is a stripping working slope
and a coal mining working slope, while the south
and north sides are end slopes; the east side is an
internal dump.
2.2 Data Sources
The research area of the East open-pit mine is
5.01km
2
. The collecting time period for the
measured data (as listed in Table 1) is every 6
months from January 2015 to January 2017 (as
shown in Table 1). The surveying data included the
elevation data of discrete points on the ground, the
bench crest line, and the bench toe line. Based on
these discrete points data during five periods, five
DEM data, with a spatial resolution of 2m, are
generated from the discrete-points data over the five
time periods by taking bench crest and bench toe as
topographically characteristic lines using the
constraint TIN method (Zhu and Zhang, 2017),
which are denoted as E
1
, E
2
, E
3
, E
4
and E
5
,
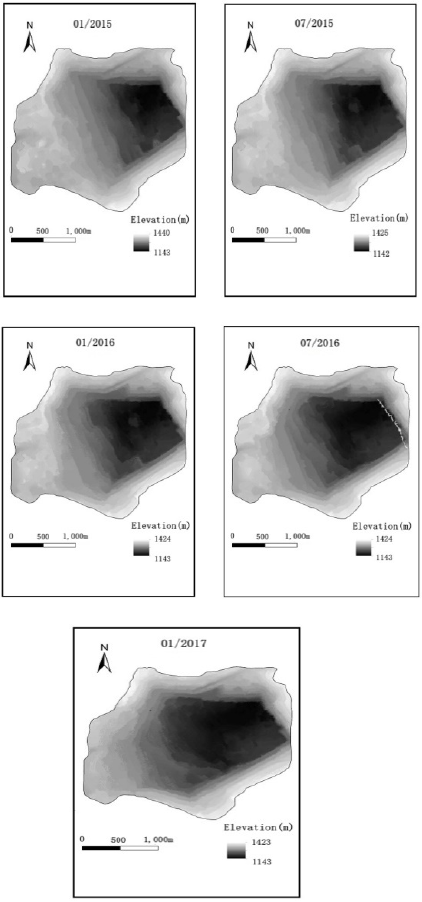
respectively, as shown in Figure 2. The terrain
information of those five time periods is
summarized in Table 1.
2.3 Analysis of the Open-Pit Mining
Activity
The mining activities on the rock strata directly
cause the damage of the earth’s surface. The earth’s
surface is stripped and mined by the mining
activities. Stripping activity is that the soil and rock,
which cover the top and surrounding of ore body,
are peeled off to make the ore easy to be dug. After
stripping, the mining activity is followed to excavate
the loose ore rock on the bench and put it into the
transportation equipment. In this paper, the mining
activity can be subdivided into four stages according
to the temporal-spatial mining sequence (Figure 3):
unexploited stage, progressive mining stage,
continuous mining stage and ending stage. The latter
three stages are the surface change process.
(a) E
1
(b) E
2
(c) E
3
(d) E
4
(e) E
5
Figure 2: Five Period DEM data set of East Open-pit
Mine. (a) DEM in January 2015; (b) DEM in July 2015;
(c) DEM in January 2016; (d) DEM in July 2016;(e) DEM
in January 2017.
Analysis Method of Surface Changes Due to Open-Pit Mining Activities - A Case Study of Pingshuo East Open-Pit Mine in China
451
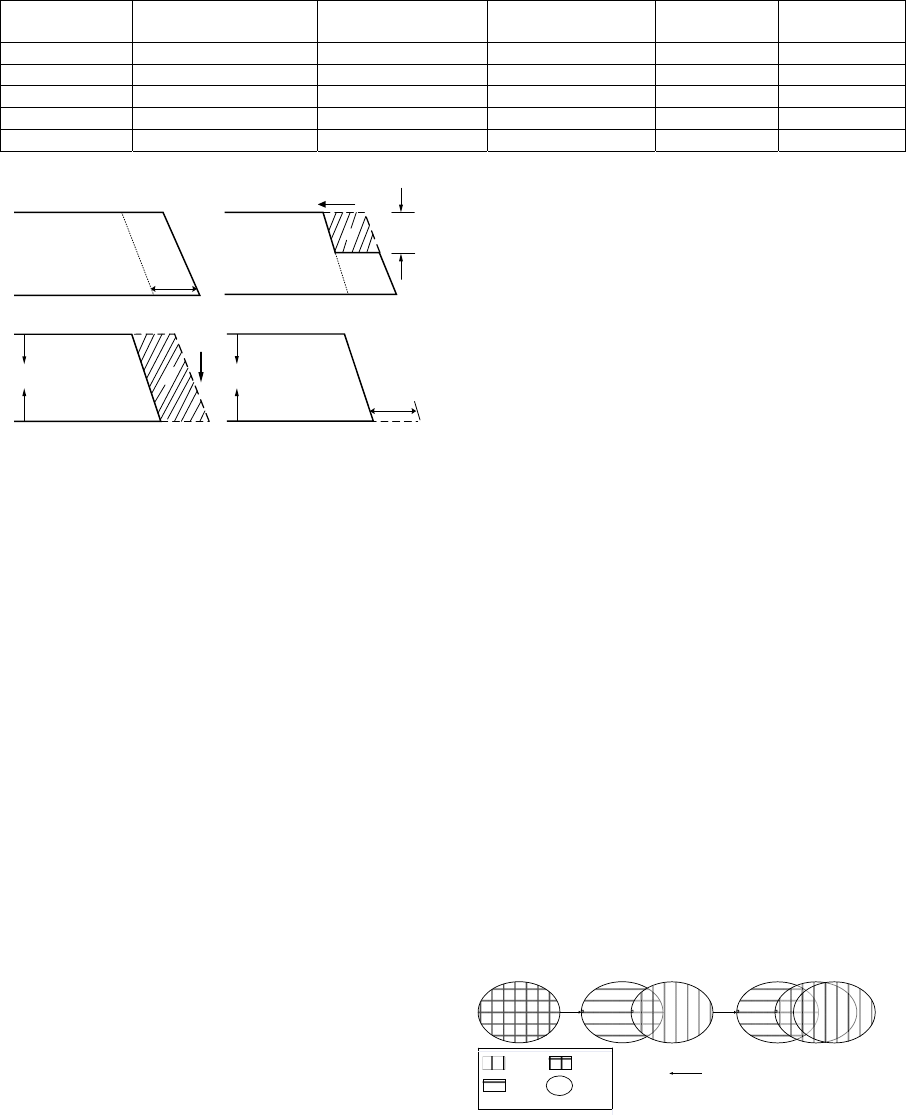
Table 1: The terrain information of five period DEM.
Serial number Elevation (m) Average
elevation(m)
Standard deviation
of elevation
Slope(°) Average slope
(°)
E
1
1143-1440 1292 85.75 0-86.56 17.93
E
2
1142-1425 1284 80.83 0-86.48 16.16
E
3
1143-1424 1284 81.12 0-86.77 17.58
E
4
1143-1424 1283.5 81.7 0-88.97 16.2
E
5
1143-1423 1283.5 85.75 0-86 18.31
(a)
(b)
(c)
ΔH
ΔH
Δ
s
Δ
s
L
Progressing direction
Vertical
direction
(d)
ΔH
L
Figure 3: Four stages of the open pit mining activity. (a)
Unexploitation stage; (b) Progressing mining stage
(Shaded areas for the mining area); (c) Continuous mining
stage; (d) Ending stage.
Unexploited stage (Figure 3-a). This stage refers
to the mining activities are not carried out yet.
Progressing mining stage (Figure 3-b). In this
stage, the topsoil is removed and the ore body
isstripped , being divided in each mining section.
The stripping area is extended to the direction of
excavation after the rock and soil are stripped. The
progressing direction is westward, “ΔS” indicates
the progressing stripping area,” ΔH” indicates the
progressing stripping depth. During this stage, the
surface is changed in both horizontal and vertical
directions.
Continuous mining stage (Figure 3-c). This is the
deep cutting process, based on the stripping
workspace, in the vertical direction, terminating
when the working surface is completely exploited.
As a result, a large amount of ore is excavated from
the coal seam and the surface is significantly
destroyed. The stripping slope is vertically cut, until
the elevation changes to a maximum value. During
this stage, the horizontal area of the surface keeps
unchanged, but the vertical area is obviously
changed.
Ending stage (Figure 3-d). No further mining
activities will take place in this area after the mining
process.
2.4 Dynamic Surface Units
Based on the analysis of the mining activity, the
surface can be divided into three dynamic units:
progressing mining area, continuing mining area,
and discontinued mining area, respectively. The
progressing mining area includes both horizontal
and vertical changes in the area, which correspond
to the progressing mining stage; the continuing
mining area is only along the vertical direction,
which corresponds to the continuous mining stage;
the discontinued mining area corresponds to the
ending stage, which has not any changes along the
horizontal and vertical directions.
For an example (Figure 4): The mining direction
is westward. The progressing mining area, the
continuing mining area and the discontinued mining
area is showed along the mining direction.
S
1
, S
2
, S
3
represent the mining areas of the T
1
, T
2
,
and T
3
periods, respectively.
From the T
1
period to the T
2
period, the mining
area changed from the S
1
to the S
2
. In the range of S
1
,
the dynamic units of the discontinued mining area
and the continuing mining area are formed; within
the range of S
2
, the dynamic units of the progressing
mining area and the continuing mining area are
formed. The continuing mining area is the
intersection of S
1
and S
2
.
Similarly, from the T
2
period to the T
3
period,
the mining area can also be divided into three
surface dynamic units.
Therefore, the surface change process is the
alternating process of dynamic units due to the
mining activities.
S
1
S
2
S
1
S
3
S
2
S
1
Discontinued
Mining Area
Continuing
Mining Area
Mining Area
Boundary
Legend
Mining Direction
Progressing
Mining Area
Figure 4: Dynamic surface units.
IWEG 2018 - International Workshop on Environment and Geoscience
452
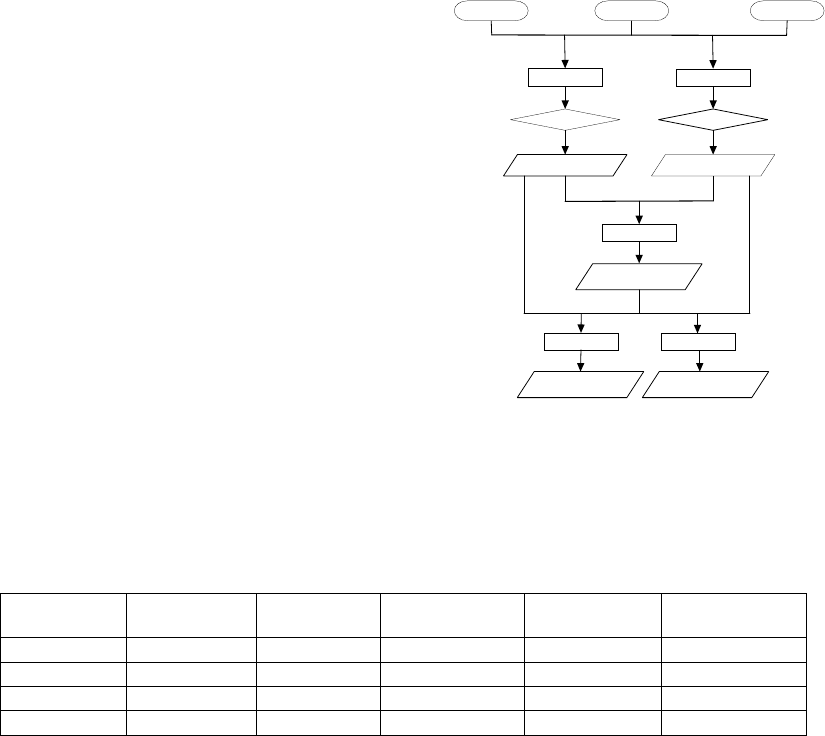
2.5 Method
Taking three time terrain data as an example (Figure
5), the dynamic topographic data E
1
, E
2
, and E
3
are
the DEM data which are corresponding to the time
of t
1
, t
2
and t
3
, respectively. The calculation method
is as follows:
Through the DEM differential calculation , it can
be obtained:
M
1
=E
2
-E
1
; M
2
=E
3
-E
2
;
Regroup the raster data to filter out the raster
dataset with M<0; and then extracts the
corresponding vector data S
1
and S
2
; They are
mining areas stripped in the period of T
1
and T
2
;
The intersection of S
1
and S
2
is performed to
obtain the continuing mining area C
1
which is
stripped in the period between T1 period and T
2
:
S
1
∩S
2
={C
1
∣C
1
∈S
1
, and C
1
∈S
2
}
Differential calculation of S
1
and C
1
to obtain
discontinued mining area D
1
which is stripped in the
period between T
1
and T
2
;
S
1
-C
1
={D1∣D
1
∈S
1
,and D
1
∉S
2
}
Differential calculation of S
2
and C
1
to obtain
progressing mining area P
1
obtained in the period
between T
1
and T
2
;
S
2
-C
1
={P
1
∣P
1
∈S
2
,且 P
1
∉S
1
}
After the calculation process described above,
the mining change areas of D
1
and P
1
in the period
of T
1
and T
2
are obtained, respectively, and the
continuing area is C
1
.
Based on this method, the mining surface area
change in specific mining time is obtained through
DEM differential computation and the calculation of
vector data of the space set. The surface changing is
simulated through the combination of the time series
and topographic data.
3 RESULTS AND ANALYSIS
3.1 Results
The elevation changing datasets are calculated by
differential calculation of DEM data in five times
(t
1
,t
2
,t
3
,t
4
,t
5
), which are M
1
, M
2
, M
3
and M
4
respectively. Then, the mining area datasets, which
is S
1
, S
2
, S
3
, and S
4
, can be extracted as the value of
M
1
, M
2
, M
3
and M
4
are less than zero, it means the
decreasing elevation datasets among the elevation
changing datasets. According to the raster
calculation, the calculation relationship between the
dynamic surface units and the elevation changing
datasets are listed in Table 2. Therefore, the
elevation changing datasets of the dynamic surface
units can be extracted to simulating the open-cast
mining process chronologically.
M
1
<0 M
2
<0
Mining area
S
1
E
1
E
2
E
3
T
1
T
2
M
1
Differential
calculation
M
2
Mining area
S
2
S
1
∩ S
2
S
1
-C
1
S
2
-C
1
Differential
calculation
Continuing
Mining area
C
1
Discontinued
Mining area
D
1
Progressing
Mining area
P
1
Figure 5: Dynamic terrain data calculation method.
Table 2: Elevation changing datasets calculation relationship.
Time Change area Mining area Promoting
mining area
Continuing
mining area
Discontinued
mining area
T
1
M
1
=E
2
-E
1
S
1
=M
1
<0
∕ C
1
=C
1
∩S
1
∕
T
2
M
2
= E
3
-E
2
S
2
=M
2
<0
P
1
=P
1
∩S
2
C
2
=C
1
∩S
2
D
1
=D
1
∩S
1
T
3
M
3
= E
4
-E
3
S
3
=M
3
<0
P
2
=P
2
∩S
3
C
3
=C
3
∩S
3
D
2
=D
2
∩S
2
T
4
M
4
= E
5
-E
4
S
4
=M
4
<0
P
3
=P
3
∩S
4
C
4
=C
4
∩S
4
D
3
=D
3
∩S
3
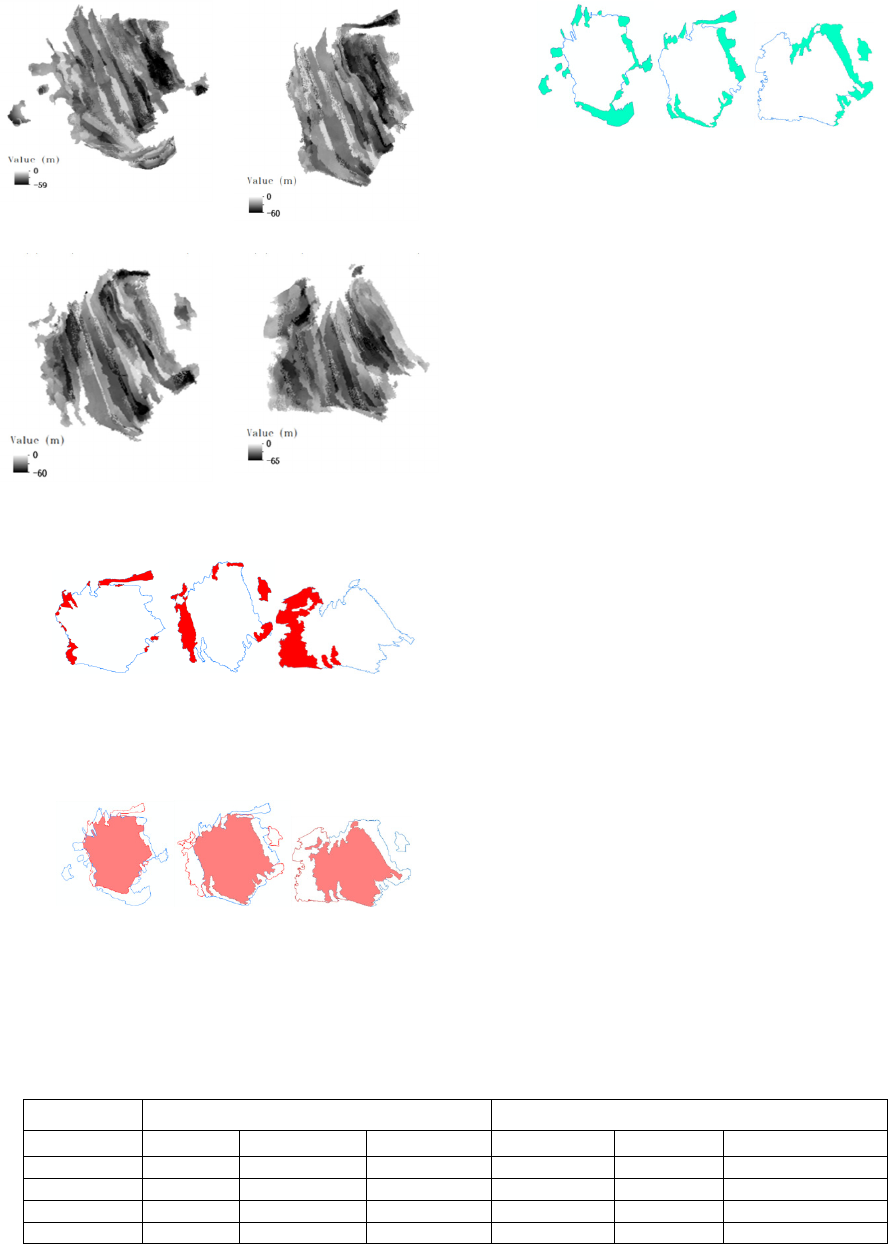
The spatial distribution of the mining area,
during different time intervals of the East open pit
mine, is extracted from the five-phase DEM data
and shown in Figure 6, and the dynamic surface
units area in different stages are shown in Figure 7-9.
Analysis Method of Surface Changes Due to Open-Pit Mining Activities - A Case Study of Pingshuo East Open-Pit Mine in China
453
(
a
)
S
1
(
201507-201501
)
(
b
)
S
2
(
201601-201507
)
(
c
)
S
3
(
201607-201601
)
(
d
)
S
4
(
201701-201607
)
Figure 6: Open-pit mining area.
(a) P
1
(201601-201507) (b) P
2
(201607-201601) (c) P
3
(201701-201607)
Figure 7: Progressing mining area (the red region).
(a) C
1
(201601-201507) (b) C
2
(201607-201601) (c) C
3
(201701-201607)
Figure 8: Continuing mining area (the red region).
(a) D
1
(201507-201501) (b) D
2
(201601-201507) (c) D
3
(201607-201601)
Figure 9: Discontinued mining area (the green region).
3.2 Analysis
In this paper, the variation parameters of mining
area are grouped into geometric changes parameters
and vertical changes parameters in horizontal and
vertical directions, respectively. Geometric changes
parameters are mining area, mining perimeter and
the proportion of total mining area in each region.
The vertical parameters include maximum mining
depth, the average mining depth and standard
mining depth deviation. The change parameters of
the mining area are calculated in Table 3-6. The
statistical analysis of the mining area in each period
are summarized in Figure 10.
Mining area. S
1
has the largest mining area and
perimeter, and the smallest mining depth and
average mining depth; and S
4
has the largest mining
depth, average mining depth and mining depth
standard deviation.
Table 3: Mining area parameters.
Geometric changes parameters Vertical changes parameters
Mining area Area(km
2
) Perimeter(km) Proportion(%) Maximum(m) Average(m) Standard deviation
S
1
2.13 13.57 42.52 59 32 9.58
S
2
1.75 9.22 34.93 60 32.5 9.63
S
3
1.72 12.65 34.33 60 32 10.7
S
4
1.79 13.05 35.73 65 35 11.62
IWEG 2018 - International Workshop on Environment and Geoscience
454
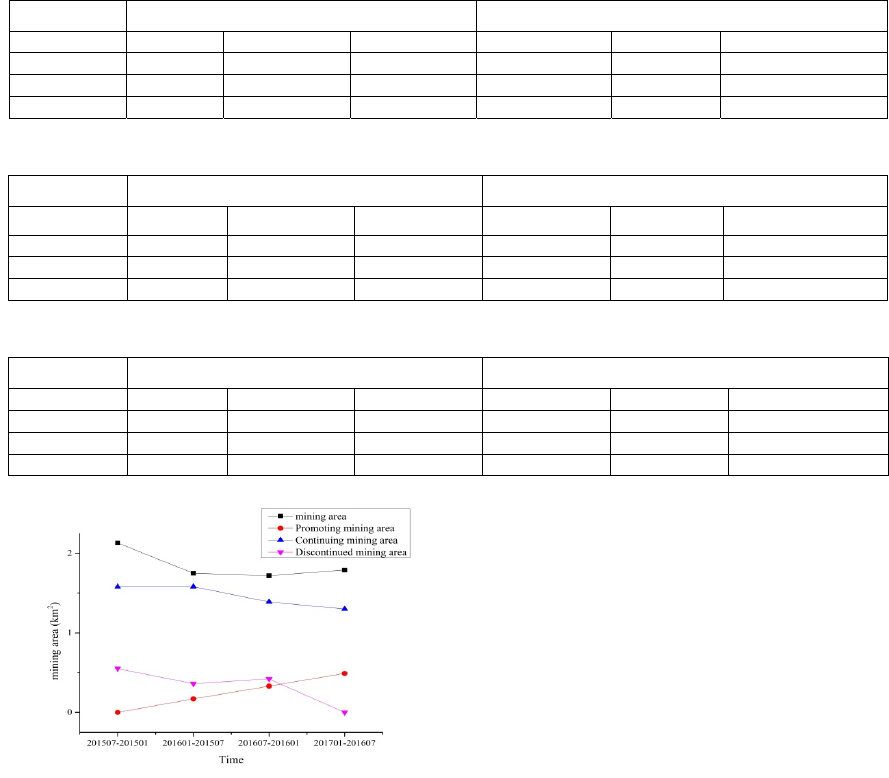
Table 4: Promoting mining area parameters.
Geometric changes parameters Vertical changes parameters
Mining area Area(k
m
2
) Perimeter(km) Proportion(%) Maximum(m) Average(m) Standard deviation
P
1
0.17 7.38 3.39 60 32 18.18
P
2
0.33 7.62 6.59 57 29 16.45
P
3
0.49 9.01 9.78 65 33 18.76
Table 5: Continuing mining area parameters.
Geometric changes parameters Vertical changes parameters
Mining area Area(km
2
) Perimeter(km) Proportion(%) Maximum(m) Average(m) Standard deviation
C
1
1.58 7.84 31.54 54 27.5 15.59
C
2
1.39 9.02 27.74 60 31.6 18.06
C
3
1.3 11.18 25.95 63 32 18.18
Table 6: Discontinued mining area parameters.
Geometric changes parameters Vertical changes parameters
Minin
g
area Area
(
k
m
2
)
Perimeter
(
km
)
Pro
p
ortion
(
%
)
Maximum
(
m
)
Avera
g
e
(
m
)
Standard deviation
D
1
0.55 14.7 10.98 59 29.5 16.74
D
2
0.36 8.96 7.19 60 32.5 16.16
D
3
0.42 11.89 8.38 64 32.08 18.31
Figure 10: Analysis of mining area and dynamic surface
units.
Progressing mining area. In T
4
period (as P
3
), the
mining area and perimeter are largest, the value of
mining depth, the average mining depth and mining
depth standard deviation are the largest.
Continuing mining area. C
1
is the largest in the
continuing mining areas, the largest mining
circumference is C
3
, and C
3
has the maximum
mining depth, and the lagest average mining depth
and mining depth standard deviation.
Discontinued mining area. D
1
is the area with the
largest circumference and the area has the shortest
circumference is D
2
. In addition, D
2
has the largest
average mining depth, and D
3
has the largest
standard deviation of the maximum mining depth.
The area composition of each dynamic unit and
mining area is shown in Figure 11. Due to the
relationship model between mining activity and
dynamic data, the mining area is decomposed into
dynamic units, which is specifically expressed as
follows:
The mining area S
1
corresponding to the initial
time interval can be decomposed into combination
of continuing mining area C
1
and discontinued
mining area D
1
;
The mining area S
2
corresponding to the second
period of time interval and the mining area S
3
corresponding to the third period of time interval
can be decomposed into two combinations of
dynamic units; one is combination of continuing
mining area and promoting mining area, and the
other is the combination of continuing mining area
and discontinued mining area;
The mining area S
4
corresponding to the last
period of time can be decomposed into
acombination of continuing mining area and
promoting mining area.
In each dynamic change units, the continuing
mining area is the largest region, the area range is
[1.3, 1.58]; the promoting mining area is the
smallest, and the area range is [0.17, 0.49]. The
results show the mining surface change is affected
by continuous mining more than the promoting
mining within the mining period.
Analysis Method of Surface Changes Due to Open-Pit Mining Activities - A Case Study of Pingshuo East Open-Pit Mine in China
455
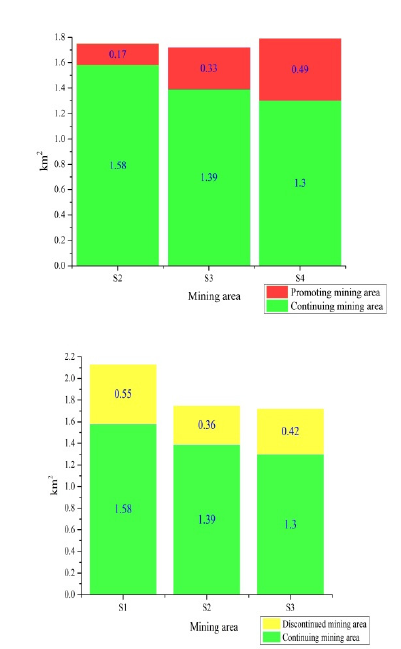
Figure 11: Dynamic surface units statistical histogram.
4 CONCLUSIONS
In this study, a fast, effective and low-cost data
calculation method was proposed to simulate surface
mining process through analyzing the temporal and
spatial variation characteristics of open-pit mining
process. Using the spatio-temporal data model,
DEM calculation method and spatial datasets
operation, the surface dynamic process evaluation in
the open-pit mine can be numerical simulated and
analyzed practically.
The conclusions are as below:
According to the correlation between"vertical
dynamics" and "horizontal dynamics" of the mining
engineering activities, the regular pattern between
"vertical deformation" and "surface change" is
excavated, and the spatial-temporal calculation
model of open-pit mining is established;
The key point of this method is that the mining
changing area is divided into three dynamic surface
units. According to the dynamic process of mining,
the mining surface is decomposed into three
dynamic surface units to simulate the dynamic
surface processes coupled with the mining
engineering activities;
Through the differential calculation of multi-
period DEM data and the spatial relationship
calculating of dynamic region, the spatio-temporal
process of the open-pit mining surface is simulated
effectively. The method can not only analysis the
dynamic change and realize three-dimensional
visualization, but also quantitatively evaluate the
surface mining change.
REFERENCES
Brown A G, Tooth S and Chiverrell R C, et al. 2013 The
Anthropocene: is there a geomorphological case?
Earth Surface Processes & Landforms 38(4) 431-434
Carley J K, Pasternack G B and Wyrick J R, et al. 2012
Significant decadal channel change 58–67 years post-
dam accounting for uncertainty in topographic change
detection between contour maps and point cloud
models Geomorphology 179 71-88
Chen J, Li K and Chang K J, et al. 2015 Open-pit mining
geomorphic feature characterisation International
Journal of Applied Earth Observation &
Geoinformation 42 76-86
Ellis E C 2011 Anthropogenic transformation of the
terrestrial biosphere Philosophical Transactions
369(1938) 1010-1035
Foley J A, Defries R and Asner G P, et al. 2005 Global
Consequences of Land Use Science 309(5734) 570-574
Haas F, Hilger L and Neugirg F, et al. 2016 Quantification
and analysis of geomorphic processes on a recultivated
iron ore mine on the Italian island Elba using long-time
ground-based LIDAR and photogrammetric data by an
UAV Natural Hazards & Earth System Sciences 3(10)
6271-6319
Hu W and Wu L 2016 Ground Deformation Extraction
Using Visible Images and LIDAR Data in Mining Area
ISPRS - International Archives of the Photogrammetry
Remote Sensing and Spatial Information Sciences
XLI-B7 505-512
James L A, Hodgson M E and Ghoshal S, et al. 2012
Geomorphic change detection using historic maps and
DEM differencing: The temporal dimension of
geospatial analysis Geomorphology 137(1) 181-198
Martín‐Duque J F, Sanz M A and Bodoque J M, et al.
2010 Restoring earth surface processes through
landform design. A 13 ‐ year monitoring of a
geomorphic reclamation model for quarries on slopes
Earth Surface Processes & Landforms 35(5) 531-548
Neugirg F, Kaiser A and Schmidt J, et al. 2015
Quantification, analysis and modelling of soil erosion
on steep slopes using LiDAR and UAV photographs
Proceedings of the International Association of
Hydrological Sciences 367 51-58
IWEG 2018 - International Workshop on Environment and Geoscience
456
Schaffrath K R, Belmont P and Wheaton J M 2015
Landscape-scale geomorphic change detection:
Quantifying spatially variable uncertainty and
circumventing legacy data issues Geomorphology 250
334-348
Tarolli P 2014 High-resolution topography for
understanding Earth surface processes: Opportunities
and challenges Geomorphology 216 295-312
Tarolli P and Sofia G 2016 Human topographic signatures
and derived geomorphic processes across landscapes
Geomorphology 255(4) 40-161
Tong X, Liu X and Chen P, et al. 2015 Integration of
UAV-Based Photogrammetry and Terrestrial Laser
Scanning for the Three-Dimensional Mapping and
Monitoring of Open-Pit Mine Areas Remote Sensing
7(6) 6635-6662
Yucel M A and Turan R Y 2016 Areal Change Detection
and 3D Modeling of Mine Lakes Using High-
Resolution Unmanned Aerial Vehicle Images Arabian
Journal for Science & Engineering 41(12) 1-12
Zhu W B and Zhang J 2017 A method of building the
Open-pit mine DEM based on hierarchical constraint
TIN Science of Surveying and Mapping 42(7) 160-
164(in Chinese)
Analysis Method of Surface Changes Due to Open-Pit Mining Activities - A Case Study of Pingshuo East Open-Pit Mine in China
457
