
The Design and Development of the Hainan Province "Digital Ocean"
Platform and Applications on Natural Disasters Prevention and
Reduction
Lei Wang
1,2,*
and Xin Zhang
1
1
Institute of Remote Sensing and Digital Earth, Chinese Academy of Sciences, Beijing 100094, China;
2
Key Laboratory of Earth Observation of Hainan Province, Sanya Institute of Remote Sensing, Sanya, Hainan Province
572029, China.
Email: wanglei98@radi.ac.cn.
Keywords: Digital Ocean, Hainan Province, natural disasters prevention and reduction
Abstract: Since the Hainan Province is located at the south end of China, it is the key province to implement the Belt
and Road initiative. In order to support the construction of international tourism island and Digital Hainan
Province, it is required to build Hainan Province "Digital Ocean" platform to integrate ocean environment
three-dimensional (3D) monitoring data, including sea, land and air data, to support ocean information
visualization and decision-making support. Because of the complex of ocean data, such as spatio-temporal,
3D and dynamics, new technical framework of "Digital Ocean" platform and new techniques, such as
multisource spatial data organization and management and self-adaptive visualization, need to be
developed. This paper introduces the design and development of Hainan Province "Digital Ocean" platform,
with characteristics of “software, data and services all-in-one integration” and “dynamic, high-resolution,
automatic ocean information procession”, and its applications on natural disasters prevention and reduction.
The technical framework and development method of ocean 3D visualization model based on earth sphere
model are introduced. The key techniques, such as multisource, mass spatial data organization and
management, mass spatial information self-adaptive visualization, submarine, seacoast, island 3-D
visualization, and the multi-layer, multi-time information visualization, are developed. The Super Typhoon
Sarika, which happened in Sanya city on October 2016, is used as a case study to demonstrate the whole
process of forecasting, risk prediction, and disaster assessment of typhoon storm surge. This platform will
be a base to integrate ocean environment 3D monitoring data and other ocean information resources of
Hainan Province. The construction of Hainan Province "Digital Ocean" platform will boost the development
of ocean informatization and ocean economic industry, and help to build a “Strong Ocean Province”.
1 INTRODUCTION
The Hainan Province is the biggest province in
China, with around 204 square kilometres areas,
including around 200 square kilometres ocean areas.
Since it is located at the south end of China, it is the
key province to implement the Belt and Road
initiative. However, Hainan Province is also one of
the most serious provinces of ocean disaster in
China. In 2016, 16 people was dead and the
economic loss is around 0.569 billion Yuan due to
the ocean disaster. The main disasters are storm
surge, sea wave and coast erosion. The 3D
monitoring data from buoy, submerged buoy,
ground wave radar and monitoring station are
important for ocean disaster monitoring and
forecasting and have the characteristics of
networking acquire, distributed storage and spatial-
temporal dynamics. “Digital Ocean” platform is the
base for ocean information acquire and processing,
ocean disaster monitoring and forecasting, ocean
information production and services of ocean
pollution forecasting and loss evaluation, it is an
important support of ocean disasters prevention and
reduction.
There are a lot of studies on Digital Earth (Chen
and Genderen, 2008; Goodchild, 200; Guo et al.,
2009; Guo et al., 2010) and Digital Ocean (Hou,
1999; Su et al., 2006; Zhang et al., 2011; Dong et al.,
2010; Patrikalakis et al., 2000; Zhang et al., 2017),
however, few studies were focus on province or city
458
Wang, L. and Zhang, X.
The Design and Development of the Hainan Province "Digital Ocean" Platform and Applications on Natural Disasters Prevention and Reduction.
In Proceedings of the International Workshop on Environment and Geoscience (IWEG 2018), pages 458-462
ISBN: 978-989-758-342-1
Copyright © 2018 by SCITEPRESS – Science and Technology Publications, Lda. All rights reserved

level. In order to support the construction of
international tourism island and Digital Hainan
Province, it is required to build Hainan Province
"Digital Ocean" platform to integrate all ocean
environment 3D monitoring data, including sea, land
and air data to support ocean information
visualization and decision-making support. Because
of the complex of ocean data, such as spatio-
temporal, 3D and dynamics, new technical
framework of "Digital Ocean" platform and new
techniques such as multisource spatial data
organization and management and self-adaptive
visualization need to be developed.
This paper introduces the design and
development of Hainan Province "Digital Ocean"
platform, with characteristic of “software, data and
services all-in-one integration” and “dynamic, high-
resolution, automatic ocean information
procession”, and its applications on natural disasters
prevention and reduction.
2 SYSTEM DESIGN
The Hainan Province "Digital Ocean" Platform is an
integrated system that integrates ocean factor
visualization and ocean phenomenon visualization
models, databases, graphical user interfaces, and
ocean information services to help the public and
decision makers for ocean information sharing
(Figure 1). It also can be used for natural disasters
prevention and reduction for forecasting, risk
prediction, and disaster loss assessment of typhoon
storm surge.
This system has a multi-tier architecture
consisting of presentation, business logic, and data
tiers. Figure 1 provides an overview of system
architecture. The presentation tier is the interface for
users to interact with system, users can submit
requests from the presentation tier, and it also can be
used as the system client viewer for accessing 3D
ocean factor and phenomenon visualization
information. The business tier copes with the
requests from the presentation tier. The business tier
has three parts, including spatial database engine and
metadata management, ocean information 3D
visualization model and ocean information services.
The data tier includes all available data sources,
such as basic geographic database, remote sensing
image database, ocean basic geographic database
and 3D and dynamic ocean database. The database
server is used to manage those sharing databases in
this system, and it also supplies data services for the
application server and spatial analysis and model
analysis server.
3 THE CONSTRUCTION OF 3D
VISUALIZATION MODEL
BASED ON EARTH SPHERE
MODEL
As the base of Hainan Province "Digital Ocean"
platform, the construction of 3D visualization model
based on earth sphere model is very important, the
technical realizations are as following: firstly, the
reference datum of earth sphere model is defined as:
the model is based on the 3D coordinate system of
the earth centroid as the original point O, it is a
right-handed Cartesian coordinate system with Z
axis pointing north direction, Y axis is from west to
east, and the X axis is the orthogonal basis of Z and
Y axis; secondly, the Digital Orthophoto Maps
(DOM) is fused with Digital Elevation Model (DEM)
to create real 3D terrain model by project
transformation, geometric transformation (including
pan, rotation, zoom in and zoom out etc.) and
texture mapping using DirectX; then through the
overlay of vector data with DEM and integration of
building model, scene model and facility model with
terrain model to implement 3D visualization model
based on earth sphere model. Finally, navigation
operations such as rotation, pan, zoom in and zoom
out, and spatial query are implemented by using free
Active X in client side.
The construction of 3D visualization model
includes the following 5 steps.
The Design and Development of the Hainan Province "Digital Ocean" Platform and Applications on Natural Disasters Prevention and
Reduction
459
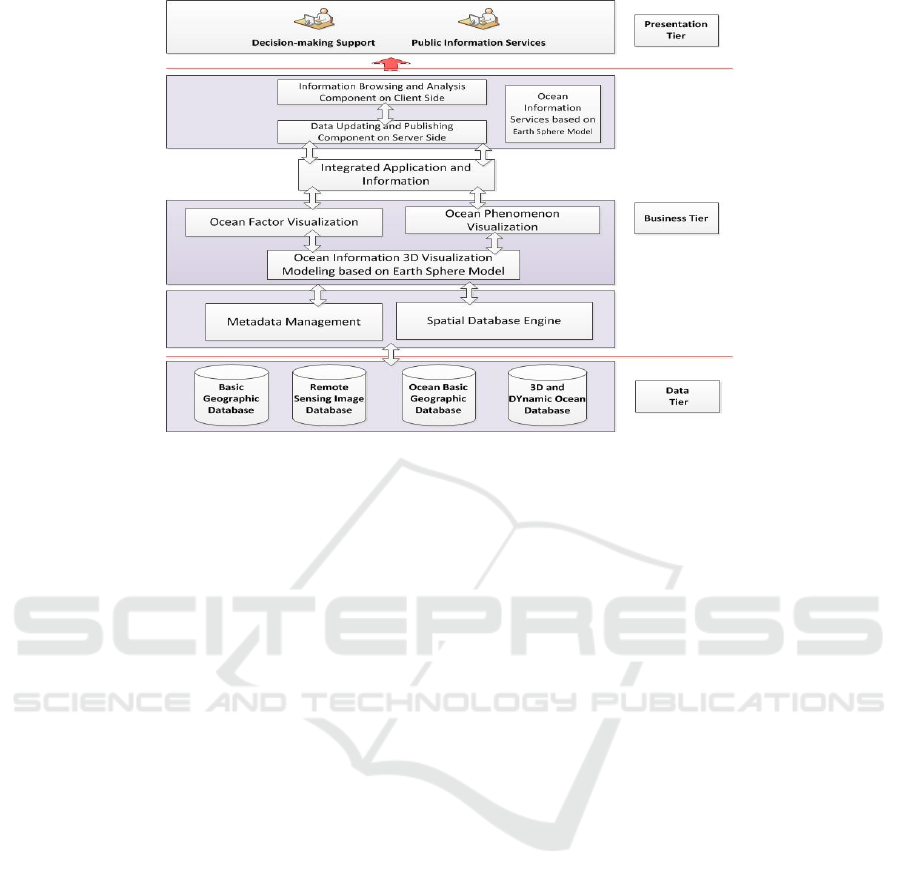
Figure 1: System design.
3.1 The Modeling of Earth Sphere
The modeling of earth sphere includes the following
steps, the establishment of earth sphere model, the
calculation of sphere parameter, and sphere surface
grid generation.
3.2 The Construction of Terrain Field
The data used in "Digital Ocean" system include
terrain data, remote sensing images, and texture data
etc. The construction of terrain field means
integration, merging, and overlay of remote sensing
images, texture and DEM data to implement 3D
visualization model based on earth sphere model and
exporting to terrain field files.
3.3 Vector Data Overlay and
Visualization.
The vector data used in "Digital Ocean" system
include basic geographic data (administrative
boundary, river, water course and road) and thematic
data (ocean resources distribution, biochemistry
factor distribution and water-depth distribution etc.)
consisting of point, line and polygon, all of these
data need to be integrated in "Digital Ocean"
system. Vector data overlay and visualization mean
the overlay of these vector data into 3D terrain field
based on earth sphere model and exporting to vector
field files.
3.4 3D Modeling and Integration
The 3D models in the "Digital Ocean" system
consist of building models, scene models and
facility models. Among them, building models
include port, dock, observation station etc. models;
scene models include trees, fish, dam, light tower
and seabed pipeline models; facility models include
airplane and ship models. 3D modeling and
integration mean building, scene and facility
modeling and overlay these models into vector data
and 3D terrain field to implement 3D visualization
model based on earth sphere model. There are two
ways of modeling: one is modeling using 3D
modeling software such as 3dMax, another is
modeling in vector and terrain fields based on earth
sphere model.
3.5 Navigation Operations Based on
Earth Sphere Model
The navigation operations based on earth sphere
model include rolling, zoom in, zoom out, pan,
attribute queries, length and area measure etc.,
which are the base of sphere operation.
3.6 Publishing of Field Data
The publishing of field data includes publishing of
terrain field, vector field and model field data. When
these field data are published, users in the client side
could select any of vector field and model field data
IWEG 2018 - International Workshop on Environment and Geoscience
460
and load them into terrain field. Among them, a tool
need to be developed to publish the terrain field data
and Internet Information Services (IIS) could be
used to publish the vector field and model field data.
4 KEY TECHNIQUES
DEVELOPMENT
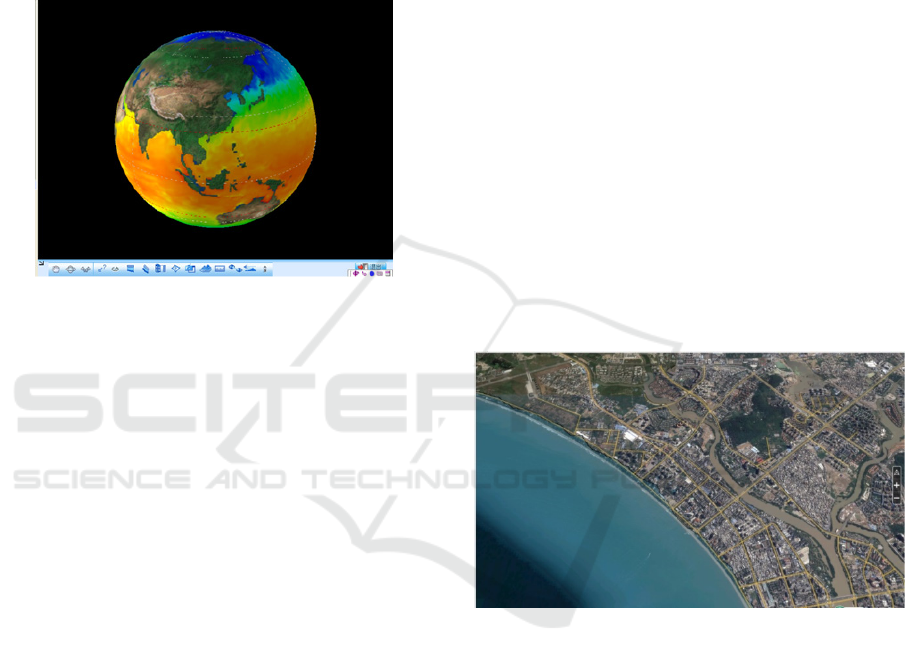
Figure 2: Sea temperature visualization on 3D
visualization model.
The key techniques, such as multisource, mass
spatial data organization and management and mass
spatial information self-adaptive visualization
oriented "Digital Ocean", are developed.
Furthermore, the key techniques of submarine,
seacoast, island 3-D visualization are developed to
implement submarine roaming based on DEM and
topographical and physiognomic data. Finally, the
multi-layer, multi-time information (e.g. hydrology
and meteorology information) visualization
techniques are developed to implement visualization
and information queries of ocean disasters
information field (Figure 2).
5 SYSTEM DEVELOPMENT AND
APPLICATIONS ON NATURAL
DISASTERS PREVENTION
AND REDUCTION
The Skyline software is used to implement the
Hainan Province "Digital Ocean" platform and
applications on natural disasters prevention and
reduction. The Super Typhoon Sarika, which
happened in Sanya city on October 2016, is used as
a case study to demonstrate the whole process of
forecasting, risk prediction, and disaster assessment
of typhoon storm surge.
The Super Typhoon Sarika, which happened
October 17-18 2016, made lots of economic loss in
Sanya city. The tidal level data collected in three
tidal stations in Sanya city were used to show the
whole process of tidal up and down caused by the
Super Typhoon Sarika. The flood submerge areas
with different tidal levels were showed on the 3D
visualization model based on earth sphere model
with the help of the key techniques developed such
as 3-D visualization and multi-layer, multi-time
information visualization (Figure 3). The "Digital
Ocean" platform will be a very useful tool for the
city management decision makers, such as
department of ocean of Sanya City, to use for
forecasting, risk prediction, and disaster assessment
of typhoon storm surge. The spatial query tool will
be used to query the tidal level information of each
tidal station during the whole process of the Super
Typhoon Sarika. The spatial analysis and query
tools will be used to create and show the flood risk
and disaster assessment maps on the 3D
visualization model, which will help the decision
makers to query flood submerge areas, flood risk,
flood loss information and decision making support
for storm surges disasters prevention and reduction.
Figure 3: Flood submerge areas simulation with 3m tidal
levels on 3D visualization model.
6 CONCLUSIONS
This paper introduces the design and development of
Hainan Province "Digital Ocean" platform, with
characteristics of “software, data and services all-in-
one integration” and “dynamic, high-resolution,
automatic ocean information procession”, and its
applications on natural disasters prevention and
reduction. The technical framework and
development method of ocean 3D visualization
model based on earth sphere model are introduced.
The key techniques, such as multisource, mass
spatial data organization and management and mass
The Design and Development of the Hainan Province "Digital Ocean" Platform and Applications on Natural Disasters Prevention and
Reduction
461

spatial information self-adaptive visualization
oriented "Digital Ocean", are developed.
Furthermore, the key techniques of submarine,
seacoast, island 3-D visualization are developed to
implement submarine roaming based on DEM and
topographical and physiognomic data. Finally, the
multi-layer, multi-time information (e.g. hydrology
and meteorology information) visualization
techniques are developed to implement information
query of ocean disasters information field. The
Super Typhoon Sarika, which happened in Sanya
city on October 2016, is used as a case study to
demonstrate the whole process of forecasting, risk
prediction, and disaster assessment of typhoon storm
surge. This platform will be a base to integrate ocean
environment 3D monitoring data (e.g. sea, land and
air data) and all other ocean information resources of
Hainan Province. The construction of Hainan
Province "Digital Ocean" platform will boost the
development of ocean informatization and ocean
economic industry, and help to build a “Strong
Ocean Province”.
ACKNOWLEDGMENTS
The author expresses the appreciation of funds
received from
Hainan Provincial Natural Science
Foundation of China
(#20164178) and Hainan
Province major science and technology projects
(#ZDKJ2016015-1).
REFERENCES
Chen S P and Genderen J 2008 Digital earth in support of
global change research International Journal of Digital
Earth 1(1) 43–65
Dong W, Zhang X, Jiang, B 2010 Service-based
distributed data management and application in China
Digital Ocean Geoscience and Remote Sensing
Symposium (IGARSS) 2010 IEEE International 425-
428
Goodchild M F 2008 The use cases of digital earth
International Journal of Digital Earth 1(1) 31–42
Guo H D, Fan X T and Wang C L 2009 A Digital Earth
Prototype System: DEPS/CAS International Journal of
Digital Earth 2(1) 3–15
Guo H D, Liu Z and Zhu L W 2010 Digital Earth: decadal
experiences and some thoughts. International Journal
of Digital Earth 3(1) 31–46
Hou W F 1999 Tentative idea for development of “Digital
Ocean”. Aviso of Ocean 18(6) 1–10
Patrikalakis N M, Abrams S L, Bellingham J G, Cho W,
Mihanetzis K P, Robinson A R, Schmidt, H and
Wariyapola P C H 2000 The Digital Ocean. In
Proceedings of Computer Graphics International GCI
'2000 IEEE Computer Society Press Los Alamitos
Su F Z, Du Y Y and Pei X B 2006 Constructing digital sea
of China with the datum of coastal line Geo-
Information Science 8(1) 12–15
Zhang X, Dong W, Li S, Luo J and Chi T 2011 China
Digital Ocean Prototype System. International Journal
of Digital Earth 4(3) 211-222
Zhang X, Wang L, Jiang X and Zhu C (eds) 2017
Modeling with Digital Ocean and Digital Coast.
Coastal Research Library 18 Springer, Cham
IWEG 2018 - International Workshop on Environment and Geoscience
462
